HAL Id: hal-02938715
https://hal.archives-ouvertes.fr/hal-02938715
Submitted on 15 Sep 2020
HAL is a multi-disciplinary open access archive for the deposit and dissemination of sci-entific research documents, whether they are pub-lished or not. The documents may come from teaching and research institutions in France or abroad, or from public or private research centers.
L’archive ouverte pluridisciplinaire HAL, est destinée au dépôt et à la diffusion de documents scientifiques de niveau recherche, publiés ou non, émanant des établissements d’enseignement et de recherche français ou étrangers, des laboratoires publics ou privés.
Athermal dislocation strengthening in UO2
Luc Portelette, Jonathan Amodeo, Ronan Madec, Bruno Michel
To cite this version:
Luc Portelette, Jonathan Amodeo, Ronan Madec, Bruno Michel. Athermal dislocation strengthening in UO2. Journal of Nuclear Materials, Elsevier, 2020. �hal-02938715�
1
Athermal dislocation strengthening in UO
2Luc Portelette1, Jonathan Amodeo2, Bruno Michel1*, Ronan Madec3
1 CEA, DEN, DEC, SESC, LSC bat 151 Centre de Cadarache F-13108 Saint Paul Lez
Durance, France
2 Université de Lyon, INSA-Lyon, CNRS, MATEIS UMR5510, F-69621 Villeurbanne,
France
3 CEA, DAM, DIF, F-91297 Arpajon, France
Published in Journal of Nuclear Materials as:
L. Portelette, J. Amodeo, B. Michel, R. Madec, ‘’ Athermal dislocation strengthening in UO2’’,
Journal of Nuclear Materials, 538 (2020) 152157
(*) Corresponding author: Bruno Michel
2
Athermal dislocation strengthening in UO
2Abstract
Understanding the mechanical behavior of uranium dioxide (UO2) at high-temperature is of great interest to predict the behavior of the nuclear fuel under incidental operating conditions. Here, strengthening elementary processes and dislocation hardening coefficients are studied by the mean of Dislocation Dynamics (DD) simulations in UO2. The three slip modes of the fluorite structure i.e., ½<110>{100}, ½<110>{110}
and ½<110>{111} are modelled and all the possible dislocation configurations are analyzed and discussed. Averaged hardening coefficients are derived and their sensitivity to the sample orientation is discussed in the light of the seminal experimental work of Sawbridge and Sykes. This DD study gives rise to new insights about UO2 mechanical
behavior at high-temperature.
Introduction
Uranium dioxide (UO2) is the main primary fuel material of nuclear power plant. The
understanding of its mechanical behavior is of first glance, especially in the context of incidental operating conditions of the reactor, where the cladding tube can have a mechanical interaction with the pellet. This pellet-to-cladding reaction has to be considered regarding its potential impact on the structural integrity of the cladding, which is the first confinement barrier for radioactive elements. While the macroscopic link between the fuel pellet mechanical properties and the cladding tube were qualitatively drawn [1–3], several multiphysics aspects including mechanical, thermal and irradiation considerations are still required to better understand the multi-scale context of the fuel evolution. In this study, we will focus on the deformation and strain-hardening of
non-irradiated UO2 single crystals at high-temperature (T>1350 K), in a temperature regime
3
UO2 has the fluorite structure (a0=5.47 Å) and is characterized by a brittle-to-ductile
transition for temperatures larger than 800 K. At these temperatures, dislocation glide occurs in ½<110>{100} and ½<110>{110} slip systems (referred respectively as modes I and II in the following) and, more controversially, in ½<110>{111} (mode III) [4–13]. Single crystal Critical Resolved Shear Stresses (CRSS) in {100} and {110} show significant variations when varying the temperature, typical of materials with high lattice friction. These variations are attributed to thermally-activated dislocation glide processes (e.g., kink-pair mechanism) [10,11,14,15]. Very few is known about the athermal temperature
transition Ta (the temperature at which CRSS reach a plateau) in UO2. In the original work
of Lefebvre et al. [10], 𝑇𝑎𝐼 is expected to be close to 1400 K whereas Portelette et al. [16]
recently claim a larger value of 𝑇𝑎𝐼=1750 K by combining CRSS experimental
measurements from different sources. Given the same temperature range, dislocation slip in ½<110>{110} is characterized by slightly larger CRSS values that continuously
decrease rising the temperature up to 𝑇𝑎𝐼𝐼~2000 K [16]. Nonetheless, one can assume that
mode II is characterized by a weak lattice friction for T>1350 K and CRSS of few tens of MPa only. Dislocation glide has not been yet isolated within mode III slip systems and no
CRSS (and no 𝑇𝑎𝐼𝐼𝐼) were derived up to now. Indeed, very few TEM studies dedicated to
dislocations in UO2 exist in the literature [7,9–11].
Atomistic simulations using semi-empirical potentials were performed in UO2 to
investigate CRSS versus temperature variations [15,17,18]. Fossati et al. [17] show that ½<110>{100} is the softer slip mode using molecular dynamics (MD). On the other hand, the authors show that ½<110>{110} is harder than ½<110>{111}. Lunev et al. used MD to investigate more in the details the elementary processes responsible for the mobility of ½<110>{100} edge [14] and ½<110>{110} screw [19] dislocations. In addition, Soulié [15] used the variable charges SMTBQ parameterization and molecular statics to describe {100} edge dislocation gliding by a kink-pair process. While these atomistic studies provide some information on isolated dislocations (kink-pairs, defect clusters formation,
self-pinning), none of them can give a clear description of UO2 single crystal deformation.
In the temperature range relative to incidental conditions (T>1350 K), ½<110>{100}
CRSS in UO2 are particularly close to the athermal transition [7,10,11,15–17]. At T=1600
4
description of the plastic anisotropy observed in the experiments presuming of the important role of the forest hardening (typical of the athermal regime). In the athermal regime, forest hardening is usually rationalized by the mean of the generalized Taylor’s equation (equation (1)) and dislocation interaction coefficients (asu) as introduced by Franciosi [20] .
𝜏𝑐𝑠 = 𝜇𝑏√∑ 𝑎𝑠𝑢𝜌𝑢 𝑢
(1)
Where 𝜏𝑐𝑠 is the critical shear stress for dislocation slip in system s crossing u forest
systems with ρu the dislocation density in each forest system. μ is the shear modulus and
b is the magnitude of the Burgers. asu is the dislocation interaction coefficient between the
systems s and u. This equation is derived from Taylor’s equation [21,22] where a mean interaction coefficient α is used.
In this study, we propose to use Dislocation Dynamics (DD) to investigate the strengthening of UO2 single crystal within the athermal regime to better capture UO2
mechanical behavior under incidental conditions. DD is a mesoscale simulation method originally developed to study the collective behavior of dislocations [23–25]. When used with periodic boundary conditions [26,27], DD simulations are particularly useful to study the bulk material mechanical response using a representative volume element. In particular, it allows to correlate the stress response of the crystal relatively to its dislocation density content. Recently, many studies took the advantage of DD simulations to determine dislocation interaction coefficients using equation (1) as e.g., in FCC crystals [28–32], in BCC crystals [32–34], in HCP crystals [31,35] and other complex crystallography such as MgO [36] and olivine [37].
Here, DD is applied to UO2 fluorite where first, dislocation-dislocation interactions are
investigated computing dislocation reaction maps and using several elastic models. Thus, dislocation interaction coefficients are estimated and compared to values obtained for several other materials. Thus, averaged coefficients are derived using the composition law (equation (1)) and the influence of orientations is addressed. Finally, results are discussed
5
leading to an interpretation of the seminal mechanical experiments of Sawbridge and Sykes in UO2 single crystal [8].
Slip systems, interactions and symmetries in UO2
UO2 slip systems
UO2 deformation is characterized by dislocation glide in ½<110>{100}, ½<110>{110}
and , possibly, ½<110>{111} slip systems. Table 1 references the slip systems of the fluorite structure. Burgers vectors are numbered from 1 to 6 and letters are used to characterize individual slip plane i.e., from A to C for the {100} planes, from A to F for the six {110} slip systems and from A to D for {111} slip, following the Schmid and Boas notation [38].
6
Table 1: List of UO2 slip systems. Burgers vectors and the {111} slip mode are labeled using the Schmid and Boas notation [38]. Additional notations are proposed for {100} and {110} slip modes and a list of slip systems is provided for each Burges vectors.
Schmid and Boas notation for Burgers vectors
1[011] 2 [011̅] 3 [101] 4 [101̅] 5 [11̅0] 6 [110]
{100} slip planes labels (letter + I)
AI (100) BI (010) CI (001)
{110} slip planes labels (letter + II)
AII (011̅) BII (011) CII (101̅) DII (101) EII (110) FII (11̅0)
{111} slip planes labels (letter + III), following Schmid and Boas notation
AIII (11̅1̅) BIII (111) CIII (111̅) DIII (11̅1)
Burgers vectors and relative slip planes for the three modes of UO2
Burgers vectors I slip system II slip system III slip systems
1 AI1 AII1 CIII1 , DIII1 2 AI2 BII2 AIII2 , BIII2 3 BI3 CII3 AIII3 , CIII3 4 BI4 DII4 BIII4 , DIII4 5 CI5 EII5 BIII5 , CIII5 6 CI6 FII6 AIII6 , DIII6
Symmetries and dislocation reactions in UO2
Table 2: Interactions between dislocations in UO2. “αi“ refers to the coefficient index of the strengthening matrix (see Table S1 in supplementary materials). “Example of slip system interaction” provides a typical pair of slip systems using Table 1 denomination (primary and forest systems are ranked respectively first and second, except for stared coefficients). “Interaction ID” are labelled as self, dipole, glissile, Hirth, collinear and sessile. Self and dipole account respectively for self (without distinction between slip modes) and dipolar interactions when interacting Burgers vectors differ. Glissile, Hirth, collinear and sessile refer to the different types of junctions. Dipoles and junctions are labeled using intersecting modes, as subscript, and specific property, as junction plane or reaction orientation, as superscript. Glissile refers to junctions lying in fluorite crystallographic slip plane. Note that the FCC Lomer junction which is originally sessile in metals is glissile in UO2, and referenced as 𝑔𝑙𝑖𝑠𝑠𝑖𝑙𝑒𝐼𝐼𝐼/𝐼𝐼𝐼𝐼,𝐿 . Sessile is for a/2<110> junction not lying in fluorite crystallographic slip plane. Hirth refers for weaker
7
junctions with a a<100> Burgers vectors. Collinear is for collinear interaction and is labeled using the angle between cross slip planes, as superscript.
αi Example of slip system interaction Interaction ID αi Example of slip system interaction Interaction ID I/I α0' AI1, AI1 𝑠𝑒𝑙𝑓 III/III α11 CIII1, CIII3 𝑑𝑖𝑝𝑜𝑙𝑒𝐼𝐼𝐼/𝐼𝐼𝐼 α1 AI1, AI2 𝑑𝑖𝑝𝑜𝑙𝑒𝐼/𝐼 α12 CIII1, BIII4 𝑔𝑙𝑖𝑠𝑠𝑖𝑙𝑒 𝐼𝐼𝐼/𝐼𝐼𝐼𝐼,𝐿 α2 AI1, BI3 𝑔𝑙𝑖𝑠𝑠𝑖𝑙𝑒𝐼/𝐼𝐼𝐼 I/III α13, α13* AI1, CIII1 𝑐𝑜𝑙𝑙𝑖𝑛𝑒𝑎𝑟𝐼/𝐼𝐼𝐼55° II/II α3 AII1, BII2 𝐻𝑖𝑟𝑡ℎ𝐼𝐼/𝐼𝐼 α14, α14* AI1, AIII2 𝐻𝑖𝑟𝑡ℎ𝐼/𝐼𝐼𝐼 α4 AII1, CII 3 𝑠𝑒𝑠𝑠𝑖𝑙𝑒 𝐼𝐼/𝐼𝐼 {112} α15, α15* AI1, AIII3 𝑔𝑙𝑖𝑠𝑠𝑖𝑙𝑒 𝐼/𝐼𝐼𝐼𝑎𝐼𝐼𝐼 I/II α5, α5* AI1, AII1 𝑐𝑜𝑙𝑙𝑖𝑛𝑒𝑎𝑟𝐼/𝐼𝐼90° α16, α16* AI1, CIII3 𝑔𝑙𝑖𝑠𝑠𝑖𝑙𝑒𝐼/𝐼𝐼𝐼𝑏𝐼𝐼𝐼 α6, α6* AI1, BII2 𝐻𝑖𝑟𝑡ℎ𝐼/𝐼𝐼 II/III α17, α17* AII1, CIII1 𝑐𝑜𝑙𝑙𝑖𝑛𝑒𝑎𝑟𝐼𝐼/𝐼𝐼𝐼35° α7, α7* AI1, CII3 𝑔𝑙𝑖𝑠𝑠𝑖𝑙𝑒𝐼/𝐼𝐼𝐼 α18, α18* AII1, AIII2 𝐻𝑖𝑟𝑡ℎ 𝐼𝐼/𝐼𝐼𝐼 {012} III/III
α8 CIII1, DIII1 𝑐𝑜𝑙𝑙𝑖𝑛𝑒𝑎𝑟𝐼𝐼𝐼/𝐼𝐼𝐼70° α19, α19* AII1, AIII3 𝑠𝑒𝑠𝑠𝑖𝑙𝑒
𝐼𝐼/𝐼𝐼𝐼 {113}
α9 CIII1, AIII2 𝐻𝑖𝑟𝑡ℎ𝐼𝐼𝐼/𝐼𝐼𝐼 α20, α20* AII1, CIII3 𝑔𝑙𝑖𝑠𝑠𝑖𝑙𝑒𝐼𝐼/𝐼𝐼𝐼𝐼𝐼𝐼
α10, α10* CIII1, AIII3 𝑔𝑙𝑖𝑠𝑠𝑖𝑙𝑒𝐼𝐼𝐼/𝐼𝐼𝐼𝐼𝐼𝐼
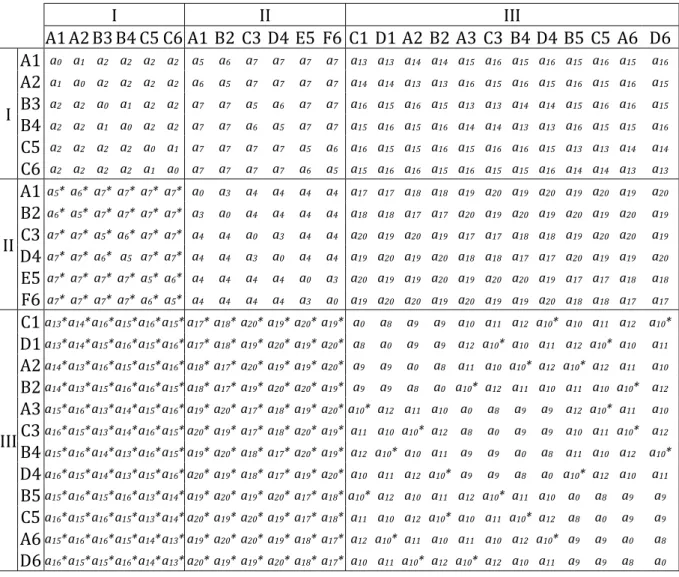
Due to the particularly high number of slip systems in UO2, 576 slip systems
interactions can be defined. With the help of crystallographic symmetries, this amount is reduced to 33 as shown by the strengthening matrix (see Table S1 in the supplementary).
The notation 𝛼𝑖 = √𝑎𝑖 is used here to write down strengthening matrix coefficients αsu.
Each αi refers to a unique strengthening coefficient and, thus, to a particular
dislocation-dislocation interaction. Stared coefficients 𝛼𝑖∗ are defined for asymmetric reactions i.e.,
when two different strengthening coefficients are derived when switching primary and forest slip systems in the simulation (see [32] for more details).
In the following, all possible interactions between slip systems in UO2 are investigated
i.e., within {100} and {110} slip modes (referred as I/I, II/II and I/II), these interactions
are the most probable to appear in UO2 single crystal experiments. But also, among {111}
slip systems (called III/III) that are similar to FCC metal dislocation interactions as well as crossed interactions between {111} and the two dominant slip modes (later referred as I/III and II/III). Table 2 summarizes slip system interactions and induced reaction products (labelled as Interaction ID) referred as 𝑋𝑎/𝑏𝑐 , where X refers to the reaction name, a and b to the involved modes, and c to a specific information about the reaction (e.g., the glide plane of a junction or the angle between the slip planes in the case of collinear
8
reactions). Please note that in the case of multiple reaction products (e.g., junctions in addition to crossed states and repulsions), the interaction name will only refer to the strongest reaction.
Modes I and II are characterized by few contact reactions only. α2 refers to the 𝑔𝑙𝑖𝑠𝑠𝑖𝑙𝑒𝐼/𝐼𝐼𝐼 junction, which is induced by I/I interactions but gliding in mode II slip
systems. On the other hand, α3 and α4 deduced from II/II interactions lead to two sessile
junctions, the 𝐻𝑖𝑟𝑡ℎ𝐼𝐼/𝐼𝐼 and the 𝑠𝑒𝑠𝑠𝑖𝑙𝑒𝐼𝐼/𝐼𝐼{112}, the latter being supposed to glide in {112}
which is not a slip plane of the fluorite structure. The self-interaction is labelled α0’ due to
the coupling between dipolar and collinear interactions (see Devincre et al. [39]) and α1
relies on the dipolar interaction 𝑑𝑖𝑝𝑜𝑙𝑒𝐼/𝐼 within mode I slip systems. I/II crossed configurations lead to asymmetrical coefficients labelled α5, α6 and α7. All I/I, II/II and I/II contact reactions were originally described for MgO by Carrez et al. [40] and Amodeo et al. [36], where reaction maps were computed using the isotropic assumption. In addition, αi with 13≤i≤16 and 17≤i≤20 respectively rely on I/III and II/III crossed interactions. These last coefficients are also asymmetrical. Several examples of I/III and II/III reaction maps are described in the following. III/III interactions (here referenced by αi with 8<i<12) were widely investigated in the case of FCC metals (see e.g., Madec et al. [41]). In the next section, forest coefficients for UO2 are discussed for all αi configurations presented in Table 2
Simulation methods
Dislocation interaction mapping
DD simulations are performed using the MobiDiC code [32,42]. As the basics of lattice-based DD codes are already widely detailed in the literature (see for example [24]) here we only focus on the specific aspects of the following simulations.
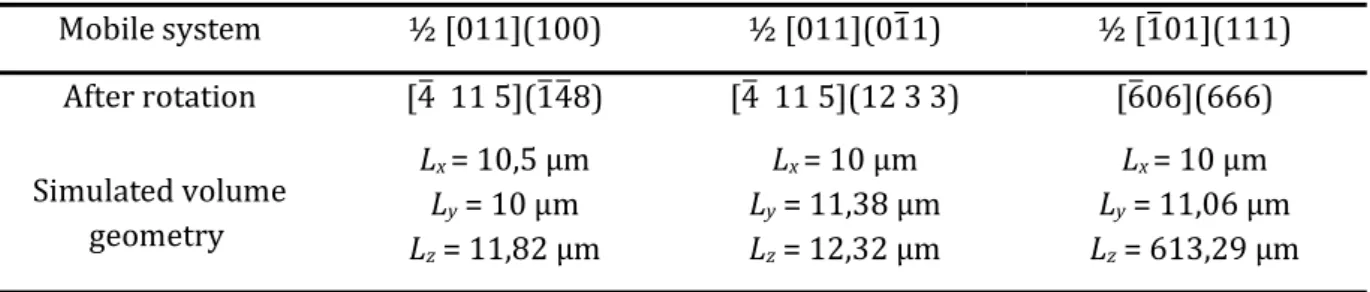
To study dislocation contact reactions, two initially straight dislocations of same length (2 μm) that intersect at their mid-point, are relaxed elastically using DD simulations. As
shown Figure 1, parent dislocations are characterized by the two angles β1 and β2 while βj
is the angle between the recombination direction and the associated dislocation Burgers vectors. As product results depend on the relative orientation of parent dislocations (later
9
referred as ϕ1 and ϕ2), several types of reaction are observed: (i) the repulsion of the two dislocations, (ii) a crossed state, when attractive dislocations just stay in contact without merging, (iii) a recombination of the two parent dislocations forming a junction (or a collinear reaction leading to annihilation), when it induces a global line energy gain. The characteristics of a junction depend of the parent dislocations. The Burgers vector of the junction is defined by 𝑏⃗⃗⃗ = 𝑏𝑗 ⃗⃗⃗ + 𝑏1 ⃗⃗⃗⃗ where indices 1 and 2 rely on the two parent 2
dislocations, its line vector is 𝑙⃗⃗ = 𝑛𝑗 ⃗⃗⃗⃗ × 𝑛1 ⃗⃗⃗⃗ and thus, the slip plane 𝑛2 ⃗⃗⃗ of the junction is 𝑗 derived using the two aforementioned quantities 𝑛⃗⃗⃗ = 𝑏𝑗 ⃗⃗⃗ × 𝑙𝑗 ⃗⃗ . A junction is asymmetrical 𝑗
when β1 ≠ β2 or when Poisson’s ratios between slip systems strongly differ as discussed
later.
Figure 1: (a) Dislocation configuration for reaction maps computation, (b) Schematic representation of the simulation setup for dislocation interaction coefficient (only some of the dislocations are sketched).
In this study, dislocation reaction maps are computed using both the analytical approach based on the straight dislocation approximation proposed by Püschl [43] and DD simulations where the segments discretization allows lines curvature. In addition, boundaries between crossed and repulsive states are also provided using the isotropic elasticity theory in the framework of infinite dislocations [44]. In the results section, anisotropic and Bacon-Scattergood (BS) approximations of straight dislocations are drawn together.
10
Dislocation reaction maps weakly depend on temperature (that is accounted only in the elastic constants). Indeed, these are minimization simulations without external loading. They are thus designed for the description of dislocation interactions in athermal (for
T>Ta) and quasi-static conditions, where the influence of the dislocation velocity on the
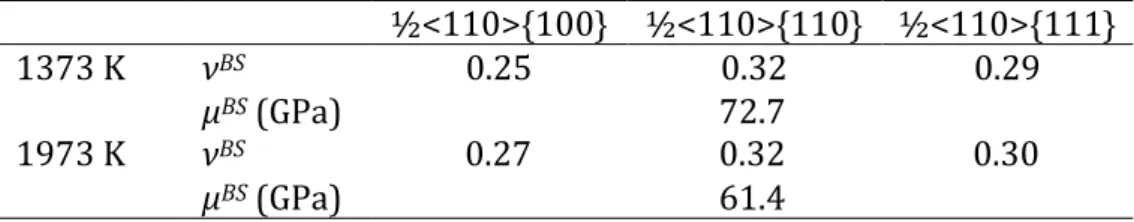
plastic response is believed to be negligible. Line energies used for reaction maps simulations are computed using DisDi [45,46] and anisotropic elastic constants at T=1373 K [47]. Indeed, this temperature reflects the most anisotropic conditions in the temperature range of the fuel incidental transient i.e., for T ranging from 1350 K to 2000 K. While dislocation-dislocation interaction coefficient will be computed at larger temperature, T=1373 K allows to better quantify the spread of dislocation-dislocation interactions induced by the chosen elastic theory, without downgrading the main results. Anisotropic energies of screw and edge dislocations are used to obtain BS Poisson’s ratio
νBS and shear modulus μBS for each slip mode [32]. BS elastic constants are provided Table
3. More details on UO2 elastic properties are provided in the section S2 of the
supplementary.
Table 3: BS elastic constants for the three slip modes at 1373 K and 1973 K.
½<110>{100} ½<110>{110} ½<110>{111}
1373 K νBS 0.25 0.32 0.29
μBS (GPa) 72.7
1973 K νBS 0.27 0.32 0.30
μBS (GPa) 61.4
DD simulation of interaction coefficients
Dislocation-dislocation interaction coefficients are computed using the standard method described e.g., in refs. [28,32]. Here, an orthorhombic simulation cell of
approximatively 1000 μm3 is considered and simulations are performed using periodic
boundary conditions [27]. Forest dislocations of 5 μm length are randomly distributed in the cell within a given system u. All dislocation characters are equivalently represented
and the forest dislocation density ρu is of about 1012 m-2 (the procedure to deduce the
coefficient value at a different dislocation density is provided in [32]). The dislocation density of the mobile system s is of 1011 m-2 with dislocations of 16.5 µm length.
11
strengthening coefficients. More details about simulation configurations are provided in Table S3 in the supplementary materials.
A shear stress τs is applied on the mobile system leading to a total deformation of 0.1%
strain with a constant strain rate of 4.5 s-1, low enough to obtain a quasi-static response
using a viscous dislocation mobility law 𝑣(𝜏) = 𝜏. 𝑏/𝐵 (where B is a damping coefficient). Indeed, the dislocation mobility is large enough and nearly isotropic so that the damping constant has no influence on simulations results in the athermal regime. As a consequence, B, that is unknown for UO2, is set to 1.5 10-5 Pa.s-1, a sufficiently low value
that ensures Forest dislocation interactions to be the rate-limiting process (see section 3.1 of the supplementary information for additional details).
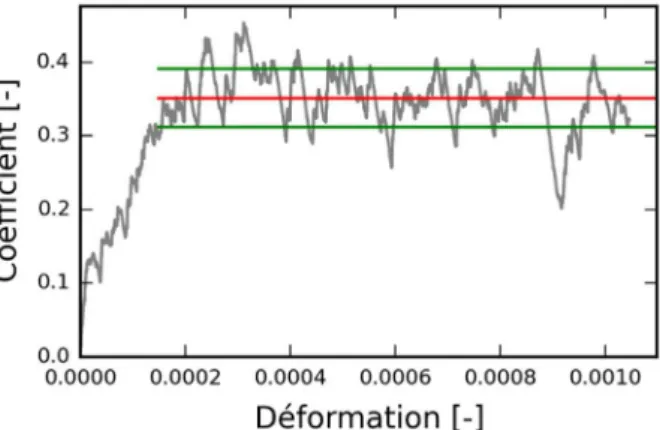
During the simulation, the stress quickly reaches a plateau and fluctuations due to dislocation avalanches and successive junction zipping/unzipping events are observed (see Figure S3 in the supplementary for a typical stress-strain curve). The initial value of
the forest density 𝜌𝑢=1012 m-2 and the stress mean value are used to compute
strengthening coefficients using equation (1) 𝛼𝑠𝑢 = √𝑎𝑠𝑢 = 〈𝜏𝑠〉 (𝜇𝑏√𝜌⁄ 𝑢), its standard
deviation is also provided in the following. Note that dipolar interaction coefficients are not determined using DD model simulations due to the size of the simulation cell, considered too small to provide statistical outputs for such weak interactions.
Results
4.1 Dislocation interactions and reaction maps
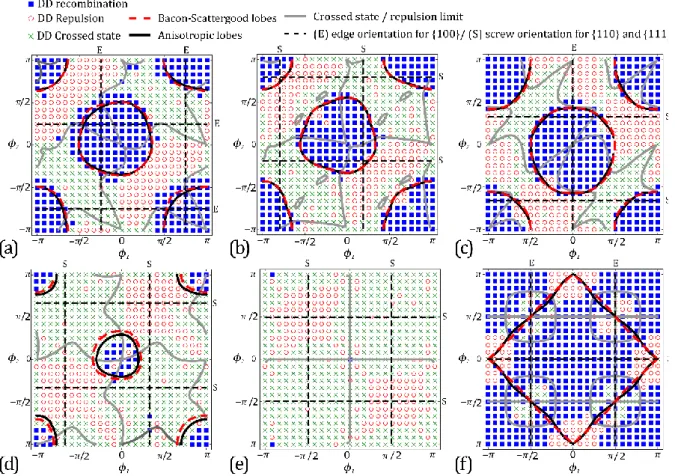
Several examples of dislocation reaction maps for UO2 are provided Figure 2. The DD
products (junction or annihilation, crossed state and repulsion) depicted by symbols are superimposed to analytical domains computed using the BS and anisotropic approximations (reaction lobes) and the isotropic approximation (borders between attraction and repulsion).
Figure 2a, b and c show respectively the reaction maps for the 𝑔𝑙𝑖𝑠𝑠𝑖𝑙𝑒𝐼/𝐼𝐼𝐼 , 𝑠𝑒𝑠𝑠𝑖𝑙𝑒 𝐼𝐼/𝐼𝐼 {112}
and 𝑔𝑙𝑖𝑠𝑠𝑖𝑙𝑒𝐼/𝐼𝐼𝐼𝑎𝐼𝐼𝐼 junctions in UO2. All these junctions have ½<110> Burgers vector but do
not lie in the same type of slip plane (see section 2.2). The mean probability to form
12
in the supplementary information for the detailed probability of each junction). Here, analytical lobes for the 𝑠𝑒𝑠𝑠𝑖𝑙𝑒𝐼𝐼/𝐼𝐼{112} and 𝑔𝑙𝑖𝑠𝑠𝑖𝑙𝑒𝐼/𝐼𝐼𝐼 are approximately of the same size but
DD results show more recombination events for the 𝑔𝑙𝑖𝑠𝑠𝑖𝑙𝑒𝐼/𝐼𝐼𝐼 (42%) than for the
𝑠𝑒𝑠𝑠𝑖𝑙𝑒𝐼𝐼/𝐼𝐼{112} (35%) reaction. Finally, Figure 2c shows the largest recombination domain
(44%).
Figure 2: Examples of dislocation reaction maps in UO2. (a) 𝑔𝑙𝑖𝑠𝑠𝑖𝑙𝑒𝐼/𝐼𝐼𝐼 (α2) between AI1 and BI3
leading to EII5 junctions, (b) 𝑠𝑒𝑠𝑠𝑖𝑙𝑒𝐼𝐼/𝐼𝐼{112} (α4) between AII1 with CII3 forming ½[11̅0](1̅1̅2) junctions – Bacon-Scattergood and anisotropic lobes are superimposed, (c) 𝑔𝑙𝑖𝑠𝑠𝑖𝑙𝑒𝐼/𝐼𝐼𝐼𝑎𝐼𝐼𝐼 (α15) between AI1 and
AIII3 leading to BIII5 junctions and, (d) HirthIII/III (α9) between CIII1 and AIII2 leading to [001](101) junctions, (e) HirthII/II (α3) between AII1 and BII2 leading to ½[010](100) junctions, (f) 𝑐𝑜𝑙𝑖𝑛𝑒𝑎𝑟𝐼/𝐼𝐼90° (α5)
between AI1 and AII1.
The reaction map of the HirthIII/III junction (Figure 2d) is obtained from the reaction
between two ½<110>{111} parent dislocations with orthogonal Burgers vectors. The junction is sessile with <100> Burgers vector, identical to the FCC Hirth junction which is known to be the weaker among FCC structures. For this junction, the length of the
13
junction’s Burgers vector does not contribute to reduce the energy. Indeed, the line energy gain arises from the effect of line orientation. As a consequence, the Hirth junction is the most sensitive to the elastic anisotropy [32]. As for the FCC Hirth reaction map, UO2
HirthIII/III exhibits a junction lobe that covers about 8% of the tested configurations while
92% lead to crossed and repulsive states.
The HirthII/II reaction map (Figure 2e) shares some crystallographic characteristics with the HirthIII/III (i.e. <100> Burgers vector and orthogonal parent Burgers vectors) but exhibits very different DD results. Indeed, Figure 2e shows only three recombination events (very small junctions) and no analytical recombination domain, whatever the
elastic approximations. Moreover, the HirthII/II exhibits one of the lowest recombination
rate among all Hirth junctions in UO2 (~0.5%). Nevertheless, even with a higher
recombination rate, other Hirth maps (except the HirthIII/III) lead mainly to crossed state
formations (see Figure S5 in the supplementary) leading to a mean recombination rate of 4% for the Hirth junctions. This lack of recombination for Hirth maps was previously reported for interaction implying modes I and II using isotropic DD simulation in MgO [36,40].
Finally, Figure 2f shows the reaction map of the 𝑐𝑜𝑙𝑙𝑖𝑛𝑒𝑎𝑟𝐼/𝐼𝐼90° interaction between A I1,
AII1 slip systems. Here, the recombination rate is about 74% which is much larger when
compared to other reactions. The averaged recombination rate of collinear reactions in UO2 is of 78%.
Discrepancies between the different elastic approaches used are quite small in UO2,
especially between BS and full anisotropic calculations and even in cases where the BS approximation is supposed to be less appropriate (Hirth junctions, Figured and e). This is due to the low variation of the Poisson’s coefficient (~0.33 with variations of about 10%) whatever the slip system. As generally observed recombination domains depicted by the analytical solution are in good agreement with DD simulations despite few exceptions like the lobe extension on Figure 2b with short junctions obtained using DD simulations in the direct vicinity of the analytical lobe. For collinear reactions, DD results show that annihilations take place in the entire attractive domain as well as in most of the repulsive
14
domain (due to the bending of originally repulsive lines that become attractive [48]). Similar flexibility effects are observed especially in junction formation domains.
Based on the previous analysis one can expect that the assumption of elastic isotropy is
appropriate for DD computation with UO2 for which the Zener coefficient varies from 0.6
to 0.9 between 1000 K and 2000 K.
4.2 Strengthening coefficient model simulations and induced percolation effects
Table 4: UO2 strengthening coefficient values at 1973K for each kind of slip systems combination.
I/I II/II I/II
α2 α3 α4 α5 α5* α6 α6* α7 α7* 0.340.03 0.150.02 0.250.03 0.810.05 0.860.06 0.090.02 0.150.02 0.430.06 0.400.05 III/III α8 α9 α10 α10* α12 0.790.05 0.160.01 0.300.04 0.320.03 0.390.05 I/III α13 α13* α14 α14* α15 α15* α16 α16* 0.770.05 0.750.05 0.100.02 0.120.01 0.410.04 0.370.06 0.340.04 0.260.03 II/III α17 α17* α18 α18* α19 α19* α20 α20* 0.640.04 0.620.05 0.150.02 0.140.01 0.310.04 0.310.04 0.330.05 0.270.04
All the strengthening coefficients for UO2 determined by DD simulations are
provided on Table 4. Those coefficients also apply in first approximation to other materials with fluorite (e.g., CaF2, BaF2, ThO2) or rock-salt structures (e.g., NaCl, MgO or
KCl) in the absence of a large anisotropy gap. The mean value for coefficient related to glissile junctions is 0.35, 0.29 for sessile ones, 0.13 for Hirth ones and 0.75 for collinear reactions. Coefficient values are in good agreement with the usual hierarchy [29,32] driven by the energy gain during Burgers vector merging and diminution. During the simulations, Frank-Read (F-R) sources show preferred extension directions depending of the investigated interaction.
16
Figure 3: Percolation in the extended slip plane of the mobile slip system during DD model simulation – (a) extended plane ( 360 x 315 µm²) for coefficient α2 with 𝑔𝑙𝑖𝑠𝑠𝑖𝑙𝑒𝐼/𝐼𝐼𝐼 junction and zoom on a dislocation source - (b) zoom for α3 with very few and short HirthII/II junctions - (c) zoom of α4 with
𝑠𝑒𝑠𝑠𝑖𝑙𝑒𝐼𝐼/𝐼𝐼{112} junctions - (d) zoom of α5 with 𝑐𝑜𝑙𝑙𝑖𝑛𝑒𝑎𝑟𝐼/𝐼𝐼90° reactions – (e) zoom of the α9 with original
HirthIII/III junctions– (f) zoom of α7 with 𝑔𝑙𝑖𝑠𝑠𝑖𝑙𝑒𝐼/𝐼𝐼𝐼 junctions – (g) zoom of α7* with 𝑔𝑙𝑖𝑠𝑠𝑖𝑙𝑒𝐼𝐼/𝐼𝐼
junctions.
Figure 3 shows the percolation of F-R loops thought forest dislocations depending on dislocation reactions during strengthening coefficient model simulations. On the figure, the slip plane of the mobile system is extended through periodic boundary in order to follow dislocation glide on slip distances exceeding widely the box size. Due to the lower energy of the screw dislocation, a free obstacle F-R source is known to be slightly elongated along the screw direction. As shown Figure 3, in the presence of a forest with dislocations from one slip system, the F-R source preferentially progresses along the junction direction leading to very anisotropic shape (see e.g., Figure 3f for the more anisotropic effect). This result shows that dislocation recombinations act as a driving force to the anisotropic extension of F-R sources. This effect is less obvious in the cases of the HirthII/II junctions (Figure 3b) that are too week to drive a very anisotropic
percolations, as shown for stronger obstacles. While few short and weak HirthII/II
junctions are observed, many more crossed-states easily arise along the junction direction (see Figure 2e). This, together with the screw direction which is energetically highly favorable, leads to a more isotropic percolation.
Interaction in 1/2<110>{100} and 1/2<110>{110} slip systems
Three coefficients are derived from symmetries between mode I slip systems: the self-interaction α0’, the dipolar interaction α1 and the 𝑔𝑙𝑖𝑠𝑠𝑖𝑙𝑒𝐼/𝐼𝐼𝐼 α2. In the case of the 𝑔𝑙𝑖𝑠𝑠𝑖𝑙𝑒𝐼/𝐼𝐼𝐼
model simulation, Figure 3a shows an extension of the F-R source along the [100] direction due to the high probability to make junction (see Figure 2b). Therefore, the associated flow stress during the model simulation is quite high and leads to a coefficient α2=0.34.
17
Three coefficients are also obtained from {110} slip system symmetries including the self-hardening interaction α0’, and the two sessile junctions i.e., the HirthII/II and a ½[110]
stronger 𝑠𝑒𝑠𝑠𝑖𝑙𝑒𝐼𝐼/𝐼𝐼{112} junction. Only the last two junction coefficients are measured leading
to α3=0.15 and α4=0.25 respectively. These values are quite low for junctions, but agrees
with previous calculation of Hirth coefficients in the FCC structure [29,32]. Figure 3b shows almost no junctions leading to a F-R loop less elongated along the junction direction than in the case of strong reactions. This result agrees with the interpretation of the dislocation reaction maps (Figure 2e) that shows almost no junction reaction. For the strongest 𝑠𝑒𝑠𝑠𝑖𝑙𝑒𝐼𝐼/𝐼𝐼{112}, a closer analysis revels that the energy gain due to the reaction is
the lowest among all UO2 ½[110] junctions. In addition, the angle between parent
dislocations slip planes (β12(α4)=60°) is lower than for the 𝑔𝑙𝑖𝑠𝑠𝑖𝑙𝑒𝐼/𝐼𝐼𝐼 (β12(α2)=90°) leading to less forest crossing events (so a lower number of junctions). However, the percolation shapes observed on Figure 3a and c are quite similar showing both coefficients to be associated with a quite strong junctions with a high enough recombination rate (see Figure 2a and b).
Crossed interaction between modes I and II involves three asymmetrical reactions that lead to six coefficients. The 𝑐𝑜𝑙𝑙𝑖𝑛𝑒𝑎𝑟𝐼/𝐼𝐼90°interactionis the strongest reaction between
slip systems in UO2 and the first case of asymmetrical collinear interaction reported up to
now. In this case, the variation of the Poisson’s ratios between mobile and forest systems (or, in a more general point of view, the anisotropic energies between the involved slip systems) is the only possible cause for asymmetry. Here, it leads to a significant
asymmetry even with a modest variation of Poisson’s ratio: α5*=0.86 with mode II mobile
slip system (𝜈𝐼𝐼𝐵𝑆=0.32) while α5=0.81 with mode I mobile slip system and 𝜈
𝐼𝐵𝑆=0.27. The
high value of the collinear coefficient originates from the wide line energy minimization
that happens during the reaction (and the related recombination rate, see Figue 2f). α5
and α5* exhibit the largest value among all dislocation reactions and even among all collinear interactions [28]. Indeed, the orthogonal slip planes rises the probability for dislocation crossing what increases the annihilation coefficient [32]. Percolation on Figure 3d shows that the mobile dislocations annihilate most of the time they cross a forest dislocation cutting them up in small dislocation debris. Finally, the remaining mobile dislocations segments are so small that the related critical stress to initiate the
18
movement becomes very high when compared to the critical stress of the strongest junction.
A second reaction between I/II is the HirthI/II that is weaker than the HithII/II including almost no junction formation. So, in the absence of junctions, this coefficient is mainly due to the crossed states formed and will be referred as a crossed state coefficient in the following. A clear asymmetry effect is nevertheless observed with a widely stronger coefficient when mobile system is associated with both the highest Poisson's ratio and a
slip planes intersection closer to the screw orientation for mobile dislocations (𝜈𝐼𝐵𝑆=0.27
and β1=90°: α6=0.09 - 𝜈𝐼𝐼𝐵𝑆=0.32 and β1=0°: α6*=0.14).
It has been reported that coefficients are stronger when the character of the mobile dislocations is closer to the screw orientation. This effect is related to highly anisotropic percolation, especially in the case of large Poisson’s ratio when the line tension makes screw dislocation bending harder [32]. Here, the effect is supposed to be strong as the slip system permutation implies a switch between edge and screw characters. In case of weak reaction, the percolation is not only along the slip plane intersection but also along the screw orientation (when it doesn’t match the first direction) leading to a more isotropic and bidirectional geometry. Still, the bidirectional percolation influences the mean line tension, especially along the edge direction, leading to the α6/α6* asymmetry. But the
asymmetry is expected to be less pronounced and here it is very strong (see Figure S6.2). The reason why is that very few junctions are formed with a mode I primary system during the model simulation while with a mode II system the number of junctions is nearly the greatest (ten times more, see also Figure S5).
Finally, the last coefficient among I/II interactions is the 𝑔𝑙𝑖𝑠𝑠𝑖𝑙𝑒𝐼/𝐼𝐼𝐼 associated with the
coefficients α7=0.43 and α7*=0.40 both exhibiting a very anisotropic percolation (see Figure 3f and g). The 𝑔𝑙𝑖𝑠𝑠𝑖𝑙𝑒𝐼/𝐼𝐼𝐼 is the strongest junction in UO2 with the largest junction
coefficient α7, due to the highest probability to form junctions among all UO2 junctions
(see table S4.1 in supplementary). α7* is smaller with the mobile slip system from mode I
involving the edge character (β1(α7*)=90°). However, this effect is supposed to be narrow
as the Poisson’s ratio is also smaller for mode I. Interaction with ½<110>{111} slip systems
19
The coefficients obtained for mode III reactions are in the same range than the values published for FCC metals [29,32]. Those coefficients are usually referenced as self=0, copla=11, ortho=9, coli=8, 2=G0°=10* (G60°=10) and 3=12 in case of FCC metals. The
Table 5 provides the comparison of UO2 coefficients with the more recent FCC coefficients
with the closest Poisson’s ratio i.e. Germanium (Ge) and Aluminum (Al) [32]. The mean values for UO2 are not systematically between the values of Ge and Al, but a good
accordance is obtained.
Table 5: UO2 coefficient values for interaction between systems of {111} slip mode compared to Germanium and Aluminum with FCC structure.
Ge UO2 Al ν 0.25 0.30 0.36 𝑐𝑜𝑙𝑙𝑖𝑛𝑒𝑎𝑟𝐼𝐼𝐼/𝐼𝐼𝐼70° (α8) 0.77 +0.04 0.79 +0.05 0.81 +0.04 𝐻𝑖𝑟𝑡ℎ𝐼𝐼𝐼/𝐼𝐼𝐼 (α9) 0.18 +0.01 0.16 +0.01 0.20 +0.01 𝑔𝑙𝑖𝑠𝑠𝑖𝑙𝑒𝐼𝐼𝐼/𝐼𝐼𝐼𝐼𝐼𝐼 (α10) 0.30 +0.015 0.30 +0.04 0.30 +0.015 𝑔𝑙𝑖𝑠𝑠𝑖𝑙𝑒𝐼𝐼𝐼/𝐼𝐼𝐼𝐼𝐼𝐼 (α10*) 0.31 +0.015 0.32 +0.03 0.32 +0.015 𝑔𝑙𝑖𝑠𝑠𝑖𝑙𝑒𝐼𝐼𝐼/𝐼𝐼𝐼𝐼,𝐿 (α12), Lomer 0.39 +0.02 0.39 +0.05 0.38 +0.02
As expected, the 𝑐𝑜𝑙𝑙𝑖𝑛𝑒𝑎𝑟𝐼𝐼𝐼/𝐼𝐼𝐼70° interaction coefficient is the larger among mode III,
followed respectively by Lomer, glissile and Hirth. One can notice that α9 is the strongest
Hirth coefficient within the fluorite structure. This is due to the ability of the system to effectively make Hirth junctions (i.e., presence of a well-defined junction lobe on the reaction map Figure 2d).
Coefficients between mode III and mode I or II are of special interest as they might play a significant role on the single crystal response of UO2 [8,12,13,16,17]. Crossed
interaction between modes I and III involves four reactions and eight coefficients because of the asymmetry. The α13=0.77 and α13*=0.75 coefficients are related to the 𝑐𝑜𝑙𝑙𝑖𝑛𝑒𝑎𝑟𝐼/𝐼𝐼𝐼55°
reaction. The asymmetry is not significant here. The α14=0.10 and α14*=0.12 related to
HirthI/III exhibits a very low coefficient value. Again, here the asymmetry is due to line
orientation effect and Poisson’s ratios (respectively β1(α14)=90° 𝜈𝐼𝐵𝑆=0.27 and β1(α14*)=0° 𝜈𝐼𝐼𝐼𝐵𝑆=0.30). Finally, for interactions between mode I and III, there are two strong glissile coefficients the 𝑔𝑙𝑖𝑠𝑠𝑖𝑙𝑒𝐼/𝐼𝐼𝐼𝑎𝐼𝐼𝐼 and 𝑔𝑙𝑖𝑠𝑠𝑖𝑙𝑒
𝐼/𝐼𝐼𝐼𝑏𝐼𝐼𝐼 both leading to a glissile junction in the
20
coefficient when the character of the mobile dislocations is close to the edge character. For 𝑔𝑙𝑖𝑠𝑠𝑖𝑙𝑒𝐼/𝐼𝐼𝐼𝑏𝐼𝐼𝐼 coefficient, β1(α16)=0° for the mobile system leads to α16=0.34 while β1(α16*)=60° leads to smaller coefficient value α16*=0.26. For 𝑔𝑙𝑖𝑠𝑠𝑖𝑙𝑒𝐼/𝐼𝐼𝐼𝑎𝐼𝐼𝐼 α15=0.41 exhibits a larger value than α15*=0.37 while β1(α15)=90° > β1(α15*)=60°. Finally, coefficient α15* seems to not follow the usual coefficient hierarchy ruled by the line energy gain, probably due to its large standard deviation (the largest among all junctions).
The interactions between mode II and III are similar to the latter case with one coefficient of each type (collinear, Hirth, glissile and sessile) that are all asymmetrical. The 𝑐𝑜𝑙𝑙𝑖𝑛𝑒𝑎𝑟𝐼𝐼/𝐼𝐼𝐼35° is the weakest among all collinear coefficients in UO2 (α17=0.64). It has the highest recombination probability (81%, based on its reaction map that assumes the dislocation lines to cross each other) what it is likely due to the angle between the parent slip planes which is the lowest among all collinear configurations (β12(α17)=35°). This geometry promotes strong dislocation interactions able to bend dislocation lines and
force reactions. However, this is not the most important effect of this angle. Indeed, β12
also drives the crossing probability of dislocation lines: decreasing β12 lower the crossing
probability and the combination of both effects leads to a lower coefficient value. The 𝐻𝑖𝑟𝑡ℎ𝐼𝐼/𝐼𝐼𝐼{012} has a stronger coefficient for α18=0.15 than for α18*=0.14 but the variation is
not significant due to a low variation of dislocation character and νBS (from β1(α18)=55°
𝜈𝐼𝐼𝐵𝑆=0.32 to β1(α18*)=90° 𝜈𝐼𝐼𝐼𝐵𝑆=0.30). The 𝑠𝑒𝑠𝑠𝑖𝑙𝑒𝐼𝐼/𝐼𝐼𝐼{113} does not exhibit asymmetry with
α19=α19*=0.31 due to both the almost neutral character of the parent dislocation for both
slip systems β1(α19)=55° and β1(α19*)=30° and the close Poisson’s ratio (𝜈𝐼𝐼𝐼𝐵𝑆=0.30 and 𝜈𝐼𝐼𝐵𝑆 =0.32). Finally, the asymmetry for the 𝑔𝑙𝑖𝑠𝑠𝑖𝑙𝑒𝐼𝐼/𝐼𝐼𝐼𝐼𝐼𝐼 is mainly due to the screw character of the junction for α20=0.33 while it is close to edge (β1(α20*)=60°) for α20*=0.27.
21
Figure 4: (a) Interaction coefficients versus reaction maps recombination rate. Hirth junctions are in blue, glissile and sessile junctions are in green and collinear reactions are in red. For all reaction groups, darker colors refer to larger β12 angles. The dashed line is a guide for the eyes. (b) Hirth coefficients versus Poisson’s ratio.
As inferred from the results section, the amplitude of a given interaction coefficient depends on (i) the energetical aspect of the contact reactions as described by the reaction maps (i.e., dislocation line, Burgers vector and parent slip planes), (ii) the topology of the dislocation process (percolations) and (iii) the probability for dislocations to intersect
which is driven by the angle between slip planes (β12).
Figure 4a exhibits a continuous increase of the interaction coefficient that scales with reaction maps recombination rate leading to three delimited domains relative to Hirth junctions, glissile/sessile junctions and collinear reactions. Interactions coefficients of a given group of contact reactions are colored according to β12 (the larger β12 the darker the marker) in order to quantify correlations. While the collinear coefficients continuously
increase when increasing β12 confirming previous observations made in BCC metals [32],
Hirth and sessile/glissile coefficients do not scale with β12. This property is due to the high similarity (in terms of in plane geometry) of collinear reactions that overstates the role of
22
configurational parameters. As an example, the Hirth coefficients rather scale with the Poisson’s ratio as shown by Figure 4b.
Overall, these results confirm the main role of the recombination rate over other configurational parameters such as β12, β1, and, at a lesser extent, νBS, that do not lead to comparable correlations (see section S6 in the supplementary for more details).
Based on the analysis of dislocation interaction coefficients, one can derive a
qualitative description of strain-hardening in UO2 single crystal. Indeed, data from Table
4 show that strain hardening within individual modes I and II should be moderately high, as characterized by dislocation reaction coefficients of intermediate amplitude
(respectively, α2=0.34 and α3=0.15, α4=0.25). On the other hand, an enhanced
strengthening effect should be noticed in case of simultaneous activation of modes I and II as shown by larger interaction coefficients values (e.g., collinear reactions with coefficients of about α5=0.81).
This hypothesis was first discussed in Amodeo et al. [36], in the case of MgO, that also exhibits ½<110>{110} and ½<110>{100} slip systems as main slip modes. In Amodeo et al. [36], the authors used isotropic DD simulations to investigate MgO single crystal deformation with compression axis (CA) along <100> and <110>. Only single mode simulations were carried. In the case of CA aligned with <100>, the authors considered dislocations in ½<110>{110} slip systems only, including four over six activated slip systems (the same dislocation density was set on each slip system). On the other hand, additional simulations accounting for ½<110>{100} dislocations with four over six slip systems activated with CA aligned with <110> were performed. The authors derived averaged interaction coefficients α̅Ι/I=0.28 and α̅ΙI/II=0.24 (using the same convention for
mode I and II than here for UO2)from stress-strain and dislocation density evolutions.
These averaged coefficients rely on all possible interactions occurring in each mode.
For UO2, similar averaged coefficients for mode I and II can be defined using the same
relative orientations that in Amodeo et al. [36] and the following equations:
𝛼̅I/I= √(2𝑎2+ 𝑎1+ 𝑎0′)/4 (2)
23
𝛼̅𝐼𝐼/𝐼𝐼 = √(2𝑎4+ 𝑎3+ 𝑎0′)/4 (3)
In this approach, only interactions between activated slip systems are considered as they are usually characterized by a larger obstacle dislocation density (due to dislocation multiplication) than slip systems with zero Schmid factor. Assuming a negligible effect of
elastic coefficients variations between MgO and UO2 (Amodeo et al. used ν=0.33 on both
slip modes), one can easily derive the self-hardening coefficient 𝛼0′ = √𝑎0′=0.29 and the
dipolar coefficient α1 which is null (indeed dipolar interactions are negligible in
comparison to junction effects), using both MgO and UO2 coefficients in equations (2) and
(3). While they remain qualitative, these coefficients are in good agreement with those
expected from the literature. Indeed, α0‘ can directly be compared to the value calculated
in Cu (α0’=0.35) [39] while less than 0.1 is expected for dipolar interactions [34].
One can extend this approach integrating the influence of the crystal orientation as shown Figure 5 using inverse pole figures (IPF). While this approach is partially
qualitative due to the thermal/athermal character of some deformation modes in UO2 (𝑇𝑎𝐼
ranges from 1400 K to 1750 K [10,16], 𝑇𝑎𝐼𝐼>2000 K [16] and no information about 𝑇
𝑎𝐼𝐼𝐼),
we will show that it allows to easily lay the foundation of a strain-hardening model for
UO2 single crystal at high-temperature.
Averaged coefficients α̅ for individual and pairs of modes are calculated using equation
(4). As a criterion for plasticity, slip systems with Schmid factor mk larger than 0.15 are
considered together with those characterized by mk>0.8 𝑚𝑘𝑚𝑎𝑥 (with 𝑚𝑘𝑚𝑎𝑥 the maximum
Schmid factor). 𝛼̅ = √∑ 𝛿𝑠∑ 𝛿𝑢𝑎 𝑠𝑢 𝑁 𝑢 𝑁 𝑠=1 ∑ 𝛿𝑠∑𝑁 𝛿𝑢 𝑢=1 𝑁 𝑠=1 𝛿𝑘= 1 𝑖𝑓 𝑚𝑘 ≥ 0.15 and 𝑚𝑘 ≥ 0.8 𝑚𝑘𝑚𝑎𝑥 𝑒𝑙𝑠𝑒 𝛿𝑘 = 0 (4)
Figure 5 shows that α̅I/I reach intermediate values for most of the orientations what
promotes ½<110>{100} slip system activation in UO2 single crystal except close to [001]
where m{100} is null (Figure 5a). Strengthening is also quite homogenous but slightly softer
24
enhances mode I activation for these orientations whereas mode II slip systems should be favored nearby [001]. As commonly observed in FCC, mode III strengthening is particularly high [32] with α̅ ranging from 0.20 close to [1̅22] up to 0.42 along [1̅11] (Figure 5c).
Crossed interactions between modes I and II (Figure 5d) induce strengthening for orientations in the central domain of the IPF where both modes benefit of activated slip systems verifying equation (4) leading to several collinear interaction configurations. Nonetheless, this domain is particularly narrow and white regions are typical of orientations where slip systems with higher Schmid factors are restricted to a unique slip mode (I or II for white region in the vicinity of [001] and [1̅11] respectively). This additional strengthening induced by modes I and II common activation (Figure 5d) is in good agreements with single crystal experiments of Sawbridge and Sykes [8], for which stress-strain curves show a particularly high strengthening rate for orientation ϕ ranging from 25° to 36° only. The lack of crossed interaction close to [011] (Ω=0°) also confirms the weak contribution of mode II for theses orientations as suggested by Portelette et al. [16].
Interactions I/III (Figure 5e) could also contribute to the strain-hardening observed on
experimental stress-strain curves. They are particularly high (α̅I/III =0.60) in a domain in
between [1̅11] and [011]. Finally, dislocation interactions between mode III and II lead to α̅III/II ranging from 0.38 to 0.45 (Figure 5f).
Assuming the controversial aspect of mode III dislocations in UO2, one could expect a
significantly different mechanical response in case of dislocation multiplication in the three modes when compared to a simpler model that accounts only for modes I and II. Interestingly, III/III interactions strongly strengthen mode III in regions where mode I and II are dominant in terms of slip activity (mode II near [001] with 𝑚{110}𝑚𝑎𝑥 =0.5and mode
I near [1̅11] with 𝑚{100}𝑚𝑎𝑥 =0.47 respectively) but exhibit weak interactions. In addition,
crossed interactions between mode III and II (Figure 5f) with high value of α̅III/II near [001] do not promote activation of mode III in this zone while Figure 5e shows that Schmid factor is too unfavorable for mode III activation near [1̅11]. Therefore, mode III crossed contribution is most likely expected in the central part of the IPF where it spans a larger zone than cross interaction between modes I and II.
25
This is of special interest as Sawbridge and Sykes observed softening or no hardening on stress-strain curves for ϕ<25° and ϕ>36° suggesting a low dislocation multiplication rate in mode III for these orientations.
Consequently, the low strain-hardening observed for ϕ<25° in Sawbridge experiments could be attributed to the moderate values of α̅I/I, α̅II/II and α̅I/II and the lack of dislocations in ½<110>{111}. Moreover, Sawbridge and Sykes also observed hardening in the middle of the mode I/II interaction zone (Figure 5d) but not near [011]. This agrees with α̅I/II values but not with α̅I/III near [011] what suggests again a lack of dislocations in ½<110>{111}, at least near [011].
Figure 5 : IPFs showing the evolution of the averaged dislocation interaction coefficients for (a) I/I, (b) II/II, (c) III/III, (d) I/II, (e) I/III and (f) III/II mode interactions computed using equation (4) for various orientations. For crossed interactions, the lack of strengthening is related to low Schmid factors in mode I slip systems for the left part of (d) and (e), in mode II in the upper and right part of (f) and in mode III for the upper part of (e).
As previously discussed, modes II and III should be characterized by partial and/or high lattice friction what does not fit the forest model used here. However, results
26
presented Figure 5 already provide some hints about UO2 single crystal deformation
under incidental conditions of temperature. First Figure 5a, b and c confirm the crucial role of I/I and I/II dislocation interactions that are configurations mostly athermal. This is particularly true for I/I configurations and should be investigated for I/II as the curvature of dislocations in mode I slip systems could lead to the formation of several junctions, even if crossing dislocation from slip systems characterized by lattice friction (such as mode II in these conditions of temperature). Interactions II/II are mostly weaker, and III/III are only partially required to explain strain-hardening observed in the experiments.
This study addresses a detailed description of dislocation interactions and strengthening reactions in UO2 required to build first physics-based model for strain
hardening in in UO2 single crystal. Nonetheless, dislocation microstructural aspects such
as the dislocation density spread per slip mode or a detailed analysis of mode III contribution still need to be investigated, e.g., using transmission electron microscopy, to clarify their role among UO2 single-crystal mechanical properties within the incidental
conditions.
6 Conclusions
Here are resumed the main conclusions of the study:
• Dislocation Dynamics simulations are used to investigate the strengthening elementary processes, dislocation reaction maps and compute Franciosi’s interaction matrix coefficients for the three deformation modes ½<110>{100} (mode I), ½<110>{110} (mode II) and ½<110>{111} (mode III) of UO2.
• The interaction coefficients scales with the recombination rate and parameters such as the angle between parent slip modes and the Poisson’s ratio have shown to influence particular reactions such as collinear interactions and Hirth’s junctions respectively.
• When only one slip-mode is activated, modes I and II are characterized by intermediate dislocation coefficients, while those of mode III are larger. Largest
27
values are also obtained when two modes are activated together (e.g., modes I and II) especially in the case of strong collinear dislocation interactions with coefficient that can exceed 0.8.
• Averaged strengthening coefficients are presented and their variations with the sample orientation are discussed. Results are in good agreement with Sawbridge and Sykes [8] experiments.
• Such coefficients can be used in macroscopic models to describe the deformation
induced by dislocation glide in UO2 at high-temperature.
Acknowledgements
This research is achieved in the framework of a simulation project devoted to the PLEIADES fuel software environment funding by the French nuclear institute between CEA, EDF and FRAMATOME. The authors acknowledge S. Loridon who developed the full anisotropic lobe calculation procedure.
References
[1] B. Michel, C. Nonon, J. Sercombe, F. Michel, V. Marelle, Simulation of Pellet-Cladding Interaction with the Pleiades Fuel Performance Software Environment, Nucl. Technol. 182 (2013) 124–137. https://doi.org/10.13182/NT13-A16424.
[2] B. Michel, J. Sercombe, G. Thouvenin, A new phenomenological criterion for pellet– cladding interaction rupture, Nucl. Eng. Des. 238 (2008) 1612–1628. https://doi.org/10.1016/j.nucengdes.2008.01.012.
[3] R.L. Williamson, K.A. Gamble, D.M. Perez, S.R. Novascone, G. Pastore, R.J. Gardner, J.D. Hales, W. Liu, A. Mai, Validating the BISON fuel performance code to integral LWR
experiments, Nucl. Eng. Des. 301 (2016) 232–244.
https://doi.org/10.1016/j.nucengdes.2016.02.020.
[4] E.J. Rapperport, A.M. Huntress, Deformation Modes of Single Crystal Uranium Dioxide from 700°C to 1900°C, (1960).
28
[5] J.F. Byron, The yield and flow of single crystals of uranium dioxide, J. Nucl. Mater. 28 (1968) 110–114. https://doi.org/10.1016/0022-3115(68)90062-7.
[6] J.S. Nadeau, Dependence of Flow Stress on Nonstoichiometry in Oxygen-Rich Uranium Dioxide at High Temperatures, J. Am. Ceram. Soc. 52 (1969) 1-. https://doi.org/10.1111/j.1151-2916.1968.tb11863.x-i1.
[7] C.S. Yust, C.J. McHargue, Dislocation substructures in deformed uranium dioxide single crystals, J. Nucl. Mater. 31 (1969) 121–137. https://doi.org/10.1016/0022-3115(69)90187-1.
[8] P.T. Sawbridge, E.C. Sykes, Dislocation Glide in UO2 Single Crystals at 1600°K, Philos. Mag. 24 (1971) 33–53.
[9] M.S. Seltzer, A.H. Clauer, B.A. Wilcox, The influence of stoichiometry on compression creep of uranium dioxide single crystals, J. Nucl. Mater. 44 (1972) 43–56. https://doi.org/10.1016/0022-3115(72)90127-4.
[10] J.M. Lefebvre, Contribution à l’étude de la déformation plastique d’une céramique de strucuture fluorite : le bioxyde d’uranium, Faculté des sciences de poitiers, 1976. [11] A. Alamo, J.M. Lefebvre, J. Soullard, Deformation plastique du bioxyde d’uranium:
Observation des sous-structures de dislocations, J. Nucl. Mater. 75 (1978) 145–153. https://doi.org/10.1016/0022-3115(78)90038-7.
[12] R.J. Keller, T.E. Mitchell, A.H. Heuer, Plastic deformation in nonstoichiometric UO2+x single crystals—I. Deformation at low temperatures, Acta Metall. 36 (1988) 1061– 1071. https://doi.org/10.1016/0001-6160(88)90160-5.
[13] R.J. Keller, T.E. Mitchell, A.H. Heuer, Plastic deformation in nonstoichiometric UO2 + x single crystals—II. Deformation at high temperatures, Acta Metall. 36 (1988) 1073–1083. https://doi.org/10.1016/0001-6160(88)90161-7.
[14] A.V. Lunev, A.Y. Kuksin, S.V. Starikov, Glide mobility of the 1/2[110](001) edge dislocation in UO2 from molecular dynamics simulation, Int. J. Plast. 89 (2017) 85– 95. https://doi.org/10.1016/j.ijplas.2016.11.004.
[15] A. Soulié, J.P. Crocombette, A. Kraych, F. Garrido, G. Sattonnay, E. Clouet, Atomistically-informed thermal glide model for edge dislocations in uranium
29
dioxide, Acta Mater. 150 (2018) 248–261.
https://doi.org/10.1016/j.actamat.2018.03.024.
[16] L. Portelette, J. Amodeo, R. Madec, J. Soulacroix, T. Helfer, B. Michel, Crystal viscoplastic modeling of UO2 single crystal, J. Nucl. Mater. (2018). https://doi.org/10.1016/j.jnucmat.2018.06.035.
[17] P. Fossati, L. Van Brutzel, B. Devincre, Molecular dynamics simulation of dislocations
in uranium dioxide, J. Nucl. Mater. 443 (2013) 359–365.
https://doi.org/10.1016/j.jnucmat.2013.07.059.
[18] R. Skelton, A.M. Walker, Peierls-Nabarro modeling of dislocations in UO2, J. Nucl. Mater. 495 (2017) 202–210. https://doi.org/10.1016/j.jnucmat.2017.08.024. [19] A.V. Lunev, S.V. Starikov, T.N. Aliev, V.I. Tseplyaev, Understanding
thermally-activated glide of 1/2〈110〉{110} screw dislocations in UO2 – A molecular
dynamics analysis, Int. J. Plast. 110 (2018) 294–305.
https://doi.org/10.1016/j.ijplas.2018.07.003.
[20] P. Franciosi, A. Zaoui, Université de Paris-Nord, Etude théorique et expérimentale du comportement élastoplastique des monocristaux métalliques se déformant par glissement modélisation pour un chargement complexe quasi statique, [s.n.], 1984. [21] G.I. Taylor, The Mechanism of Plastic Deformation of Crystals. Part I. Theoretical,
Proc. R. Soc. Lond. Math. Phys. Eng. Sci. 145 (1934) 362–387. https://doi.org/10.1098/rspa.1934.0106.
[22] G. Saada, Sur le durcissement dû à la recombinaison des dislocations, Acta Metall. 8 (1960) 841–847. https://doi.org/10.1016/0001-6160(60)90150-4.
[23] B. Devincre, L.P. Kubin, Simulations of forest interactions and strain hardening in FCC
crystals, Model. Simul Mater Sci Eng. 2 (1994) 559–570.
https://doi.org/10.1088/0965-0393/2/3A/010.
[24] B. Devincre, R. Madec, G. Monnet, S. Queyreau, R. Gatti, L.P. Kubin, Modeling crystal plasticity with dislocation dynamics simulations: the ‘microMegas’ code, Mech. Nano-Objects. (2011) 81–100.
[25] V.V. Bulatov, L.L. Hsiung, M. Tang, A. Arsenlis, M.C. Bartelt, W. Cai, J.N. Florando, M. Hiratani, M. Rhee, G. Hommes, T.G. Pierce, T.D. de la Rubia, Dislocation
multi-30
junctions and strain hardening, Nature. 440 (2006) 1174–1178.
https://doi.org/10.1038/nature04658.
[26] W. Cai, V.V. Bulatob, J. Chang, J. Li, S. Yip, Periodic image effects in dislocation
modelling, Philos. Mag. 83 (2003) 539–567.
https://doi.org/10.1080/0141861021000051109.
[27] R. Madec, B. Devincre, L.P. Kubin, On the use of periodic boundary conditions in dislocation dynamics simulations, Springer, Dordrecht, 2004.
[28] R. Madec, B. Devincre, L.P. Kubin, T. Hoc, D. Rodney, The Role of Collinear Interaction in Dislocation-Induced Hardening, Science. 301 (2003) 1879–1882. https://doi.org/10.1126/science.1085477.
[29] B. Devincre, L.P. Kubin, T. Hoc, Physical analyses of crystal plasticity by DD
simulations, Scr. Mater. 54 (2006) 741–746.
https://doi.org/10.1016/j.scriptamat.2005.10.066.
[30] A. Alankar, I.N. Mastorakos, D.P. Field, H.M. Zbib, Determination of Dislocation Interaction Strengths Using Discrete Dislocation Dynamics of Curved Dislocations, J.
Eng. Mater. Technol. 134 (2012) 021018-021018–4.
https://doi.org/10.1115/1.4005917.
[31] N. Bertin, C.N. Tomé, I.J. Beyerlein, M.R. Barnett, L. Capolungo, On the strength of dislocation interactions and their effect on latent hardening in pure Magnesium, Int. J. Plast. 62 (2014) 72–92. https://doi.org/10.1016/j.ijplas.2014.06.010.
[32] R. Madec, L.P. Kubin, Dislocation strengthening in FCC metals and in BCC metals at
high temperatures, Acta Mater. 126 (2017) 166–173.
https://doi.org/10.1016/j.actamat.2016.12.040.
[33] R. Madec, L.P. Kubin, Dislocation dynamics in BCC metals: interaction strengths in the athermal regime, in: Comput. Model. Simul. Mater. III - Part A, Advances in Science and Technology, Techna Group srl, 2004: pp. 671–678. https://www.researchgate.net/publication/258242352_Dislocation_dynamics_in_ BCC_metals_interaction_strengths_in_the_athermal_regime/stats.
31
[34] S. Queyreau, G. Monnet, B. Devincre, Slip systems interactions in α-iron determined by dislocation dynamics simulations, Int. J. Plast. 25 (2009) 361–377. https://doi.org/10.1016/j.ijplas.2007.12.009.
[35] B. Devincre, Dislocation dynamics simulations of slip systems interactions and forest strengthening in ice single crystal, Philos. Mag. 93 (2013) 235–246. https://doi.org/10.1080/14786435.2012.699689.
[36] J. Amodeo, B. Devincre, Ph. Carrez, P. Cordier, Dislocation reactions, Plastic anisotropy and forest strengthening in MgO at high temperature, Mech. Mater. 71 (2014) 62–73. https://doi.org/10.1016/j.mechmat.2014.01.001.
[37] J. Durinck, B. Devincre, L. Kubin, P. Cordier, Modeling the plastic deformation of olivine by dislocation dynamics simulations, Am. Mineral. 92 (2007) 1346–1357. https://doi.org/10.2138/am.2007.2512.
[38] E. Schmid, W. Boas, Kristallplastizität: Mit Besonderer Berücksichtigung der Metalle,
Springer-Verlag, Berlin Heidelberg, 1935.
https://www.springer.com/gp/book/9783662342619 (accessed October 9, 2019). [39] B. Devincre, L.P. Kubin, T. Hoc, Collinear superjogs and the low-stress response of fcc
crystals, Scr. Mater. 57 (2007) 905–908.
https://doi.org/10.1016/j.scriptamat.2007.07.026.
[40] P. Carrez, P. Cordier, B. Devincre, L.P. Kubin, Dislocation reactions and junctions in MgO, Mater. Sci. Eng. -Struct. Mater. Prop. Microstruct. Process. 400 (2005) 325–328. https://doi.org/10.1016/j.msea.2005.03.071.
[41] R. Madec, B. Devincre, L.P. Kubin, On the nature of attractive dislocation crossed states, Comput. Mater. Sci. 23 (2002) 219–224. https://doi.org/10.1016/S0927-0256(01)00215-4.
[42] R. Madec, L.P. Kubin, Second-order junctions and strain hardening in bcc and fcc
crystals, Scr. Mater. 58 (2008) 767–770.
https://doi.org/10.1016/j.scriptamat.2007.12.032.
[43] W. Puschl, Reactions Between Glide Dislocations and Forest Dislocations in Anisotropic Bcc Metals, Phys. Status Solidi -Appl. Res. 90 (1985) 181–189. https://doi.org/10.1002/pssa.2210900117.
32
[44] R. Madec, B. Devincre, L.P. Kubin, From Dislocation Junctions to Forest Hardening,
Phys. Rev. Lett. 89 (2002) 255508.
https://doi.org/10.1103/PhysRevLett.89.255508.
[45] J. Douin, DisDi, (n.d.). http://joel.douin.free.fr/Disdi-Page.html.
[46] J. Douin, P. Veyssiere, P. Beauchamp, Dislocation line stability in Ni3AI, Philos. Mag. A. 54 (1986) 1375–393.
[47] M.T. Hutchings, High-temperature studies of UO2 and ThO2 using neutron scattering techniques, J. Chem. Soc. Faraday Trans. 2 Mol. Chem. Phys. 83 (1987) 1083–1103. https://doi.org/10.1039/F29878301083.
[48] L.P. Kubin, R. Madec, B. Devincre, Dislocation intersections and reactions in FCC and BCC crystals, in: H.M. Zbib, D.H. Lassila, L.E. Levine, K.J. Hemker (Eds.), Multiscale Phenom. Mater.-Exp. Model. Relat. Mech. Behav., Materials Research Society, Warrendale, 2003: pp. 25–36.
![Table S2.2: BS elastic constants for the three slip modes at 1973 K [S2].](https://thumb-eu.123doks.com/thumbv2/123doknet/13189643.391811/35.892.108.788.546.653/table-s-bs-elastic-constants-slip-modes-k.webp)