HAL Id: hal-00378315
https://hal.archives-ouvertes.fr/hal-00378315
Preprint submitted on 24 Apr 2009
HAL is a multi-disciplinary open access archive for the deposit and dissemination of sci-entific research documents, whether they are pub-lished or not. The documents may come from teaching and research institutions in France or abroad, or from public or private research centers.
L’archive ouverte pluridisciplinaire HAL, est destinée au dépôt et à la diffusion de documents scientifiques de niveau recherche, publiés ou non, émanant des établissements d’enseignement et de recherche français ou étrangers, des laboratoires publics ou privés.
Lahars Deposits Architecture and Volume in the C.
Lengkong Valley at Semeru volcano, Indonesia
Christopher Gomez, Franck Lavigne, Danang Sri Hadmoko
To cite this version:
Christopher Gomez, Franck Lavigne, Danang Sri Hadmoko. Lahars Deposits Architecture and Volume in the C. Lengkong Valley at Semeru volcano, Indonesia. 2008. �hal-00378315�
Lahars Deposits Architecture and Volume
in the C. Lengkong Valley at Semeru volcano, Indonesia
Gomez C., Lavigne F., Hadmoko Sri D.
Gomez C.
Université Paris 7 – Denis Diderot,
Laboratoire de Géographie Physique CNRS UMR 8591, 1 Place Aristide Briand, 92190 Meudon, France
e-mail : christophergomez1101@yahoo.com / christopher.gomez@cnrs-bellevue.fr
Lavigne F.
Université Paris 1 – Sorbonne
Laboratoire de Géographie Physique CNRS UMR 8591, 1 Place Aristide Briand, 92190 Meudon, France
Hadmoko Sri D.
Université Paris 1 – Sorbonne & Univ. Gadjah Mada (Indonesia) Laboratoire de Géographie Physique CNRS UMR 8591, 1 Place Aristide Briand, 92190 Meudon, France
Abstract
Lahars at Semeru volcano, Indonesia, are an ongoing
phenomenon that rapidly transports large amount of clastic
materials, threatening populations and infrastructures on and at
the foot of the volcano. Focusing on lahars’ deposits, this
contribution has three main aims: (1) Understand the terrasses
and valley bottom deposits architecture and their eventual
correspondence with GPR (Ground Penetrating Radar)
electromagnetic signals; (2) Calculate volumes of removable
materials inside the valley; (3) explain the deposits irregular
distribution in the valley.
In order to reach these goals, we worked on a 4.2 km stripe of
the Curah Lengkong valley, 8 km S-SE from the summit in an
area favorable to lahar deposits. We used a geomorphological
approach, completed with an extensive GPR campaign over the
terrasses and deposits at the bottom of the valley. We also
analyzed a series of aerial photographs that we converted into
GIS in order calculate lahars’ terrasses volumes, and in order to
understand their spatial distribution.
Results highlight that the terrasses’ architecture is typically
divided into horizontal units, with “progradation like” lateral
variations, whereas deposits at the bottom of the valley are not
presenting any clear architecture. The calculated volume of
section we studied. This overall volume is divided between
210,200 m3 for the terrasses and 301,000 m3 for the bottom of
the valley. These deposits are unevenly spread through the
valley since they are mostly concentrated in the upstream half of
the valley, with 25% of the material located within the first 500
meters. We could identify to concentration areas that are due to
(1) a natural topographic jump and (2) the presence of a SABO
dam that blocks the sediments. Therefore, this study
emphasizes the role of local topography on deposits, and the
importance of the “invisible” materials located at the bottom of
the valley.
1. Introduction
Mt Semeru is an active volcano and the highest mountain in
Java (3676 m a.s.l.). Its densely populated - 400-900 inhab./km2
- lower flanks and ring plain are subject to lahar-related
disasters. Those areas carry a lahar death toll overshooting a
thousand people for the 20th century alone.
The Semeru eruptive activity is characterized by continuous
vulcanian-strombolian eruptions. From 1967 the volcano is
producing short-lived eruption columns every 15 minutes in
average. This activity is increasing every 5 to 15 years with
higher eruption columns and ballistic bombs that can reach 8
km. During these periods of increased activity small glowing
avalanches are also occurring on the upper flanks. Collapses of
summit domes, growing periodically in the crater open toward
the southeast, generate block-and-ash flows and scoria flows,
which enter the SE and east drainages as far as 5 to 11.5 km
from the vent. In addition, lava flows occurred at fissures on the
cone flanks at least twice during the past century (Fig.1).
Fig. 1: Study area’s location on Semeru volcano, East Java, Indonesia. The map shows the lahars inundation zone for the 20th century largest events (Adapted from Thouret et al., 2007). The study area is limited upstream by a natural fall created by a lava deposit, and downstream the confluence between the Kali Koboan and the Curah Lengkong. At the observation dam, a French – Japanese collaboration set up a video camera system, and recently
According to Lavigne and Suwa (2004), lahars at Semeru can
be (1) syn-eruptive lahars, occasionally generated when a
drainage system is choked by a pyroclastic flow, (2) secondary
and post-eruptive lahars – majority -, i.e. triggered by rainfall on
loose pyroclastic material. Yet some non-eruptive lahars – i.e.,
unrelated to eruptions – may occur through processes common
to volcanic terrains, such as landslides or flank collapse (e.g., in
1909 and 1981).
Tens of small-scale lahars (Q<400 m3/s) are commonly
triggered by high intensity monsoon storms during the rainy
season from October to April (Lavigne and Suwa, 2004). Three
factors favour the generation of the most serious lahar hazard at
Mt Semeru: (1) the volume of primary pyroclastic debris shed
around the summit is estimated at 4 x 10⁴ m3/yr each year
(Siswowidjojo et al., 1994); (2) a dense drainage network of at
least ten high-gradient rivers convey sediment on steep slopes
of the cone towards the east and SE ring plain over a distance
of 15-35 km, and; (3) annual rainfall amounts up to 3000-3500
mm. On 23-24 September 1998, a 500 mm rainfall during 48
hours on the SE flank triggered a lahar, which lasted 17 hours
with a discharge of 300 m3/s.
Sedimentologic and hydrologic parameters of rain-induced
lahars have been measured at 9.5 km from the summit in the
2000, each of eight largest lahars transported a volume of 4-5.7
x 105 m3 (Lavigne et Suwa, 2004). Each event emplaces as
much as 4 to 6 beds of hyperconcentrated-flow and
matrix-supported debris-flow deposits totalling 0.8 to 3 m in thickness.
Albeit non cohesive, these debris-flow deposits contain a large
amount of sand ash supplied by the scoria- and ash-rich
pyroclastic flows. Velocity was in the range of 1.5-7.5 m/s;
discharge in the range of 85-280 m3/s varies widely in debris
flows.
In the Lengkong River catchment (28.5 km2), erosion caused an
annual sediment discharge of as much as 2.7 x 10⁵ m3/km2 in
2000 (Lavigne, 2004). The specific denudation rate is about 4.4
x 105 t/km2/yr. These high sediment yield and denudation rates
compare well with other values reported on active composite
cones in humid environment (Major et al., 2000). In contrast to
these cones, however, sediment yield at Semeru does not
decline drastically within the first post-eruption year. This is due
to the steady supply of clasts shed in the summit area, which
can be remobilised by runoff any time during the rainy season
and even during the ‘dry’ season.
Our investigation was carried out over a 4,2 km length stripe in
the Curah Lengkong valley that extend from 3.8 to 8 km S-SE
from the summit of the Semeru volcano. This portion of the
valley is limited upstream by a wall built in a lava flow deposit
with the Curah Koboan, just down the location we set up the
video-camera system that allowed us to conduct previously
mentioned studies on lahars.
This contribution addresses two main issues related to the Mt
Semeru lahars deposits: (1) a description of their characteristics
and architecture (2) the calculation of removable volumes for
the 4,2 km study area.
2. Methodology
For this study we compounded: (1) a quantitative and qualitative
geomorphological investigation on lahars’ deposits; (2) a
geophysical method – Ground Penetrating Radar (GPR); and
(3) an alternative method to stereophotogrametry based on cast
shadows from aerial photographs that ended up into a GIS.
2.1 Field investigation: geomorphology and GPR
At first, we measured the morphometry of the valley bottom and
the lahars’ banks deposits using a laser rangefinder and a GPS.
We completed these measures with (1) samples from lahars’
banks for grain-size analysis, (2) and some qualitative
observations on material characteristics, on banks’ facies and
In a second time we organized a GPR campaign divided into (1)
a series of longitudinal transects at the bottom of the river (500
Mhz); (2) a few transects on selected lahars’ banks (500Mhz &
800Mhz). The GPR used for this study is a standard commercial
RAMAC. The GPR produces electromagnetic waves that are
controlled by the dielectric permittivity, electric conductivity and
magnetic permeability. Thus causes of signal variations are
often difficult to clearly identify. Because of these difficulties, we
calibrated the radar signal patterns against stratigraphic
exposures and material characteristics as it is commonly done
(e.g. Lowe, 1985; Rust and Russell, 2000; Gomez-Ortiz et al.,
2006). Once the signal was calibrated against outcrops we
extended GPR investigations on banks and on the Lengkong
River bed. After collection, we treated the data with the software
Reflex®, in order to improve the visuals, convert velocities into
depth, and introduce topographical data.
2.2 Aerial photographs analysis
For this study, we did not have aerial photographs that allowed
us to perform stereophotogrametry; therefore we elaborated a
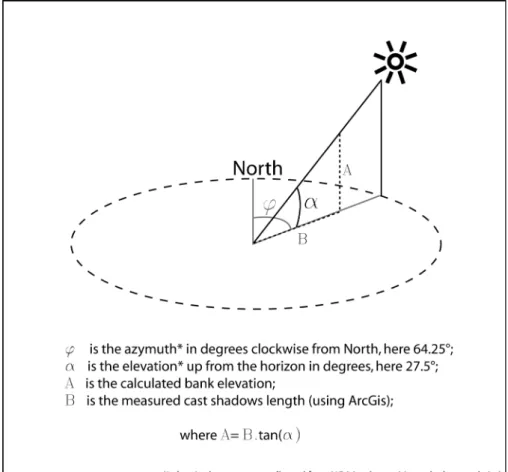
simple alternative method based on cast shadows (Fig. 2). The
bottom of the Lengkong valley is horizontal or close to
horizontal, and lahars banks deposits have subvertical edges.
the floor and the sun elevation in order to establish a relation
between cast shadows of lahars banks and their height. Thus
we measured the cast shadows on the aerial photographs
parallel to the azymuth orientation – 64.25 degree from North –
and multiplied it by the tangent of the sun elevation. The result
of this calculus gives the banks’ height. Photos were taken
between 9:32AM and 9:35AM, therefore we considered the sun
position as fix for the all set of photographs.
Fig. 2: measure of the sun position in the sky, and the cast shadows. For lahar deposit and valley bottom, this measure offers a simple and economic way to replace ortho-photographs, if they are not available.
The second step dealt with computing the data into a GIS in
order to retrieve the banks surface, and therefore calculate their
volumes, and analyze their distribution in the valley. Due to the
images limitations, we mainly measured banks with a height
ranging from 2m to 8.8 m. Then, we combined them with
surfaces calculated from the aerial photographs.
3. Results
For this study we worked on all deposits that were within the
Curah Lengkong valley, however we emphasized our banks
architecture’s investigation on the deposits of the largest lahar
that occurred on April 12th 2006, because (1) it left the largest
amount of deposits; (2) we studied its flow behavior in a
companion paper to be published (Cf. chapter 6).
3.1 Banks and valley bottom architecture
Terrasses deposits of the 12th April 2006 lahar are mainly
composed of coarse clasts with almost no silt or clay, which is
typical of non-cohesive lahars. Deposits are organized in
horizontal layers, separated by thin layers of well-sorted silty to
sandy material. These deposits can have different origin, as we
learned in chapter 6. They can either be sole layers, deposited
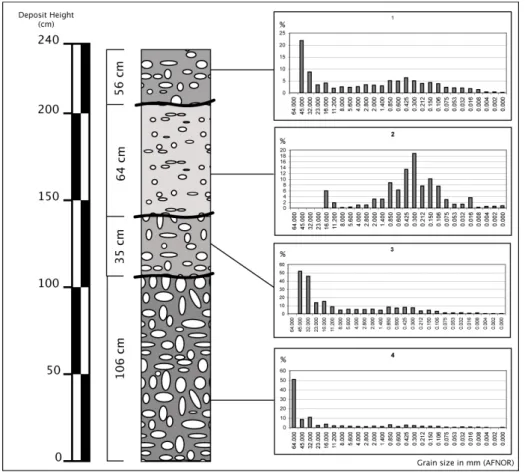
hyperconcentrated-flows or deposits linked to flow avulsion. At its thickest location –
thickness = 2.40 m - 3000 from the upstream limit of the study
area - the deposit has an architecture that comprises 4
horizontal units. They are respectively 56 cm 64 cm, 35 cm and
106 cm from top to bottom (Fig. 3).
Fig. 3: The 12th April lahar deposit stratigraphy and grain size at its thickest location. The unit 1 (upper unit) has a bimodal grain-size distribution, with numerous blocks inside a sandy matrix. The unit has only one mode, with a majority of sandy materials. The unit 3 has been conserved as it was after laboratory analysis. However this unit can’t be considered for interpretation, since there is an error in the measurements. The total of all the fractions is superior to 100%. Based on the field visuals though, the graphic should have the same global trend, with a majority of cobbles in a sandy matrix. In the end, unit 4 is dominated by elements which size is superior to 32 mm.
The grain-size of the first unit is a bimodal statistic distribution,
which is characteristic of debris-flows phases, with a large
proportion of boulders inside a sandy matrix. This unit is
showing a slight reverse gradient in grain-size. The second unit,
located just below has one mode that emphasizes the presence
of coarse sands. The distribution is close to a bell-shape,
characteristic of hyperconcentrated flow phases. The third unit
is characterized by a large number of cobbles in a sandy matrix
– as we had visual confirmation on the field -, however,
measurements’ errors at the laboratory in Indonesia want us not
to consider this data for further interpretation. In the end, the
unit 4 is characterized by a large presence of boulders with a
coarse sand matrix. Larger boulders were also observed on the
field, even though it was impossible to bring them back to the
laboratory. This unit is characteristic of the front deposit, with
the boulders abandoned on the side of the front (Lavigne and
Suwa, 2004).
Downstream, this deposit’s depth and number of unit diminish. It
has only 3 units at the foot of the dam that mark the
downstream limit of the study area. At this location, the deposit’s
architecture is not horizontal, but presents a downstream
skewed shape. The units are composed of coarse sands and
Against these direct observations, we compared the GPR
radargram, drawn from this location (Fig. 4).
Fig. 4: The three units of the 12th April lahar, down the observation dam. On this modified radargram, we distinguished the units we directly observed on the field with different tints of grey, and a dot-line separator. The actual separation between these units is characterized on the field by thin horizons of silty material, whereas a coarse sands matrix mainly composes the main units. On the radargram, we can see, within these units, the presence of a more complex architecture, with other contact layers, and the presence of punctual elements that create hyperbolas.
It obviously appears that grain-size variations influenced the
electromagnetic signal. Indeed thin layers of silty material gave
a distinctive reflective horizon on the radargram, which rendered
a net distinction between the three units of coarse elements. It
also clearly rendered the deposit’s architecture with its
downstream skewed shape. The radargram is not bringing any
new information for these outcrops that we could not get
visually, but it is important to note that we can retrieve the
it is possible to extend radargram away from outcrops, and work
on the lateral architecture of lahars’ terrasse, that do not offer
visual confirmation.
At the confluence of Curah Lengkong Valley and the Curah
Koboan Valley, we studied the architecture of terrasses from
both valleys, and evidenced the way they overlap (Fig. 5).
Thanks to the radargram, we could retrieve 9 different units
(units A to I) inside the deposit, although we don’t have a clear
image of the first centimeters, because of the surface echo (J).
All units are characterized by numerous hyperbolas that are
characteristics of the presence of numerous blocks (the
radargram does not offer any precision on their size). Each of
these units are separated by strong reflective horizons, like it
was the case for the radargram corroborated with the bank
(presented above).
The limits are not all clear though. For the two units “A” and “D”,
it is difficult to define a precise limit. Nevertheless, we can still
evaluate the order of deposition of the different Units. Hence,
the two first units that deposited are “D”, and “E” followed by “A”,
because this last one is slightly covering the edge of “E”. Then
“B” deposited. The other units don’t have enough contact area
to know the exact deposit order. Indeed unit “C” deposited after
“B” and “E”, and before “I” and “H”, but there are no other
Fig. 5: GPR transect on the Curah Lengkong’s right bank at the confluence with the Curah Koboan. The letters A to I indicate different units inside the bank deposit. Strong reflective horizons differentiate the units. The schema in color below shows these different units. This is a non-exhaustive method, and the numerous smaller units certainly remain unveiled.
Based on direct visual observations we could confirm units “I”
and “H” as lahar deposits, “H” being almost totally eroded. Unit
“G” is a leak from a pyroclastic-flow deposit that come from the
Kali Koboan. Other units could not be visually confirmed, but
there are no pyroclastic-flow recorded in the Curah Lengkong
until this distance, therefore units “A”,”B” and “C” are certainly
lahars deposits as well. They are either different units from a
single lahar, or more probably different lahars deposits.
Deposits at the bottom of the valley are more composite than
those of the terrasses, because they involve a wider variety of
materials: lahar deposits (wet or dry), lava flow deposits, and
undetermined mixed interfaces. Based on these differences we
retrieved an imagery of the valley’s subsurface in the lower part
of the valley - between lines 3500 m and 4000 m (Fig. 6). The
slowest velocities – 0.037 m/µs - characterize the lower part of the radargram. It corresponds to the thickest unit we detected
and it can reach locally 3 m depth on the radargram - although it
might be thicker, being out of range. This unit is locally reaching
the surface, and by analogy we could classify it as an andesitic
lava deposit.
On top of this unit extends a thick group of different units that
we could not differentiate from any apparent architecture or
Fig. 6: Longitudinal radargram at the bottom of the Curah Lengkong valley, on a bit more than 600 m. The units are graphically discriminated with the help of different grey tints, depending on the GPR signal velocity. The lower part is characterizes by slow velocities. We identified this unit as a lava deposit by analogy with visuals we had on the surface of the deposit. The upper units seem to be all lahar deposits with various proportions of water content, as far as the visual observation can account for the one located below.
Nevertheless, we recorded important variations in the
electromagnetic waves velocities - between 0.056 m/µs and 0.16 m/µs. Based on surface observations we can concur that those variations are due to change in water content. Faster
velocities characterize wet surfaces and volumes, whereas dry
surfaces and volumes tend to generate lower velocities.
Hence, lahar deposit architectures are very distinct, whether we
study terrasses or the bottom of the valley. Respectively, the
first one is characterized by horizontal or sub-horizontal layers
that laterally prograded from the outer limits towards the center
of the valley, whereas the second one do not display any clear
architecture, and appears massive and unsorted with blocks
distributed at random.
3.2 Distribution and volume of removable material
In order to estimate volumes of removable materials in the
Curah Lengkong valley we took in consideration two stocks of
materials (1) lahars terrasses, and (2) removable materials at
the bottom of the valley.
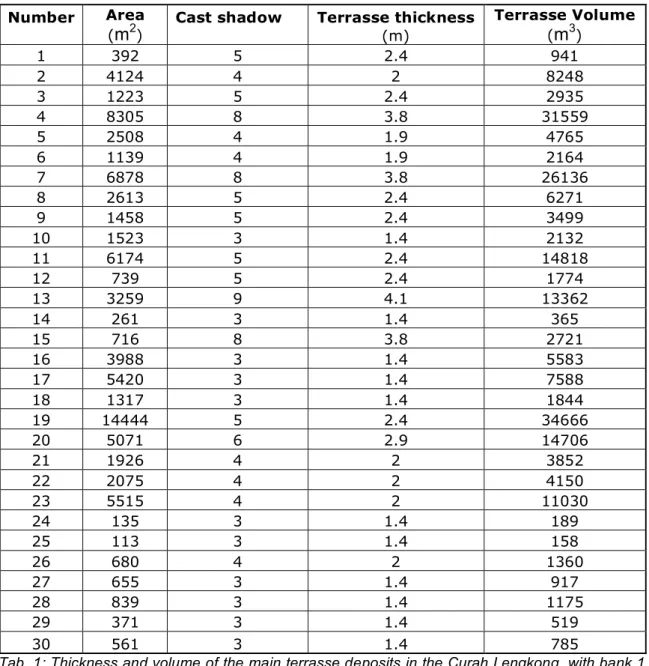
(1) The volume of terrasses is ranging between 189 m3 and
34,666 m3 (Tab. 1), with an overall volume of 210,212 m3 for all
terrasses along the 4.2 km length of the study area. This
or 55 m3/m of channel length if you consider the length to be 3.8
km. The terrasses’ distribution is uneven along the valley and
deposits are mainly concentrated within the two first kilometers
upstream (Fig. 7).
Number Area
(m2) Cast shadow Terrasse thickness (m)
Terrasse Volume (m3) 1 392 5 2.4 941 2 4124 4 2 8248 3 1223 5 2.4 2935 4 8305 8 3.8 31559 5 2508 4 1.9 4765 6 1139 4 1.9 2164 7 6878 8 3.8 26136 8 2613 5 2.4 6271 9 1458 5 2.4 3499 10 1523 3 1.4 2132 11 6174 5 2.4 14818 12 739 5 2.4 1774 13 3259 9 4.1 13362 14 261 3 1.4 365 15 716 8 3.8 2721 16 3988 3 1.4 5583 17 5420 3 1.4 7588 18 1317 3 1.4 1844 19 14444 5 2.4 34666 20 5071 6 2.9 14706 21 1926 4 2 3852 22 2075 4 2 4150 23 5515 4 2 11030 24 135 3 1.4 189 25 113 3 1.4 158 26 680 4 2 1360 27 655 3 1.4 917 28 839 3 1.4 1175 29 371 3 1.4 519 30 561 3 1.4 785
Tab. 1: Thickness and volume of the main terrasse deposits in the Curah Lengkong, with bank 1 located the most upstream and the last one, terrasse 30, located the most downstream.
Indeed 25% of the material is concentrated within the first 500m,
50% within the first 1500m; and 92% at more than 2000 m. The
repartition is also unbalanced between the left and the right side
of the valley, where 23 of the 30 measured banks lie on the left
side of the valley, with more than 80% of the deposits volume
for the left banks. Terrasses concentration is driven by two main
factors at the studied area: (1) the presence of a fall, like the
dam downstream the study area, or the lava subvertical limit,
upstream, which reduce the flow energy; (2) bends of large
amplitude in the channel, which dissipate the energy of the flow
and favor sediment deposition.
(2) The volume of removable materials at the bottom of the
valley was measured from two parameters: the valley’s surface
(208,039 m2) and the depth of removable materials (mean =
1.45 m). We considered that lahars, pyroclastic deposits, and
unwelded tephras, deposits were removable. On the opposite
lava was not incorporated, because it is resistant to lahar
erosion. The volume of material available at the bottom of the
valley for the 4.2 km studies is estimated to 301,600 m3 (for an
error margin estimated to be about 20% maximum, the volume
is ranging between 241,000 m3 and 362,000 m3). Therefore the
overall volume of materials potentially removable by lahars is
511870 m3 for the studied section of the valley (or between
margin). This represents 42% of the removable material is
comprised in the terrasses and 58% at the bottom of the valley.
Fig. 7: Distribution map and chart of the lahar terrasses’ deposits by volume in the Curah Lengkong valley. The majority of the deposits are concentrated in the upstream half of the valley, with two concentration zone between 0 m to 500 m and between 1800 m to 2500 m. These map observations are confirmed by the graphic, with 43,683 m3 of terrasses deposits in the first 250 m and a second peak between 1500 m and 2000 m with 52,765 m3. We can notice that the volumes’ curve does not perfectly fit the surface curve, so that deposits’ thickness plays an important role in the volume determination.
4. Discussion
This contribution brings six principal results: (1) The terrasses’
deposits architecture due to grain-size variations can be
retrieved with GPR; (2) The deposits’ architecture varies
longitudinally and transversally; (3) Terrasses’ deposits present
a clear architecture, whereas the bottom of the valley seem to
have none; (4) The removable materials contribute both from
the bottom of the valley and the terrases with unequal
proportions. (5) The terrasses’ deposits are unequally
distributed along the valley, depending on the morphology of the
valley.
The architecture of lahars’ bank deposits can be successfully
studied with GPR, at least when the deposits are not too
oxidized nor with an important fraction of clays that stop the
radar signal. The ability of the GPR signal to vary with grain-size
is well known and this characteristic is widely used in earth
sciences on other deposits, e.g. river basins (e.g. Sridhar et
Patidar, 2005), etc. In volcanic areas though, GPR is often
employed to characterize materials with a direct visual or
combined with other geophysical techniques (e.g. Gomez-Ortiz
et al., 2007), and it seldom separate from visual confirmation,
since the results induced a part of interpretation then. However,
recent studies are beginning to be interested in internal
zones in pyroclastic-flows deposits (Rust and Russel, 2000); the
stratigraphy of hydrovolcanic fields (Cagnoli and Russel, 2000);
internal structure of block-and-ash flow deposits (Gomez et al.,
2008).
Understanding the architecture of the deposits, both in
transversal and longitudinal orientations are essentials,
especially for lahar deposits. Indeed, it brings a serious
limitation to deposits analysis traditionally carried out from
outcrops alone. Indeed the transversal variations in the deposit
architecture, and notably the presence of lenses (Fig. 5) have
two direct consequences: (1) an observation or measure made
from a lahar bank outcrop can’t be extended laterally, and it is
not always representative of the deposit; (2) this same
observation or measure from an outcrop is also not
characteristic of the flow. Therefore, it is impossible to
reconstruct the strict phases of a lahar from an outcrop alone, or
even a series of outcrops.
Thus, the combination of radargrams with visual observations
and measures can be of great help to understand the all lahar
deposit architecture and deposition process. Cagnoli and Ulrych
(2001) also cleverly brought this aspect for base surge deposits,
the internal architecture of the deposit giving information on the
flow direction, and therefore its origin, when this one is
The volume of removable materials including both banks’
deposits and those at the bottom at the valley are of major
importance, since it is prime results, but this data wants to be
carefully interpreted since it has some limitations. Firstly we are
just estimating the available stock of material. Indeed lahars
erode unevenly the banks or the bottom of the valley, depending
on the lahar size and its sediment concentration. The videos of
the largest recorded lahar’s front at Semeru volcano- shot by F.
Lavigne in the C. Lengkong - is showing the lahars banks being
instantly eroded by the large boulders (Lavigne et al., 2003),
whereas videos of more modest lahars are showing banks that
perfectly resists the erosive power of the flow (in a companion
paper to be published). Moreover, if the debris flow phases can
erodes the banks, hyperconcentrated phases tend to
preferentially erode the bottom of the channel. Secondly, an
other limits of these volume measures is to be related to how far
they account for the all valley. Indeed the overall setting of our
study area is at a slope break between the steeper slope
upstream and the volcano foot with gentler slopes. Thus this
location may be a favorable area for deposits compared to
upper slopes. However, the presence of lava at the bottom of
the valley in the study area may artificially reduce the amount of
removable materials. Therefore, it seems difficult to extend
these results to other part of the valley, and deduct overall
In the end, the banks are unevenly distributed along the valley
(Fig. 7), where most of the deposits are located in the upstream
half of the valley, with two concentration zones. This uneven
distribution is certainly driven by two elements: (1) the first
concentration zone upstream is located just down a natural fall,
where the lahars loose an important amount of energy, hence,
the events tend to depose a large volume of material. (2) The
second concentration zone is located just above a SABO dam
that retains a large amount of lahars deposits, and artificially
enhances the deposits volume. The presence of this SABO dam
also explains the reason why there are only a few banks
deposits in the downstream part of the valley, a large amount of
sediments being stopped upstream the dam.
5. Conclusion
Despites a few limitations we expressed in the discussion,
volumes of removable materials and the deposits’ distribution
expressed here are important for hazards estimation and
engineering works like SABO dams constructions. It also gives
us a glance at the various sedimentation problems linked to
these constructions. In the end, the GPR also brings into light
the limitations of traditional geological or geographical methods
Acknowledgments: This work was supported by the
Laboratoire de Géographie Physique, UMR 8591-CNRS
(France), and funded by the INSU-CNRS through the ACI
research program ‘Aléas et changements globaux’ (Hazards
and Global Changes). We thank the two undergraduate
students who accompanied us in the field: Marion Giffo and
Cedric, the Semeru Volcano Observatory of The Geological
Institute of Indonesia in Gunung Sawur, Mr Dodi and Darmono
of the Mt. Semeru Project in Lumajang, and the Curah