HAL Id: hal-01296787
https://hal.archives-ouvertes.fr/hal-01296787
Submitted on 1 Apr 2016
HAL is a multi-disciplinary open access
archive for the deposit and dissemination of sci-entific research documents, whether they are pub-lished or not. The documents may come from teaching and research institutions in France or abroad, or from public or private research centers.
L’archive ouverte pluridisciplinaire HAL, est destinée au dépôt et à la diffusion de documents scientifiques de niveau recherche, publiés ou non, émanant des établissements d’enseignement et de recherche français ou étrangers, des laboratoires publics ou privés.
The impact of immigration on the French labor market:
Why so different?
Javier Ortega, Gregory Verdugo
To cite this version:
Javier Ortega, Gregory Verdugo. The impact of immigration on the French labor market: Why so different?. Labour Economics, Elsevier, 2014, 29, pp.14-27. �10.1016/j.labeco.2014.05.002�. �hal-01296787�
The Impact of Immigration on the French Labor Market:
Why so different?
*Javier Ortega†
City University London, CEP (LSE), CReAM, and IZA Gregory Verdugo‡
Banque de France and IZA May 2014
Abstract
Combining large (up to 25%) extracts of five French censuses and data from Labor Force Surveys for 1968-1999, we use Borjas (2003)’s factor proportions methodology for France and find that a 10 p.p. increase in the immigrant share raises natives’ wages by 3.3%, which is in stark contrast with the results in Borjas (2003) for the U.S. The positive impact of immigration on natives’ wages and employment is shown to hold also at the regional level. We find evidence that this positive correlation partly comes from the imperfect substitutability of natives and immigrants within education/experience cells. Specifically, (i) the occupational distribution of natives and immigrants within these cells is more dissimilar when there are more immigrants in the cell; (ii) natives tend to perform more abstract tasks when there are more immigrants in the cell; and (iii) an important part of the positive relation between immigration and wages comes from a reallocation of natives to better-paid occupations within the cells. However, we argue that this positive correlation is also likely to be related to the inability of the Borjas (2003) model to perfectly account for the important changes in the wage distribution and the educational level characterizing the French economy in this period.
JEL classification: J15, J31
*We would like to thank the editor (Kevin Lang), one anonymous referee, Herbert Brücker, Arnaud Lefranc, Claudio Michelacci, Núria
Rodríguez-Planas, and seminar participants at the Banque de France, CEP (LSE), Université de Lille, IFN (Stockholm), LAGV (Marseille), EALE-SOLE , IV Inside Conference (Barcelona), and Cergy for useful comments and helpful discussions. We also thank INSEE and the Centre Maurice Halbwachs (CMH) for giving us access to the data and for their help. The data used in this paper can be accessed through the CMH. This paper does not necessarily reflect the views of the Banque de France. This paper previously circulated under the title “Immigration and the Occupational Distribution of Natives: a Factor Proportion Approach”.
†
Department of Economics, Social Science Building, City University London, Northampton Square, UK-London EC1V 0HB, email:
javier.ortega.1@city.ac.uk
‡
Introduction
Recent years have seen a renewed interest in the research on the impact of immigration on the labor market outcomes of natives. Until the 1990s, the methodology exploited the variation in the share of immigrants across geographical locations.1 After Borjas, Freeman and Katz (1997) underlined some potential problems of this approach,2 a new strand of literature has proposed to measure the impact of immigration by relating the variation over time at the national level in the number of specific groups of immigrants with the outcomes of the natives with similar characteristics.
The dimension that has attracted most attention is the education/experience dimension, as proposed initially by Borjas (2003). This approach assumes that natives and immigrants within education/experience cells are perfect substitutes, and uses the variation in the immigrant share at the cell level over time to identify the impact of immigration. Using this model, and in contrast with the previous literature, Borjas (2003) finds a large negative impact of immigration on natives’ wages in the U.S. Since then, a series of papers have suggested different modifications or refinements of Borjas (2003)3 while other papers have obtained for different European countries4 small coefficients more in line with results of the spatial correlations literature. However, an important limitation of this last set of papers is that their estimates are likely to be attenuated by the short time periods and small sample sizes under consideration (see Aydemir and Borjas, 2011).
1 See e.g. Card (1990), Altonji and Card (1991) or Hunt (1992). The consensus was that the effect of immigration on natives was small, see for
instance Friedberg and Hunt (1995) or Borjas (1994).
2 Borjas et al. (1997) argues that this approach may understate the impact of immigration because (i) natives may respond to immigrant inflows
by moving out to other locations, which would diffuse the impact of migration across locations but would not be captured in a spatial correlation approach, and (ii) immigrants may choose the best locations, which would result in reverse causality. For a paper treating these biases, see Pischke and Velling (1997). Recent evidence on the response of natives to immigrations flows is relatively mixed, see Card and DiNardo (2000), Card (2001) and Borjas (2006).
3 Aydemir and Borjas (2007) finds also an impact of similar magnitude for Canada and Mexico. Card (2009) argues that, in the U.S.case, a
model with four groups of education (high-school dropouts, high-school graduates, individuals with some college, and college graduates) as in Borjas (2003) or Borjas and Katz (2007) does not fit well the data.
4 See Bonin (2005), Steinhart (2011) and Bauer, Flake and Sinning (2011), for Germany; Carrasco, Jimeno and Ortega (2008), for Spain; and
In this paper, we use the factor proportion approach to examine the impact of immigration in France over a time period of 30 years -- from 1968 to 1999.5 The first reason for focusing on France is the quality of the data. Indeed, in contrast with previous studies for European countries, we can exploit larger Census extracts (up to 25%) than in Borjas (2003) for a comparable period of time, which makes the results immune to attenuation biases.
In addition, the characteristics of the French labor market in the period under consideration are interesting for three reasons. First, institutions such as the minimum wage and a more centralized wage bargaining still play a large role in France, as in other European labor markets. In such a context, the impact of immigration might not be similar to that in the -more flexible- U.S. labor market. Second, during the period under consideration, France and the U.S. had contrasting evolutions in the educational attainment of their labor forces, with a pretty stable relative supply of young skilled workers in the U.S. after 1975 and instead an important increase in France during the same period. Finally, the variations in the immigrant share across groups and over time observed in France are large but quite different from the ones experienced in the U.S.: in particular, the largest inflows of unskilled immigrants into France took place in the 1960s and 1970s, a period of declining wage inequality with large increases in the wages of unskilled workers (see Verdugo, 2014). Instead, in the U.S., the largest inflows took place in the 1990s and the 2000s, when wage inequality was expanding. For these reasons, we believe that France provides a very good ground to understand if the large negative coefficients in Borjas (2003) extend to European countries and more generally to assess the robustness of this model to different time and cross-sectional variations.
In the baseline specification à la Borjas (2003), we find that a 10 p.p. increase in the immigrant share is associated with an increase in wages by 3.3% and an increase in employment rates by 2.6%. Such positive association of immigration with wages and
5 To the best of our knowledge, this is the first paper applying a factor proportion approach to France. Hunt (1992) studies the impact of
employment is not what one would expect in a competitive model after an immigration-driven rightward shift of the labor supply curve and sharply contrasts with Borjas (2003)’s results. Our results are shown to be robust to different alternative specifications. Specifically, when instrumenting with the settlement pattern of immigrants across 21 French regions, the impact of immigration on wages is still found to be positive and significant, with associated estimates quite close to the national-level estimates.
We next check the extent to which the positive correlation between wages and immigration can be explained by an imperfect substitutability of immigrants and natives within education/experience cells.6 Indeed, assume that natives within a given education/experience cell self-select à la Roy (1951) across tasks, and instead that immigrants are (initially) confined to routine tasks characterized by a relatively low use of language skills. In the presence of q-complementarity between tasks à la Autor, Levy and Murnane (2003), an inflow of immigrants to the routine tasks generates a further specialization of natives into nonroutine (language-intensive) tasks. This specialization should increase the wages of natives in the nonroutine task through q-complementarity, and increase the wages of the natives moving from routine to nonroutine tasks. However, the effect on the average wage of natives remains ambiguous given that the natives staying in routine tasks end up with lower wages.
We find evidence supporting this kind of story along three lines. First, we show that the degree of similarity of the distributions of natives and immigrants within education/experience cells is negatively related to the share of immigrants in the cell. This last result indicates that the presence of immigrants favors the relative specialization of natives with respect to immigrants within the cell.
6
Manacorda, Manning and Wadsworth (2012) for the U.K. and Ottaviano and Peri (2012) for the U.S. estimate a multi-level CES production function and conclude that natives and immigrants within education/experience cells are imperfect substitutes. However, Borjas, Grogger and Hanson (2008, 2012) argue that one cannot reject that immigrants and natives are perfect substitutes in the U.S. case.
Second, we build on the task content literature7 and show that a higher share of immigrants in the cell is associated with a decline in the average routine intensity of natives’ occupations and a higher specialization of natives in abstract tasks relative to immigrants. This suggests that natives move to tasks which are complement to the routine tasks performed by immigrants. Importantly, and unlike previous work such as Peri and Sparber (2009), this relation holds both at the national and at the regional level, and without restricting the analysis to low-skilled workers, i.e. for all educational groups.
Third, we decompose the change in natives’ wages into changes associated to the reallocation of natives across occupations within education/experience cells and changes in the wages for a constant occupational distribution. We show that native reallocation across occupations accounts for a large part of the overall impact on the wage, which further supports the imperfect substitutability argument.
In explaining the contrast between our estimates and Borjas (2003)’s, this argument might not be the full story. Indeed, the decomposition also shows that immigration strongly and positively impacts natives’ wages even when holding the occupational distribution constant. Absent an additional explanation, this result is a little bit surprising given that the positive impact of immigration on wages through q-complementarity should anyway be (at least partly) offset by the downward pressure on wages stemming from the inflow of natives into nonroutine occupations and the inflow of immigrants into routine occupations.
We argue that a complementary explanation to the contrast between our estimates and Borjas (2003)’s be found in the different evolutions of the French and U.S. labor markets. First, accounting for the important increase in the educational attainment of natives characterizing
7
See in particular Autor, Levy and Murnane (2003), Goos and Manning (2007), Black and Spitz-Oener (2010), or Acemoglu and Autor (2011) for papers on the demand for job skills, and Peri and Sparber (2009), Amuedo-Dorantes and de la Rica (2011), Prantl and Spitz-Oener (2011) or Imai, Stacey and Warman (2012) for papers specifically interested in immigration. In particular, Peri and Sparber (2009) and Amuedo-Dorantes and de la Rica (2011) provide evidence across respectively US states and Spanish regions that low-skilled natives respond to immigration by specializing in language-intensive tasks for which they have a comparative advantage and which are better remunerated than manual-physical tasks.
France in that period by controlling for the number of natives in the cells reduces by roughly one third the magnitude of the estimated effect of the immigrant share on wages – and does not change much in Borjas (2003) given the relative stability of natives’ educational attainment in the U.S. Second, in the pre-1975 period characterized in France by high levels of low-educated immigration and declining wage inequality, we obtain an unrealistically large impact of immigration on wages, which is likely to come from the imperfect absorption of the demand shocks by the fixed effects. Instead, for the rest of the period, characterized by lower immigration and more stable inequality in the lower tail of the distribution, the impact of immigration on wages is statistically insignificant. This type of result casts some doubts on the ability of the Borjas (2003) model to properly identify the impact of immigration on wages when the wage distribution itself is not stable over time for reasons unlikely to be related to immigration and which might actually be instead driving it.
The rest of the paper is organized as follows: Section 1 describes the data and Section 2 presents education/experience regressions to assess the impact of immigration on the labor market outcomes of natives. Next, Section 3 studies the relation between immigration and the occupational distribution of natives (versus immigrants) within education/experience cells. Finally, Section 4 discusses why the impact of immigration on wages estimated using French data differs so widely with respect to the impact obtained with U.S. data.
1 Data
We use data from five successive French censuses from 1968 to 1999 (1968, 1975, 1982, 1990, and 1999) to compute the number of immigrants and natives with a given level of education and labor market experience in each year.
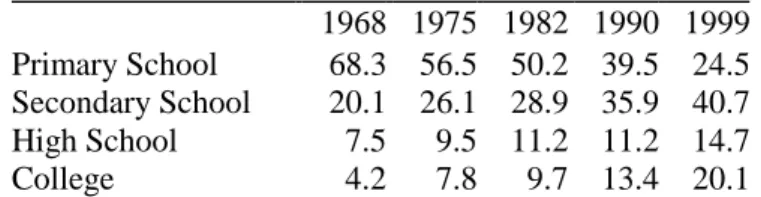
As common in the literature (see for instance Borjas, 2003, or Manacorda et al., 2012), we restrict our attention for most of our estimates to males aged 18-64. Men are classified into four
educational groups depending on their highest attained diploma: no education or primary education (at most 8 or 9 years of education), completed secondary education (between 10 and 11 years), high school (12 or 13 years), and college (at least 14 years).8
Table 1 shows the evolution of the educational composition of the male French labor force over the period. The most striking feature is that the share of individuals with only primary education decreased from about 68% in 1968 to 24.5% in 1999, while the share of individuals with high-school or college diploma rapidly increased.
Labor market experience is measured as the age of the individual minus the entry age into the labor market. As the entry age into the labor market is not observed, we assume that individuals with primary, secondary, high school, and college education enter the labor market respectively when 15, 16, 19, and 21 years old. In addition, we restrict the analysis to individuals between 1 and 40 years of labor market experience. For each education level, we group individuals in 5-years experience groups.
Following Borjas (2003), the immigration shock experienced by natives with education i
and experience j at year t can be measured bypijt, the relative share of immigrants among
all individuals in the cell:
/ ( ),
ijt ijt ijt ijt
p M M N
whereNijt and Mijt respectively denote the number of natives and the number of immigrants
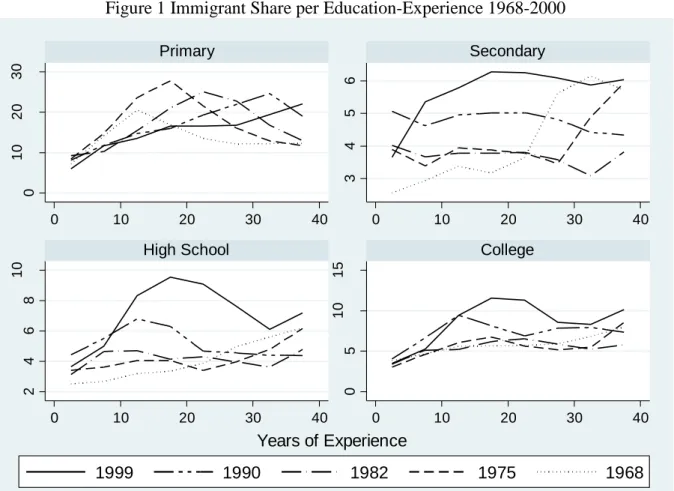
in the corresponding cell. Figure 1 reports pijt for the male population between 1968 and 1999
as computed from the Census data. From this figure, it appears that the evolution of the share of immigrants over time greatly varies across educational groups. For individuals with primary education, the share first rises and then declines. Instead, the share of immigrants among individuals with secondary education rises over the period, although not always in a monotonic
8 Appendix 1 provides a detailed match between reported diplomas in the censuses and our educational groups. We follow here the diploma
classification which serves as a reference for French labor relations. A category “some college” cannot be constructed for the entire sample period as data on uncompleted college (“Bac+2” and “Bac+3”) is only available since 1982. However, given the relatively low educational level of the French labor force at the beginning of the sixties, such distinction is not fundamental for the period of time under consideration.
fashion. Finally, for higher educational levels (high school and college graduates), and in contrast with the evolution for primary education, the share of immigrants generally decreases until 1982 and then rises in the 80s and the 90s.
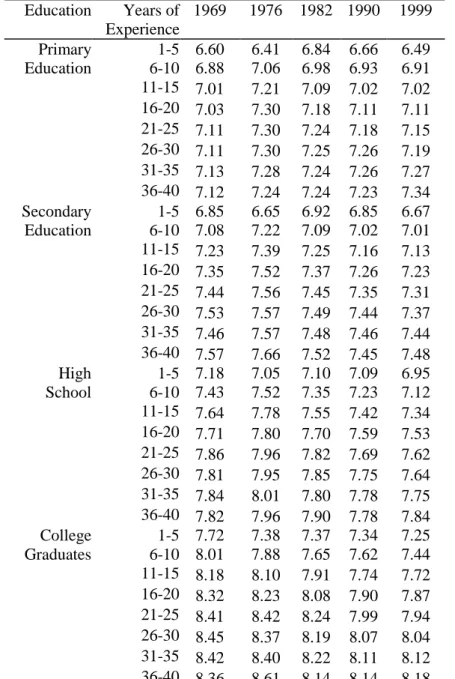
Since the French Census does not include information on income or wages, we rely on other surveys to construct our wage sample. As no information on wages is available at all for 1968 and 1975, the best approximation is the 1969 and 1976 data on annual wage income available in the 1970 and 1977 Enquête Formation et Qualification Professionnelles (FQP). For 1982, 1990, and 1999, the best available information on wages is given by the corresponding French Labor Force Survey (LFS), which provides information since 1982 on monthly wages in the month preceding the survey month.
Using the LFS and FQP data, we compute the average log monthly wage of natives and convert it into 2007 Euros using the CPI deflator from the French Statistical Institute (INSEE). Average log wages per experience and education level over the period are reported in Table 2. The picture for wages over time is quite simple and uniform across education/experience cells. Indeed, with few exceptions, wages rise during the period 1968-1976 and then decrease throughout the 1976-1999 period.
2 Immigration and Labor Market Outcomes of Natives
This section presents regressions at the education/experience level to try to identify the relation between immigration and natives’ labor market outcomes. Specifically, Section 2.1 presents the estimates of the Borjas (2003) specification, and Section 2.2 presents the estimates of models identified using additional geographical variations.
2.1 Borjas model
The initial specification from Borjas (2003) relates the labor market outcomes of natives to the immigrant share across education/experience groups as follows:
ijt ijt FE ijt
y p (1) whereyijt is a labor market outcome at period t for natives with education i and experience
j , pijt is the immigrant share, and FE is a set of education, time, and experience fixed
effects s with their corresponding interactions i.e.
( ) ( ) ( )
FE si sj st si sj si st sj st
.
The set of fixed effects included in the model should absorb the impact of demand shocks to different education/experience groups unrelated with changes in the immigrant share. If this is not the case, our estimates are biased if unobserved changes in labor demand are correlated with the immigrant share.9
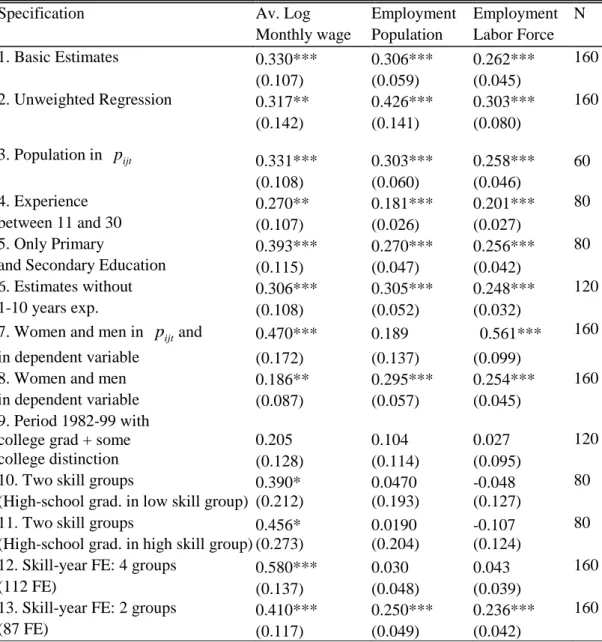
Table 3 presents estimates of (1) using OLS or WLS. In the baseline case (row 1), and in contrast with Borjas (2003), the immigrant share is found to be positively and significantly correlated with the average log monthly wage (column 1), the employment to population ratio (column 2), and the employment to labor force ratio (column 3). Quantitatively, the estimated impact is quite large: a 10 p.p. increase in the immigration share is estimated to raise native’s wages by 3.3%, the employment/population ratio by 3.1%, and the employment/labor force ratio by 2.6%. In terms of elasticities as defined in Borjas (2003), this means in particular that a 10% exogenous increase in labor supply attributable to immigration raises natives’ wages by 2.8%.10
9 Ottaviano and Peri (2012) argue that such a saturated model might absorb most of the identifying variations necessary to estimate the model.
We remain conservative and include the full set of fixed effects and interactions between education, experience and time in all the models estimated in this paper following Borjas (2003) and Borjas et al. (2008). This guarantees that our estimates are not biased by potential changes in the overall returns to education or experience over time. Another hypothesis necessary for the correct identification of the model is that natives do not change their education level over time in response to actual or anticipated future variations of immigrants’ flows. Hunt (2010) shows that immigration has a relatively small effect on educational levels in the U.S. More recently, Eberhard (2012) and Jackson (2011) have found larger effects.
10 To go from the estimate to an elasticity, we follow Borjas (2003) and define the “wage elasticity” as logw/ m / (1m)2
where m is the relative number of immigrants to natives. Over the period, m is about 9%, and the wage elasticity is thus obtained by multiplying the estimate (.33) by 0.84.
Row 2 indicates that the results are qualitatively similar when the regressions are
unweighted with the exception that the estimated positive correlation with employment rates is substantially larger.
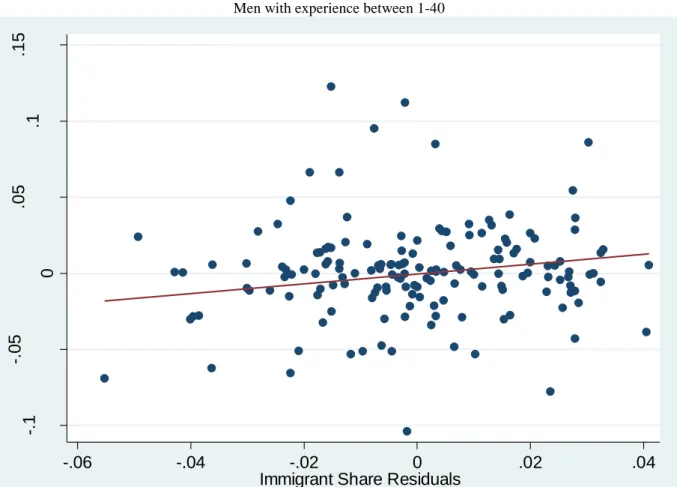
Figure 2 illustrates how well the model fits the data. The figure plots the residuals from the regression of wages on the fixed effects and the residuals of the immigrant share on the fixed effects, together with the regression line. From the figure, the results do not appear to be driven by specific observations.
A first concern for the validity of these initial estimates is that changes in participation rates and wages across demographic groups over this period might be spuriously correlated with variations of the immigrant share. Although France and the U.S. experienced similar employment-population ratios during the 60s, the employment-population ratio in France dramatically fell after that period both for both young workers (under 25) and old workers (above 55). In order to account for non-random labor force participation differences, Row 3 uses natives and immigrants from the entire population instead of labor force participants only when calculating pijt, and this yields virtually identical estimates. In turn, Row 4 eliminates
from the sample the cells of less than 11 years of experience and more than 30 years of experience. In that case, the estimated effects of immigration on log wages and employment rates are slightly lower but remain positive and significant.
A second issue is that the impact of immigration could differ across education groups. However, the estimates in Row 5 for low education levels (primary or secondary education only) still display a positive and significant correlation for all three endogenous variables.11
Row 6 shows that the coefficients remain similar when we exclude from the analysis the individuals with less than 10 years of experience, for which the prevalence of the minimum
11 The estimated impact of immigration for the individuals with more than secondary education only (not reported) is very small and
wage is very important, especially after 1975.12 The minimum wage is thus unlikely to be the main factor behind the positive correlation between immigration and natives’ labor market outcomes.
As men and women clearly do not constitute two disjoint segments of the labor market, Rows 7 and 8 provide estimates when data for women are included in the regressions. Specifically, Row 7 measures both the immigrant share and the dependent variable including data for women, while Row 8 keeps an immigrant share defined only for men but includes women in the endogenous variable. On the whole, including females does not alter qualitative results, although the coefficient on the employment to population ratio becomes insignificant in Row 7. However, including women in the measure of the immigrant share may be problematic due to the lower participation rate of immigrant women and the important increase over the period of the participation rate of female natives. Similarly, changes in the selection of women that participate to the labor market (see Mulligan and Rubinstein, 2008, and Olivetti and Petrongolo, 2008) may render difficult the interpretation of the coefficient associated to the wage when the wages of women are included in the computation of the native’s wage. For these reasons, we follow the rest of the literature and stick to regressions only for males in the rest of the paper.
Row 9 reports the estimates with 5 educational groups instead of 4 for 1982-1999 as in this period we can distinguish individuals with some years of college (two or three years of tertiary education) and college graduates (at least four or five years of education). Compared to the benchmark regression, the coefficients are now smaller and non-significant, although still positive. Next, Rows 10 and 11 check whether the results are robust to the consideration of only
12 The proportion of natives paid at the minimum wage plus 5% peaks at 87.3% in 1999 for the individuals with primary education and
experience level 1-5, increases rapidly over time, and is generally non negligible among the least educated for all experience levels and the least experienced for the all education levels. Instead, the share is systematically below 5% for individuals with at least high school education and more than ten years of experience. A table presenting the share of workers paid at the minimum wage across
two broad educational groups.13 Specifically, regression 10 pools together primary and secondary education, on the one hand, and high-school graduates and college graduates, on the other, while regression 11 pools together all education groups but the college graduates. In both specifications, the coefficient on wages remains positive and significant while the impact on employment is smaller and statistically insignificant.
Given that our initial set of fixed effects might be insufficient to eliminate biases, Row 12 includes the interaction between education, year and newly-constructed ten-year experience cells14 to account for time-varying group-specific unobserved labor demand shocks. This results in a substantially larger coefficient for wages and lower and statistically insignificant coefficients for both employment variables. As Row 12 includes 112 fixed effects for 160 observations, which might be excessive, Row 13 reduces the number of fixed effects by interacting the 10-years-experience cells and time only with the broad education groups defined in regression 10. The results are found to be comparable to those of the baseline model, but with a substantially larger coefficient on wages (0.41 instead of 0.33).
Overall, we find evidence of a positive correlation between the immigrant share and wages or employment, and this result is shown to be quite robust to various alternative sample constructions and specifications of the model.
2.2 Regional estimates
As the identification of the aggregate model might be biased if the immigrant share is endogenous, we now report estimates based on geographical variation across 21 French metropolitan regions.15 The main interest in using the geographical approach is that we can use the proportion of co-nationals in the region as an instrument for future immigrant inflows, as e.g. in Card (2001). Clearly, this instrument might not completely solve the endogeneity
13 In the case of the U.S., Card (2009) argues that, a model with four groups of education (high-school dropouts, high-school graduates,
individuals with some college, and college graduates) as in Borjas (2003) does not fit well the data.
14 More precisely, we define cells of 1-10, 11-20, 21-30, and 31-40 years of experience. 15 We exclude Corsica from the sample, as it represents only 0.5% of the French population.
problem. Indeed, serial correlations might create persistent correlations between location choice and economic outcome, which would invalidate the excludability restrictions of the instrument. In addition, as discussed by Borjas (2003), natives may respond to immigrant inflows by moving out to other locations, which would diffuse the impact of migration across locations.
To construct the instrument, we follow a standard ‘shift-share’ approach. Let C denote the immigrant’s country of origin and t a reference year. Then, one can predict the region-0 R
number of immigrants with education/experience ( , )i j for year t ( ˆMijtR) as:
, ˆ
ijtR CR C ijt
C
M
Mwhere MC ijt, is the total number of immigrants from country C with education level i and
experience level j residing in France in year t16 and 0 0 , , CR t CR C t M M
is the share of country-C immigrants in region R in the reference year t . 0
Given our large sample size, we distinguish groups of immigrants by using the maximum number of nationalities available, namely the 54 different countries of birth which are always reported separately across censuses. We construct two versions of this instrument. The first version uses 1968 as the reference year for all censuses, while our second version uses the lagged census year as a reference year.17 Our instrument is then simply computed using the predicted number of migrants and the number of natives i.e.
ˆ ˆ ˆ ˆ ijtR ijtR ijtR ijtR M p M N
16 Following Hunt and Gauthier-Loiselle (2010), we construct
CR
with data from immigrants of all education and experience levels in order to allow for a greater role of geography and ethnic networks. In doing so, we hope to avoid the results being driven by economic factors that might attract workers with specific education/experience levels to specific regions.
17
The two versions are likely to be quite different given that the stock of immigrants in 1968 comes mainly from Europe and the Maghreb, while post-1970s immigration comes also from Asia and Sub-Saharan Africa. Therefore, in some sense, the first version of the instrument uses traditional long run immigrant flows while the second instrument is related with more recent immigrant waves.
where the number of natives ˆN is predicted by using the total number of individuals in the ijt
region and the share of group i and j in the population at the national level in that year.
Table 4 reports WLS and IV regional level estimates. Following Borjas (2003), we estimate models with alternative sets of fixed effects which should absorb the impact of regional labor demand shocks. Specifically, Panel A’s regressions include controls for each possible two way interactions and fixed effects between education, experience, region and year, while Panel B’s regressions also include controls for an effect of region by education and by experience. Finally, in Panel C, we use region year fixed effects interacted with either experience or education fixed effects, as in Cortes (2008). These fixed effects account for region by education or region by experience specific factors which could be correlated with immigrant inflows.
Table 4 shows the immigrant share to be strongly and positively correlated to employment rates at the regional level independently of the specific fixed effects included. The correlation with wages is generally positive but becomes significant only in some cases, as in Panels B and C when introducing additional fixed effects. Also, as in Borjas (2003), the value of the estimated coefficients is greatly attenuated relative to national level estimates, with e.g. the coefficient of the impact of the immigrant share on wages falling from 0.33 at the national level to about 0.12 in the WLS estimates in Panel A.
3 Immigration and Occupations within Education/Experience
Cells
As underlined in the existing literature,18 natives and immigrants are likely to be imperfect substitutes in production. For this reason, this section studies the extent to which the positive
correlation between wages and immigration in France can be explained by an imperfect substitutability of immigrants and natives within education/experience cells.
Consider a simple version of the Autor et al. (2003) model whereby output within each education/experience cell is a combination of two inputs –routine and nonroutine labor- which are q-complements. Assume that natives are heterogeneous in their productivity in the nonroutine occupation –i.e. they provide a different number of efficiency units of the input - and self-select across occupations à la Roy (1951). In addition, to keep things simple, assume that all immigrants work in the routine occupation since routine tasks do not require many interactive and communication skills. Finally, assume that firms are willing to hire as many immigrants as present in the market, and that there is an exogenous immigration shock.
In this simple model, the arrival of immigrants initially depresses the wage in the routine task because of the additional supply of labor in this task and raises the wage in the nonroutine task given the q-complementarity between the two tasks. As a result, some natives shift from the routine towards the nonroutine occupation, which raises the wage in the routine occupation and lowers the wage in the nonroutine occupation until a new equilibrium is found. At the new equilibrium, the moderating effect resulting from the reallocation of natives across tasks is dominated by the effect of the initial immigration shock, and as a result the wage in the routine task ends up falling, while the wage in the nonroutine task increases. However, the wage per worker in the nonroutine task can end up being higher or lower –as the natives entering the nonroutine task after immigration are less efficient than those performing it initially- and the average native wage can also end up being higher or lower.19
Several assumptions or results of this simple model can be empirically tested. First, if the results in the previous section reflect an endogenous specialization of natives across tasks following immigration, one should find that natives are more likely to work in occupations
different from those of immigrants when there are more immigrants in the education/experience cell. To this purpose, section 3.1 checks whether the relative distributions of natives and immigrants across occupations tend to be more dissimilar when the immigrant share increases. Second, for this reallocation to have a positive effect on wages, natives should be more likely to work in tasks which are complement to the routine tasks performed by immigrants when the immigrant share increases. For this, section 3.2 investigates how the relative task contents of natives and immigrants’ occupations are related with the immigrant share in the cell.
Third, if this theoretical framework is relevant, occupational reallocation within education/experience cells should explain a significant part of the positive effect of immigration on wages found in section 2. For this, section 3.3 decomposes the changes in natives’ wages into changes associated to the reallocation of natives across occupations within the cell and changes in the wages for a constant occupational distribution. As the impact of immigration on the wages of nonroutine native ‘stayers’ in the model is ambiguous, our model does not predict whether a higher immigration share should be positively or negatively correlated to natives’ wages for a given occupational distribution. Instead, as the wages of natives moving from routine to nonroutine occupations unambiguously rise with immigration, one should expect that the immigrant share is positively correlated to the changes in the wages of the occupational ‘movers’.
Finally, in section 3.4, we estimate models using the wages and characteristics of occupations of already established immigrants as the dependent variable. The previous literature (e.g. Cortes, 2008) has found that recent immigrants are closer substitutes to previous immigrants than to natives. For this reason, we would expect the effect of changes in the immigrant share on the wages of already established immigrants to be negative or at least less positive than for natives.
3.1 Congruence Index across Detailed Occupations
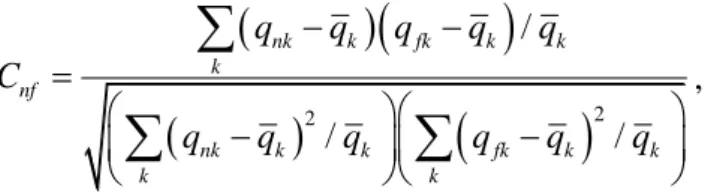
We first investigate whether the occupational distribution of natives and immigrants within education/experience cells differs more when more immigrants are present in the cell. A way of measuring the similarity of the distributions is to use Welch (1999)’s index of congruence given by
2
2 / / / nk k fk k k k nf nk k k fk k k k k q q q q q C q q q q q q
,where q (resp. nk qfk) denotes the proportion of natives (resp. immigrants) in occupation k
and q gives the proportion of the workers in occupation k. k
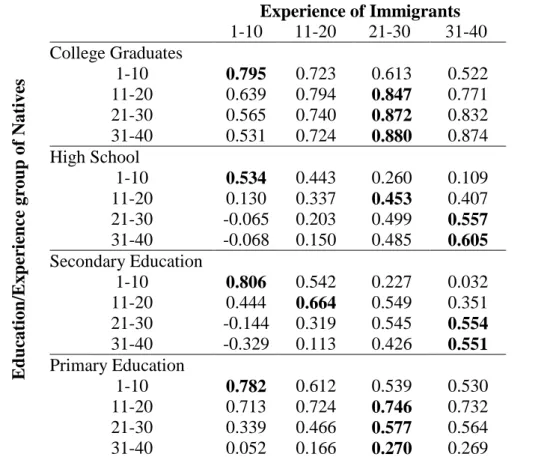
Table 5 presents the congruence index computed using the 1990 census for given educational groups (see Appendix Table 1 for the values in the other census years). Just as for the U.S. and in contrast with the results for Germany,20 the congruence indexes in France indicate similar patterns of relative specialization. Immigrants and natives with the same level of education and experience have generally occupational distributions which are more (positively) correlated than the distributions of immigrants and natives with the same education but different experience.
While the congruence index indicates that the distributions of natives and immigrants are not very different, our aim is to check whether the level of similarity is related to the share of immigrants in the cell. For this, we simply regress the congruence index of the two distributions on the immigrant share including the previously described set of fixed effects. If immigrants and natives are perfect substitutes, the congruence index should be uncorrelated to the immigrant share since in this case immigrants and natives always compete for the same jobs independently of the share of immigrants in the cells. Instead, if natives have comparative
advantages for some occupations, we should find a negative correlation between the congruence index and immigration as immigrants enter in this case occupations different from the occupations of natives.
The first column of Table 6 presents national level estimates for the entire period, while columns (2) to (5) use regional variations for 1975-1990, the period in which regional data is available. The parameter estimate at the national level indicates a strong and significant negative correlation between the congruence index and the immigrant share. At the regional level, the WLS estimates (columns 2 and 4) are still negative and significant, but smaller in magnitude. However, IV estimates using the settlement patterns of immigrants as instruments for the number of immigrants (columns 3 and 5) are larger and quite close to the national level estimate.
The estimated effects are substantial. In Column 1, the national level estimates imply that an increase of 10 p.p. of the immigrant share in the cell lowers by 0.12 the congruence index. When the index is 0.7, as often the case among immigrants and natives with the same level of experience and primary or college education, this corresponds to a decrease of the congruence index by 17%.
3.2 Task Contents
In order to explore how natives and immigrants specialize across occupations, we now empirically test whether the type of tasks performed by natives within each education/experience cell depends on the ratio of immigrants to natives in the cell. We use three measures of task characteristics ("abstract task importance", "routine task importance", and "routine task intensity") computed by Goos, Manning and Salomons (2010) [Table 4 p. 49] with data from the Occupational Information Network (O*NET) and manually match them with
French occupational classifications.21 To facilitate the interpretation of the results, the measures of task intensity are normalized such that their weighted average across cells is 0 and the standard deviation is 1, using the number of native workers as weights. Abstract task intensity rates highest among Corporate Managers (3.6) and Engineers (3.2) and lowest for Service Elementary Occupations (-1.6). As for routine importance, this ranges from Plant Operators (3.2) to Service Elementary Occupations (-0.23) and Corporate Managers (-2.8).22
Table 7 regresses the average intensity of the tasks performed by natives in education/experience cells against the immigrant share, both at the national and regional level. Subpanel 1 shows that a higher presence of immigrants in the education/experience cell is positively related to the natives performing more abstract-intensive tasks, although the coefficient is not significant at the national level. In addition, across specifications, the routine task importance (resp. intensity) of the occupations performed by natives is negatively and strongly correlated to the presence of immigrants in the cell, as shown in subpanel 2 (resp. subpanel 3).
Quantitatively, depending on the specification, an increase of 10 p.p. of the immigrant share raises abstract task importance by about 2 to 4%, lowers routine task importance by 7 to 15% and routine task intensity by 4 to 9% of a standard deviation.
In turn, Table 8 shows what happens when we consider instead the task intensity of the occupations of natives relative to those of immigrants. For all task measures, the coefficients are much larger than the coefficients for the task intensity of natives only, which indicates that the average task intensity of jobs performed by immigrants across occupations also varies with the share of immigrants. Specifically, we find that an increase in 10 p.p. of the immigrant share raises relative abstract task importance by 7 to 18%, lowers the relative routine task importance
21Abstract tasks are "complex problem solving" tasks, while routine tasks require either repetitive strength/motion or non-complex
cognitive skills, and do not thus require good language skills. Finally, "routine task intensity" is based on an index defined as routine task importance divided by the sum of abstract and service task importance. See Goos et al. (2010) [p.18-19] for details on data construction.
22Abstract and routine task importance measures are negatively correlated but the coefficient is only equal to -0.5 because several
by 15 to 27%, and lowers routine task intensity by 9 to 17% of the standard deviation of the task distribution in the population.23
Overall, natives perform more abstract than routine tasks in cells with higher number of immigrants relative to natives– both in absolute terms and relative to immigrants. In addition, the results in this subsection show that the presence of immigrants in education/experience cells is strongly correlated with the natives in those cells performing less routine and more abstract tasks.
3.3 Decomposition of Natives’ Wages
Let w denote the average wage of individuals from cell ijtk ( , , )i j t working in occupation k
and s denote the share of workers from that cell working in occupation ijtk k. The average
wage in cell ( , , )i j t can be written as:
k k
ijt ijt ijt
k
w
s wThen, changes in the wages of natives over time in an education/experience cell following an immigration inflow can be decomposed into changes in the distribution of natives across occupations and changes in their wages within occupations, i.e.
1 ( , 1) , 1( 1)
k k k k k k
ijt ijt ijt ij t ijt ij t ijt ijt
k k
w w
s s w
s w w (2)If immigrants have an impact on the occupational distribution of natives, then sijtk sij tk, 1 sijtk may be a function of the immigrant share.
The decomposition in (2) can be empirically implemented by constructing two counterfactual series using the reweighting procedure in DiNardo, Fortin and Lemieux (1996).
23
We have also estimated separately the relationship between immigrants’ task intensity and the number of immigrants (not reported).As suggested by the results in Table 8, we find that in cells with higher number of immigrants relative to natives, immigrants tend to work in occupations with less abstract tasks, more routine task and more routine task intensity. These results are available upon request.
Specifically, let wijt(w s0, )t denote the series constructed with the actual shares holding wages
constant at their reference year t level, i.e. 0
0 0 , , ( , ) k k ijt t ij t ij t k w w s
s wand wijt(w st, 0) denote the series constructed with the actual wages holding shares constant,
i.e. 0 0 , ( , ) k k. ijt t ij t ijt k w w s
s wGiven the relatively small number of observations for wages corresponding to certain education/experience cells, our counterfactual wage distributions across occupations can only be constructed if we choose a relatively parsimonious definition of occupations, namely the basic professional status whereby workers are classified as white-collar worker, technician, or blue-collar worker.
Panel A in Table 9 regresses wijt(w s0, )t on the immigrant share and the usual set of fixed
effects for different reference years. For all reference years, higher wages coming from the reallocation of natives towards better paid occupations are positively correlated with the presence of immigrants in the corresponding education/experience cell, which corresponds to the prediction of our model. The decline in the coefficient in the recent period reflects in a large part the decrease in the wage gap between occupations observed in France over the period. Quantitatively, a 10% increase in the share of immigrants in a cell is associated to an additional reallocation of natives across occupation generating a 1.5% to 3% increase in native wages depending on the reference year. As the overall impact of a 10 p.p. increase in the immigrant share is 3.3% (see Table 3), these results suggest that native reallocation across occupations accounts for a large part of the overall impact.
Next, Panel B in Table 9 shows that counterfactual fixed-occupation wages (wijt(w st, 0))
0
(wijt(w s, ))t . The impact is also large, the effects of a 10 p.p increase in the immigrant share
being correlated with an increase in native wages from 3% to 1.7% at constant distribution across occupations. Given that in our framework the effect of immigration on the wages of the occupational ‘stayers’ is ambiguous, this result is not incompatible with the model. However, as the size of the effect is large, this may also indicate the existence of positive demand shocks affecting the price of labor that are imperfectly absorbed by the fixed effects.
3.4 The Impact of Immigration on Already Established
Immigrants
As a final test, we estimate models using wages and occupations of already established immigrants as the dependent variable.24 Already established immigrants are more likely to compete with other immigrants than natives and, as a result, their wages should in principle respond negatively to the variations of the immigrant share. At the same time, if our previous results were completely driven by a bias which also affected the wages of already established immigrants, we would instead expect a positive coefficient. Reassuringly, column 1 in Table 10 shows that, in contrast with natives, the coefficient of the impact of the immigrant share on the wages of already established immigrants is negative but quite small and statistically insignificant.
The other regressions investigate how variations in the immigrant share influence the occupations of already established and new immigrants. We find that the occupations of already established immigrants are more likely to differ from those of new immigrants in cells with a larger immigrant share, which goes qualitatively in the same direction as the results for natives relative to immigrants. The coefficients are however much smaller than those obtained in similar regressions for natives (see row 1 in Table 11). Specifically, for both the congruence
24
As there is no arrival year in the data before the 1999 Census, we distinguish these two groups of immigrants by using a variable indicating the location at the date of the previous census. New immigrants are those who reported to be living abroad at the time of the previous census. Note that the definition of the immigrant share remains unchanged and includes all immigrants and natives.
index and the relative routine importance, the coefficient is divided by 10, and it is not actually statistically significant for the congruence index. For relative abstract importance, the coefficient decreases to a lower extent.
Overall, these results reinforce our conclusion that workers in education/experience cells are imperfect substitutes. Indeed, in addition to the imperfect substitution results between natives and immigrants in section 3.1 to 3.3, this section shows that already established immigrants and new immigrants are also imperfect substitutes. These results also suggest that recent immigrants compete in particular segments of the labor market, both with respect to already established immigrants and, to a lesser extent, with respect to natives (see Dustmann, Frattini and Preston, 2013).
4. What explains the differences between France and the U.S.?
As shown in Section 2, there is a stark contrast between Borjas (2003)’s estimates for the U.S. and our estimates for France using exactly the same approach.
In explaining this contrast, the imperfect substitutability results of the previous section might not be the full story for two reasons. First, using a different approach, Ottaviano and Peri (2012) shows that the U.S. is also characterized by imperfect substitutability within education-experience cells and Peri and Sparber (2009) shows that U.S. low skilled natives and immigrants specialize in different tasks. While the extent of this imperfect substitutability might be different in the two countries, it seems unlikely that this potential differential alone can drive the elasticity of natives’ wages with respect to the immigrant share from 3% to -3%. Second, the decomposition of natives’ wages in subsection 3.3 shows that the size of the impact of immigration on natives’ wages holding the occupational distribution constant is pretty large. This result is a little bit surprising given that the positive impact of immigration on wages
through q-complementarity should anyway be (at least partly) offset by the downward pressure on wages stemming from the inflow of natives into nonroutine occupations.
During the period under consideration, France and the U.S. had contrasting evolutions in the educational attainment of their labor forces, as illustrated by Figure 3: indeed, while the relative supply of young skilled workers remained pretty stable for the U.S. after 1975, it increased importantly for France in the same period (see also Table 1 for France)25 and this evolution was accompanied by a large decline in the skill premium (Verdugo, 2014). To check whether accounting for the changes in the educational attainment of natives changes the correlations between immigration and wages or occupations in France, regressions 2 and 3 in Table 11 include the log of natives in the education/experience cell as an additional regressor. In both regressions, the log of natives is found to be negatively correlated to both the wage of natives (column 1) and the relative abstract importance of tasks (column 3). Importantly, controlling for the log of natives reduces by roughly one third the magnitude of the estimated effect of the immigrant share on wages in regression 2 (from 0.33 in the baseline model to 0.201) and makes it statistically insignificant in regression 3.26 For the U.S., controlling for the log of natives does not change much the impact of immigration on log weekly earnings (see Table 3 p. 1351 in Borjas, 2003), which is probably related to the relative stability in natives’ educational attainments.
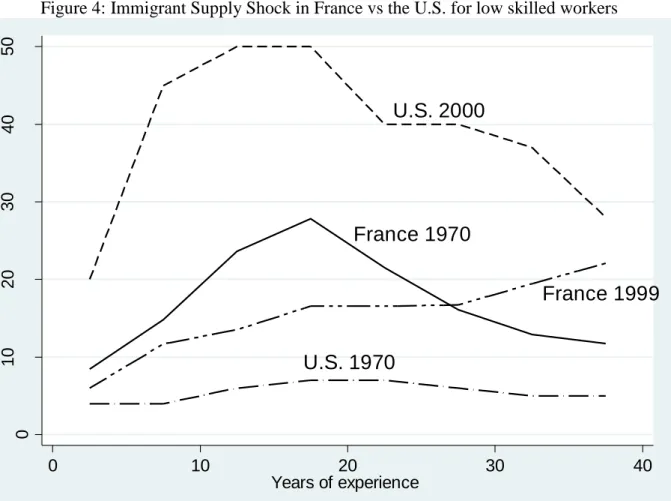
As illustrated by Figure 4, which puts together data from the French censuses and information in Figure 1. A in Borjas (2003, p. 1342), France and the U.S. also differ in the timing of low-educated immigration. Specifically, the immigration shock in the U.S. takes mainly place –for all education groups, but especially for the low-educated- in the 1980s and the 1990s, which are a period of widening wage inequality. In contrast, in the case of France,
25 Skilled workers are defined as individuals with more than high-school education for the U.S. and having either high-school or university
education for France. 26
Sincelnw/ m (1 /m)( ln w/ ln m) and the mean value of mis 9%, the elasticities corresponding to estimates in row 3 can be obtained by multiplying the coefficients by 11.1, assuming the number of natives fixed.
the largest inflows of low-educated immigrants were observed in the 1960s and 1970s, at the beginning of a significant compression of the wage distribution, characterized by large positive demand shocks, rapid wage growth and declining inequality, with both the real average wage and the minimum wage experiencing 4% annual increases during the first-half of the 1970s (Cette, Chouard and Verdugo, 2013). To check the characteristics of the estimates in such a high-immigration high-wage-growth environment, we estimate in Rows 4 and 5 the model separately for the period before and after the 1975 census. For the three measures of the characteristics of the occupations, the coefficients have the same signs and similar magnitudes in the pre-1975 period compared to the entire period (Row 1) or the post-1982 period (Row 5). This suggests that the imperfect substitution within education/experience cells identified in section 3 is a common feature of both periods. Instead, for wages, the pre-1975 regression delivers a very large and significant coefficient (0.927), which clearly shows that in this type of environment the model fails to capture the impact of immigration on natives’ wages. In contrast, post-1982, the coefficient is half the baseline coefficient and statistically insignificant. These differences suggest that one of the reasons for which the baseline coefficient for France differs from the results for the U.S. may be that the Borjas (2003) model does not perform well in the changing environment characterizing France in this period, as the time fixed-effects included in the model seem to be absorbing only imperfectly the demand shocks.
5 Conclusion
Following the literature initiated by Borjas (2003), we have chosen education/experience as the dimension along which natives and immigrants are assumed to be similar. When doing so for France with very large Census extracts, we have found a positive impact of immigration on the wages and employment of natives. This result has been shown to be robust to the introduction of a geographical dimension to education/experience cells.
We have also provided evidence along different lines that the positive correlation between immigration and wages is partly due to the imperfect substitutability of natives and immigrants within education/experience cells. Indeed, tasks and occupations, and not only education and experience, seem to be very important dimensions in the French labor market. Taking this reasoning one step further, this raises the question - clearly beyond the scope of this paper- of whether tasks and/or occupations are not actually in France a dimension as (or more) relevant than education and experience in defining whether natives and immigrants are competing with each other or not.
The paper also stresses that imperfect substitutability is unlikely to be the full explanation for the large positive correlation between immigration and natives’ wages in France. Indeed, parallel to the arrival of unskilled immigrants until the mid 1970s, the French economy experienced a compression of the wage distribution –with lower inequality in the bottom end- and an important increase in the educational level of natives, and we show evidence that part of the positive coefficient is related to the inability of the Borjas (2003) model to fully account for this. In addition, although our regional analysis presents evidence in the opposite direction, we cannot really rule out that in this period immigration was actually at least partly driven by the structural changes characterizing the French labor market.
Overall, our analysis casts some doubts on the performance of the Borjas (2003) model in countries/periods of time characterized by larger changes in the structure of the labor market not likely to be directly driven by immigration. Our ongoing research (Ortega and Verdugo, 2013) attempts to overcome some of these limitations by focusing on more homogenous groups of workers using administrative panel data.
References
Acemoglu, Daron and David. Autor, “Skills, Tasks and Technologies: Implications for Employment
Altonji, Joseph and David Card, “The Effects of Immigration on the Labor Market Outcomes of
Less-Skilled Natives,” in John Abowd and Richard B. Freeman, eds., Immigration, Trade and Labor, University of Chicago Press 1991.
Amuedo-Dorantes, Catalina and Sara de la Rica, “Complements or substitutes? Task specialization
by gender and nativity in Spain,” Labour Economics, 2011, 18 (5), 697 – 707.
Autor, David H., Frank Levy, and Richard J. Murnane, “The Skill Content Of Recent
Technological Change: An Empirical Exploration,” The Quarterly Journal of Economics, November 2003, 118 (4), 1279–1333.
Aydemir, Abdurrahman and George J. Borjas, “Cross-Country Variation in the Impact of
International Migration: Canada, Mexico, and the United States,” Journal of the European Economic
Association, 2007, 5 (4), 663–708.
Aydemir, Abdurrahman and George J. Borjas, “Attenuation Bias in Measuring the Wage Impact of
Immigration,” Journal of Labor Economics, 2011, 29 (1), 69–112.
Bauer, Thomas, Regina Flake, and Mathias Sinning, “Labor Market Effects of Immigration:
Evidence from Neighborhood Data,” Review of International Economics 21(2):370-385. May 2013.
Black, Sandra and Alexandra Spitz-Oener, “Explaining Women’s Success: Technological Change
and the Skill Content of Women’s Work,” The Review of Economics and Statistics, 2010, 92(1), 187–194.
Bonin, Holger, “Wage and Employment Effects of Immigration to Germany: Evidence from a Skill
Group Approach,” Working Paper 1875, IZA, December 2005.
Borjas, George J., “The Economics of Immigration,” Journal of Economic Literature, 1994, 32 (4),
1667–1717.
Borjas, George J., “The Labor Demand Curve is Downward Sloping: Reexamining the Impact of
Immigration on the Labor Market,” Quarterly Journal of Economics, 2003, 118 (4), 1335–1374.
Borjas, George J., “Native Internal Migration and the Labor Market Impact of Immigration,” Journal
of Human Resources, 2006, 41 (2), 221.
Borjas, George J. and Lawrence F. Katz, “The evolution of the Mexican-born workforce in the
United States,” in George J. Borjas, ed., Mexican immigration to the United States, National Bureau of Economic Research 2007, pp. 13–56.
Borjas, George J., Jeffrey Grogger, and Gordon H. Hanson, “Imperfect Substitution between
Immigrants and Natives: A Reappraisal,” Working Paper 13887, National Bureau of Economic Research, March 2008.
Borjas, George J., Jeffrey Grogger, and Gordon H. Hanson, “Comment: On Estimating Elasticities
of Substitution,” Journal of the European Economic Association, 2012, 10 (1), 198–223.
Borjas, George J., Richard B. Freeman, and Lawrence F. Katz, “How Much Do Immigration and
Trade Affect Labor Market Outcomes?,” Brookings Papers on Economic Activity, 1997, (1), 1–90.
Card, David, “The Impact of the Mariel Boatlift on the Miami Labor Market,” Industrial and Labor
Relations Review, 1990, 43 (2), 245–257.
Card, David, “Immigrant Inflows, Native Outflows, and the Local Market Impacts of Higher
Immigration,” Journal of Labor Economics, 2001, 19 (1), 22–64.
Card, David, “Immigration and Inequality,” American Economic Review (Papers and Proceedings),
May 2009, 99 (2), 1–21.
Card, David, and John DiNardo, “Do Immigrant Inflows Lead to Native Outflows?,” The American
Carrasco, Raquel, Juan F. Jimeno, and A. Carolina Ortega, “The effect of immigration on the labor
market performance of native-born workers: some evidence for Spain,” Journal of Population
Economics, 2008, 21 (3), 1–22.
Cette, Gilbert, Valérie Chouard, and Gregory Verdugo, “Minimum Wage and the Average Wage in
France: a Circular Relationship ?”, Economics Bulletin, 33 (3), 1832–1839
Cortes, Patricia, “The Effect of Low-Skilled Immigration on U.S. Prices: Evidence from CPI Data,”
Journal of Political Economy, 06 2008, 116 (3), 381–422.
DiNardo, John, Nicole M. Fortin, and Thomas Lemieux, “Labor Market Institutions and the
Distribution of Wages, 1973-1992: A Semiparametric Approach,” Econometrica, September 1996, 64 (5), 1001–44.
Dustmann, Christian, Francesca Fabbri, and Ian Preston, “The Impact of Immigration on the
British Labour Market,” The Economic Journal, 2005, 115 (507), 324–341.
Dustmann, Christian, Tommaso Frattini and Ian Preston, 2013. “The Effect of Immigration along
the Distribution of Wages,” Review of Economic Studies, 2013, 80 (1), 145-173.
Eberhard, Juan, “Immigration, Human Capital and the Welfare of Natives,” 2012.
Friedberg, Rachel M. and Jennifer Hunt, “The Impact of Immigrants on Host Country Wages,
Employment and Growth,” The Journal of Economic Perspectives, 1995, 9 (2), 23–44.
Goos, Maarten, Alan Manning, and Anna Salomons, “Explaining Job Polarization in Europe: The
Roles of Technology, Globalization and Institutions,” Working Paper 1026, CEP, November 2010.
Goos, Maarten, Alan Manning, and Anna Salomons, “Lousy and Lovely Jobs: The Rising
Polarization of Work in Britain,” The Review of Economics and Statistics, 01 2007, 89 (1), 118–133.
Hunt, Jennifer, “The Impact of the 1962 Repatriates from Algeria on the French Labor Market,”
Industrial and Labor Relations Review, 1992, 45 (3), 556–572.
Hunt, Jennifer, “The Impact of Immigration on the Educational Attainment of Natives,” September
2010.
Hunt, Jennifer and Marjolaine Gauthier-Loiselle, “How Much Does Immigration Boost
Innovation?,” American Economic Journal: Macroeconomics, April 2010, 2 (2), 31–56.
Imai, Susumu, Derek Stacey, and Casey Warman, “From Engineer to Taxi Driver? Occupational
Skills and the Economic Outcomes of Immigrants,” 2012.
Jackson, Osborne, “Does immigration crowd natives into or out of higher education?,” 2011.
Manacorda, Marco, Alan Manning, and Jonathan Wadsworth, “The Impact of Immigration on the
Structure of Wages: Theory and Evidence from Britain,” Journal of the European Economic
Association, 2012, 10 (1), 120–151.
Mulligan, Casey B. and Yona Rubinstein, “Selection, Investment, and Women’s Relative Wages over
Time.,” Quarterly Journal of Economics, 2008, 123 (3), 1061 – 1110.
Olivetti, Claudia and Barbara Petrongolo, “Unequal Pay or Unequal Employment? A Cross-Country
Analysis of Gender Gaps.,” Journal of Labor Economics, 2008, 26 (4), 621 – 654.
Ortega, Javier and Gregory Verdugo, “The Impact of Immigration on the Local Labor Market
Outcomes of Blue Collar Workers: Panel Data Evidence,” Technical Report 2013.
Ottaviano, Gianmarco I.P. and Giovanni Peri, “Rethinking the effect of immigration on wages,”
Journal of the European Economic Association, 2012, 10 (1), 152–198.
Peri, Giovanni and Chad Sparber, “Task Specialization, Comparative Advantages, and the Effects of