HAL Id: hal-01438356
https://hal.archives-ouvertes.fr/hal-01438356
Submitted on 17 Jan 2017
HAL is a multi-disciplinary open access
archive for the deposit and dissemination of
sci-entific research documents, whether they are
pub-lished or not. The documents may come from
teaching and research institutions in France or
abroad, or from public or private research centers.
L’archive ouverte pluridisciplinaire HAL, est
destinée au dépôt et à la diffusion de documents
scientifiques de niveau recherche, publiés ou non,
émanant des établissements d’enseignement et de
recherche français ou étrangers, des laboratoires
publics ou privés.
Impact of visual angle on attention deployment and
robustness of visual saliency models in videos: From SD
to UHD
Toinon Vigier, Matthieu Perreira da Silva, Patrick Le Callet
To cite this version:
Toinon Vigier, Matthieu Perreira da Silva, Patrick Le Callet. Impact of visual angle on attention
deployment and robustness of visual saliency models in videos: From SD to UHD. IEEE
Interna-tional Conference on Image Processing 2016 (ICIP), Sep 2016, Phoenix, United States. pp.689 - 693,
�10.1109/ICIP.2016.7532445�. �hal-01438356�
IMPACT OF VISUAL ANGLE ON ATTENTION DEPLOYMENT AND ROBUSTNESS OF
VISUAL SALIENCY MODELS IN VIDEOS: FROM SD TO UHD
Toinon Vigier, Matthieu Perreira Da Silva, Patrick Le Callet
IRCCyN CNRS UMR 6597, Universit´e de Nantes, France
ABSTRACT
The emergence of UHD video format induces larger screens and involves a wider stimulated visual angle. Therefore, its effect on visual attention can be questioned since it can impact quality assessment, metrics but also the whole chain of video processing and creation. Moreover, changes in visual tion from different viewing conditions challenge visual atten-tion models. In this paper, we present a comparative study of visual attention and viewing behavior on three video datasets in SD, HD and UHD conditions. Then, we propose and assess an improvement for video visual attention models by applying a stimulated visual angle dependent center model.
Index Terms— Visual attention, video, UHD, visual saliency model, eye tracking.
1. INTRODUCTION
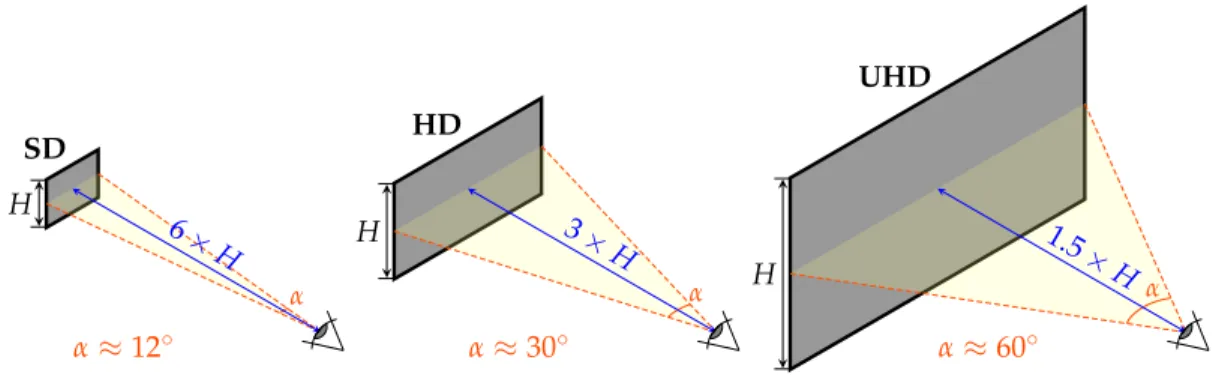
UHD TV standard defines new video technologies as an in-creasing resolution from HD (1920×1080) to 4K (3840×2160) or 8K (7680×4320). Thus, the emergence of UHD poten-tially provides a better immersion of the user thanks to a wider visual angle with appropriate larger screens [1]. Indeed, ITU defines the optimal viewing distance as the distance at which scanning lines just cannot be perceived with visual acuity of 1’. It is thus set to 6H for SD, 3H for HD and 1.5H for UHD where H is the height of the screen [2]. Figure 1 shows the increase of stimulated visual angle along with a better resolution.
Hence, two questions can be raised:
1. Does stimulated visual angle impact viewing behavior and strategies?
2. How can visual angle be taken into account to improve visual attention prediction?
Recent studies highlight the effect of transition from HD to UHD on visual attention [3, 4, 5]. By comparing visual at-tention in UHD and HD static images, Nemoto et al. pointed out that viewing strategy and visual attention are significantly different in these two cases: UHD images can grab the focus of attention more than HD images. Moreover, several models of visual saliency were compared in HD and UHD scenar-ios, showing a reduction of model performance in UHD [4].
However, viewing behavior in video differs from static im-ages, preventing the straightforward use of these observations for dynamic content. To our knowledge, the first UHD video saliency database was published in [5]. These data come with a comparison of viewing behavior in UHD and HD scenar-ios. It was especially shown that viewer attention was more focused on the center of the screen in HD context. Neverthe-less, no statistical analysis was provided and the performance of visual saliency models in UHD videos was not tackled.
In this paper, we propose to evaluate the impact of stim-ulated visual angle on visual attention deployment in videos and on the robustness of visual attention models. First, we assess visual patterns by comparing gaze data of three eye tracking datasets in SD, HD and UHD conditions. Then, we present and assess an improvement of video visual attention models by applying a visual angle dependent center model.
2. MATERIALS AND METHODS
In this section, we present SD, HD and UHD eye tracking datasets and metrics used in this comparative study.
2.1. Description of datasets
The used datasets are IVC SD [6], SAVAM [7] and a new UHD dataset, IVC UHD. All these three datasets fulfill the following criteria: public availability, description of the view-ing conditions, free-lookview-ing approach, no soundtrack, and most importantly, respect of the ITU viewing distance recom-mendations [8]. Because there is no public SD, HD and UHD eye tracking datasets sharing exactly the same content, we chose datasets with similar content, i.e. professional videos often used for subjective video quality assessment.
IVC SD is an eye tracking dataset of SD videos com-pressed in good quality with HEVC. Some of the 31 se-quences were presented in two versions: with and without transmission errors. We only use the transmission error-free version.
SAVAM is an HD visual attention dataset on high quality video sequences. Some observers viewed the sequences twice in reverse order. In this case, we only use the first viewing to avoid memory effects.
SD H α≈12◦ α 6× H HD H α≈30◦ α 3× H UHD H α≈60◦ α 1.5 ×H
Fig. 1. The increase of stimulated visual angle from SD to UHD.
IVC UHD is a new UHD dataset produced in IRCCyN laboratory on 78 reference UHD video sequences including a large variety of scenes. Because of the wider visual angle in UHD, observers can need to move their head and eye track-ing systems may not be accurate enough at the edges of the screen. Therefore, we developed a new eye tracking setup EHT (Eye Head Tracking) that is a combination of the mo-bile SMI eye tracking glasses and of the head tracker Opti-Track ARENA. The experiment was conducted in a test en-vironment set as a standard subjective quality test condition according to ITU-R BT.500 [9]. This new UHD dataset will be available at http://ivc.univ-nantes.fr/.
The detailed description for each dataset is provided in Table 1.
IVC SD SAVAM IVC UHD
Resolution 720×576 192×1080 3840×2160 Width (mm) 287.5 531.6 1422.2 Distance (mm) 1380 1000 1200 Distance/Height 6 3.3 1.5 Horizontal visual angle (°) 11.89 29.77 61.30 Nb of observers 49 48 37 Nb of sources 31 32 78 Sequence length (sec) 9 18 12
Table 1. Description of eye tracking datasets.
2.2. Saliency maps
We directly compute saliency maps on gaze positions rather than fixations as in [10]. Then, gaze points are convolved with a bidimensional gaussian function with σ = 1° of visual angle as recommended in [11]. It corresponds to a full width at half maximum (FWHM) of 2.2° which is approximately the size of the fovea. Saliency maps are computed according to the
proposed methodology for each video of each dataset. 2.3. Metrics
2.3.1. Dispersion
To evaluate the impact of stimulated visual angle on visual attention, we analyze the dispersion of gaze data through two metrics computed for each video of datasets: the mean and the standard deviation of the distances in degree of visual an-gle between gaze points and the center of the screen over all sequence video frames. In the following, we denote the mean of distances for one video sequence as dseqand the standard
deviation of distances for one video sequence as σdseq.
2.3.2. Comparison with center models
Center bias is a well know phenomenon in visual attention deployment corresponding to the the tendency to gaze mostly at the center of the visual content. This bias would arise from different causes as motor bias, viewing strategy or video con-tent [10, 12, 13]. To evaluate the distribution of gaze points around the center of the video, we compare the experimental saliency maps with center models thanks to Pearson corre-lation based measures (Cp) and Kullback-Liebler divergence (KLD) as recommended in [11]. Here, center models corre-spond to anisotropic 2D gaussian centered in the map. The ra-tio of the gaussian preserves the rara-tio of the map. The width is expressed in visual angle degrees and it represents the FWHM of the gaussian. Figure 2 depicts a 10° center model in SD, HD and UHD viewing conditions.
3. IMPACT OF STIMULATED VISUAL ANGLE ON GAZE DATA DISTRIBUTION
In this section we compare and discuss results obtained on the different datasets with the metrics presented in the previ-ous section. We refer to horizontal stimulated visual angle in degree as α.
3.1. Dispersion
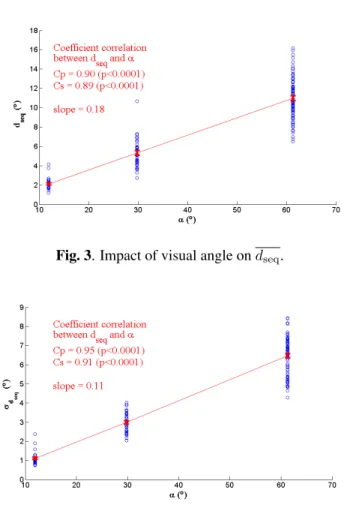
Fig. 3. Impact of visual angle on dseq.
Fig. 4. Impact of visual angle on σdseq.
Figure 3 shows that dseq linearly increases along with
the visual angle. The ratio between dseq and α remains
nearly constant around 0.18. A Kruskal-Wallis test validates that dseq/α is not significantly different between datasets
(p=0.66). Figure 4 shows a strong correlation between σdseq
and α. However, a Kruskal-Wallis test exhibits a slight but significant difference on σdseq/α between IVC SD and
SAVAM and between IVC SD and IVC UHD (p<0.01). Results on dispersion clearly indicate that observers scan a wider visual angle when stimulated visual angle increases. Nevertheless, the fact that the ratio between dseq and α
re-mains constant, suggests that, until a stimulated visual an-gle up to 60°, observers scan the same proportion of the im-age, reaching the same salient region. The slight increase of
IVC SD SAVAM IVC UHD Optimal width 3.9 9.0 17.7 Optimal width / α 0.33 0.30 0.29 KLD (width = α/3) 0.99 1.74 2.23 Cp (width = α/3) 0.64 0.49 0.52
Table 2. Optimal center model.
dispersion from SD to HD and UHD can be explained by a higher inter-observer variability due to an extended freedom of scanpath or a methodology bias due to the difference of sequence length through the datasets.
3.2. Comparison with center models
From the KLD and the Pearson correlation between center models of different width and saliency maps, we compute the optimal width of the center model for each dataset. It cor-responds to the mean of the width that minimizes KLD and the width that maximizes Pearson correlation coefficient Cp. Table 2 shows that optimal width increases along with stimu-lated visual angle but the ratio between the optimal width and α also remains nearly constant around α/3.
These results show a linear rule between optimal center model and stimulated visual angle. It confirms the previous assertion that gaze data distribution in video remains rela-tively stable between SD, HD and UHD viewing conditions. Moreover, it suggests that central bias is largely due to video content rather than motor bias. The optimal width of the cen-ter model, α/3, might reflect the rule of thirds in image and video composition.
4. IMPROVEMENT OF VISUAL SALIENCY MODELS WITH AN OPTIMAL CENTER MODEL In this section, we develop a method to make visual saliency models more robust toward viewing conditions, by using the fact that deployment of visual attention is proportional to stimulated visual angle.
4.1. Proposed method
Some authors show that modulating visual saliency models with a center model enables to simulate central bias improv-ing model performance[10, 12, 14]. However, the size of cen-ter models is rarely motivated. From the results in the previ-ous section, we propose to use viewing conditions and more precisely stimulated visual angle to compute an optimal cen-ter model. The FWHM of the gaussian in the optimal cencen-ter model is set as wopt= α/3. Then we can deduce σoptas:
σopt=
wopt
2√2 ln 2, thus σopt≈ α 7.06
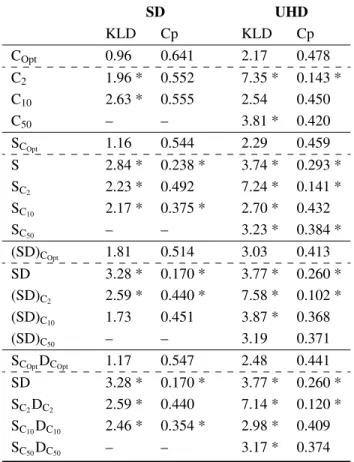
SD UHD KLD Cp KLD Cp COpt 0.96 0.641 2.17 0.478 C2 1.96 * 0.552 7.35 * 0.143 * C10 2.63 * 0.555 2.54 0.450 C50 – – 3.81 * 0.420 SCOpt 1.16 0.544 2.29 0.459 S 2.84 * 0.238 * 3.74 * 0.293 * SC2 2.23 * 0.492 7.24 * 0.141 * SC10 2.17 * 0.375 * 2.70 * 0.432 SC50 – – 3.23 * 0.384 * (SD)COpt 1.81 0.514 3.03 0.413 SD 3.28 * 0.170 * 3.77 * 0.260 * (SD)C2 2.59 * 0.440 * 7.58 * 0.102 * (SD)C10 1.73 0.451 3.87 * 0.368 (SD)C50 – – 3.19 0.371 SCOptDCOpt 1.17 0.547 2.48 0.441 SD 3.28 * 0.170 * 3.77 * 0.260 * SC2DC2 2.59 * 0.440 7.14 * 0.120 * SC10DC10 2.46 * 0.354 * 2.98 * 0.409 SC50DC50 – – 3.17 * 0.374
Table 3. Performance of visual attention models with differ-ent cdiffer-enter models. Cirepresents a center model of width i°and
XCirepresents the X map modulated with the Cicenter model.
S refers to static map and D to dynamic map. Results marked with * are significantly different from the optimal version of the model (non-parametric test).
To assess the optimality of the proposed center model, we confront the performance of visual saliency models with the original saliency map by computing KLD and Cp as de-scribed in Section 2.3.2 for 25 videos of the IVC SD and IVC UHD datasets. More precisely, we compare different center, static and dynamic map fusions from the model pro-posed in [15]. This computational model is a bottom-up vi-sual attention model. The fusion between static and dynamic maps is based on the maximum of the static map a and the skewness of the dynamic map b [16].
Msd= aMs+ bMd+ abMs× Md
The modulation of the fusion with center model is conducted in two configurations, whether the center model is applied before or after the static-dynamic fusion.
4.2. Results
Results in Table 3 show that the proposed center model is al-ways the best predictor in SD and UHD conditions. Most of
the time, it significantly outperforms the other center models. The comparison of the two fusion configurations suggests that it is better to modulate maps with central model before fusion. In this case, this simple adaptation permits to improve model performance of more than 100% in SD and around 50% in UHD. All the models (center, static and fusion) obtained bet-ter results in SD than in UHD which is consistent with re-sults of [4] obtained on static images. In this section, we proved that an optimal center model, directly dependent on stimulated visual angle, permits to significantly improve per-formance of visual saliency models on professional videos. However, other improvements are required to better fit visual attention models to UHD resolution.
5. CONCLUSION
In this paper, we assessed the impact of visual angle on visual attention deployment. By comparing results on three eye tracking datasets on SD, HD and UHD videos, we showed that the dispersion of gaze points is directly correlated with stimulated visual angle. Results suggest that visual deploy-ment in the video content remains relatively stable until a stimulated visual angle of about 60°. Moreover, we proved that an optimal center model, with a width equal to one third of stimulated visual angle, is the best predictor of visual saliency on professional videos. These results have been successfully applied to make visual saliency models more robust toward viewing conditions by modulating them with this optimal center model.
6. ACKNOWLEDGMENT
The authors wish to thank Josselin Rousseau for his help in generating the eye tracking UHD dataset used in this pa-per. This work has been supported by the UHD4U project financed by the CATRENE program.
7. REFERENCES
[1] ITU, “ITU-R BT.2020. Parameter values for ultra-high definition television systems for production and interna-tional programme exchange,” Tech. Rep., 2012. [2] ITU, “ITU-R BT.1769. Parameter values for an
ex-panded hierarchy of LSDI image formats for production and international programme exchange,” Tech. Rep., In-ternational Telecommunication Union, 2008.
[3] Hiromi Nemoto, Philippe Hanhart, Pavel Korshunov, and Touradj Ebrahimi, “Ultra-eye: UHD and HD im-ages eye tracking dataset,” in 2014 Sixth Interna-tional Workshop on Quality of Multimedia Experience (QoMEX). sep 2014, pp. 39–40, IEEE.
[4] Hiromi Nemoto, Philippe Hanhart, Pavel Korshunov, and Touradj Ebrahimi, “Impact of Ultra High Definition on Visual Attention,” in Proceedings of the ACM In-ternational Conference on Multimedia - MM ’14, New York, New York, USA, 2014, pp. 247–256, ACM Press. [5] Duo Li, Guangtao Zhai, and Xiaokang Yang, “Ultra high definition video saliency database,” in 2014 IEEE Visual Communications and Image Processing Confer-ence. dec 2014, pp. 97–100, IEEE.
[6] Fadi Boulos, Wei Chen, Benoit Parrein, and Patrick Le Callet, “Region-of-Interest intra prediction for H.264/AVC error resilience,” in 2009 16th IEEE Inter-national Conference on Image Processing (ICIP). nov 2009, pp. 3109–3112, IEEE.
[7] Yury Gitman, Mikhail Erofeev, Dmitriy Vatolin, Bol-shakov Andrey, and Fedorov Alexey, “Semiautomatic visual-attention modeling and its application to video compression,” in 2014 IEEE International Conference on Image Processing (ICIP). oct 2014, pp. 1105–1109, IEEE.
[8] Stefan Winkler and Ramanathan Subramanian, “Overview of Eye tracking Datasets,” in 2013 Fifth International Workshop on Quality of Multimedia Experience (QoMEX). jul 2013, pp. 212–217, IEEE. [9] ITU, “RECOMMENDATION ITU-R BT.500-11
Methodology for the subjective assessment of the qual-ity of television pictures,” Tech. Rep., 2002.
[10] Sophie Marat, Anis Rahman, Denis Pellerin, Nathalie Guyader, and Dominique Houzet, “Improving Visual Saliency by Adding ’Face Feature Map’ and ’Center Bias’,” Cognitive Computation, vol. 5, no. 1, pp. 63– 75, 2013.
[11] Olivier Le Meur and Thierry Baccino, “Methods for comparing scanpaths and saliency maps: strengths and weaknesses.,” Behavior research methods, vol. 45, no. 1, pp. 251–266, 2013.
[12] Olivier Le Meur, Patrick Le, and Dominique Barba, “Predicting visual fixations on video based on low-level visual features,” 2007.
[13] P. H. Tseng, Ran Carmi, Ian G M Cameron, Douglas P Munoz, and Laurent Itti, “Quantifying center bias of observers in free viewing of dynamic natural scenes,” Journal of Vision, vol. 9, no. 7, pp. 4–4, jul 2009. [14] Tilke Judd, Krista Ehinger, Fredo Durand, and Antonio
Torralba, “Learning to predict where humans look,” in 2009 IEEE 12th International Conference on Computer Vision. sep 2009, pp. 2106–2113, IEEE.
[15] Sophie Marat, Tien Ho Phuoc, Lionel Granjon, Nathalie Guyader, Denis Pellerin, and Anne Gu´erin-Dugu´e, “Modelling spatio-temporal saliency to predict gaze di-rection for short videos,” International Journal of Com-puter Vision, vol. 82, no. 3, pp. 231–243, 2009.
[16] Satya M Muddamsetty, Desire Sidibe, Alain Tremeau, and Fabrice Meriaudeau, “A performance evaluation of fusion techniques for spatio-temporal saliency detection in dynamic scenes,” in 2013 IEEE International Con-ference on Image Processing. sep 2013, pp. 3924–3928, IEEE.