HAL Id: insu-00286641
https://hal-insu.archives-ouvertes.fr/insu-00286641
Submitted on 10 Jun 2008HAL is a multi-disciplinary open access archive for the deposit and dissemination of sci-entific research documents, whether they are pub-lished or not. The documents may come from teaching and research institutions in France or abroad, or from public or private research centers.
L’archive ouverte pluridisciplinaire HAL, est destinée au dépôt et à la diffusion de documents scientifiques de niveau recherche, publiés ou non, émanant des établissements d’enseignement et de recherche français ou étrangers, des laboratoires publics ou privés.
Micro-crystalline inclusions analysis by PIXE and RBS
David Strivay, Claire Ramboz, J.P. Gallien, D. Grambole, Kalin Kouzmanov
To cite this version:
David Strivay, Claire Ramboz, J.P. Gallien, D. Grambole, Kalin Kouzmanov. Micro-crystalline inclusions analysis by PIXE and RBS. Nuclear Instruments and Methods in Physics Research Section B: Beam Interactions with Materials and Atoms, Elsevier, 2008, 266 (10), pp.2375-2378. �10.1016/j.nimb.2008.03.068�. �insu-00286641�
Micro-crystalline inclusions analysis by PIXE and RBS
D. Strivaya b , C. Ramboz b, J.-P. Gallienc, D. Gramboled, T. Sauvagee and K. Kouzmanovb, faInstitut de Physique Nucléaire, Atomique et Spectroscopie, Université de Liège, Belgium bInstitut des Sciences de la Terre d’Orléans, CNRS-Orléans, France
cLaboratoire Pierre Süe, CEA-Saclay, France
dIonenstrahlzentrum, Forschungszentrum Rossendorf, Germany
eCentre d’Etudes et de Recherches par Irradiation, CNRS-Orléans, France fSciences de la Terre, Université de Genève, France
Abstract
A characteristic feature of the nuclear microprobe using a 3 MeV proton beam is the long range of particles (around 70 μm in light matrices). The PIXE method, with EDS analysis and using the multilayer approach for treating the X-ray spectrum allows the chemistry of an intra-crystalline inclusion to be measured, provided the inclusion roof and thickness at the impact point of the beam (Z and e, respectively) are known (the depth of the inclusion floor is
Z + e). The parameter Z of an inclusion in a mineral can be measured with a precision of
around 1 μm using a motorized microscope. However, this value may significantly depart from Z if the analyzed inclusion has a complex shape. The parameter e can hardly be
measured optically. By using combined RBS and PIXE measurements, it is possible to obtain the geometrical information needed for quantitative elemental analysis. This paper will present measurements on synthetic samples to investigate the advantages of the technique, and also on natural solid and fluid inclusions in quartz. The influence of the geometrical parameters will be discussed with regard to the concentration determination by PIXE. In particular, accuracy of monazite micro-inclusion dating by coupled PIXE–RBS will be presented.
Keywords: Micro-inclusion; RBS; PIXE; Microprobe; Monazite PACS classification codes: 91.67.St; 82.80.Yc; 82.80.Ej
1. Introduction
Intra-crystalline solid or fluid micro-inclusions (size between 1 and 30 μm) are unique witnesses of pressure–temperature–time conditions of rock formation. They are helpful to analyze the chemical history of a rock. Major and trace element analysis is needed to
characterize them. A specific feature of the PIXE (particle Induced X-ray emission) method is its ability to analyse intra-crystalline micro-inclusions in a non-destructive way [1], [2], [3] and [4]. This is because the range of 3 MeV protons is of the order of 70 μm in silicates. However, to be fully quantitative, the PIXE method requires the exact knowledge of the geometrical features of the layers successively passed through by the beam, both outside and
within the target. When analysing intra-crystalline micro-inclusions, knowledge of the geometry and the chemical composition of the layers passed through by the protons and photons within the matrix become essential for controlling the accuracy of the analysis of the irradiated phases separately. The quantitative analysis of intra-crystalline inclusions in geological targets is commonly performed using the multilayer yield model integrated into most PIXE data treatment softwares like GUPIX [5] and [6]. This approach however, requires the depth and thickness of the intra-crystalline inclusions (Z and e, respectively) to be
measured. Several approaches have been applied so far to estimate these geometric features. One can use the optical microscope with motorized focusing to measure the depth of the top or the mid-plane of an inclusion at ±1 μm. Its floor cannot however, be clearly seen with a conventional microscope. The thickness of the inclusion is commonly taken to be equal to its width, thus assuming a spherical shape for the inclusion. Another method is confocal
microscopy that allows one to precisely rebuild the 3D-geometry of an inclusion. The exact path of the beam through an inclusion during the time of PIXE data acquisition is however, very difficult to control due to a possible shift of the beam position relative to the inclusion during analysis. Several authors have proposed to deduce the depth of an intra-crystalline inclusion from the PIXE spectrum itself [7], [8] and [9]. For a given element the K* /Kβ
method consists of adjusting the parameter Z so that the X-ray yields computed for the K* and Kβ lines become equal. In silicates, this method presents an acceptable accuracy only for Ca. For elements lighter than Ca, its precision is limited by the detector resolution which does not allow the K* and Kβ lines to be properly separated. For heavier elements, the difference in
absorption of the K* and Kβ lines by silicates becomes insignificant. Finally Menez et al. [10]
proposed to determine the Z parameter from the energy at which the Na-resonance occurs in the inclusion. Beyond the fact that this method can only be applied to Na-rich inclusions, it has the drawback of significantly increasing the data acquisition time as it requires additional PIGE (particle induced γ-ray emission) measurements to be performed at different conditions from the ones required for the PIXE spectrum. This paper proposes to investigate the
capability of coupled PIXE–RBS (Rutherford backscattering spectrometry) methods to analyse quantitatively intra-crystalline micro-inclusions. Several authors already underlined that much information can be obtained from accelerator-based techniques when they are applied simultaneously [11] and [12]. Conventional RBS using *-particles is a method commonly used to obtain information on depth distribution of elements in the sample surface layers up to a few μm thick. RBS is also frequently coupled with PIXE in order to normalize X-ray spectra and to analyze the major light elements of the target, undetected by PIXE. In this paper, we examine the possibility of determining depth and thickness of 10–500 μm long solid and fluid inclusions located to 5–20 μm deep in quartz from the spectrum of
backscattered protons. We show that the use of RBS presents several advantages compared to other previously listed methods. Firstly it allows both the parameters Z and e to be
simultaneously determined along the very beam path where X-ray emission is generated. Secondly it does not increase the data acquisition time.
2. Results and discussion
In order to test the capability of RBS to determine the geometry of micro-inclusions, we have chosen two different cases: a fluid inclusion in quartz and a monazite micro-inclusion in quartz. The main disadvantage of using protons of a few MeV to perform RBS is that the scattering cross sections in light elements are non-Rutherford. Nonetheless, by using
experimental cross sections available in SIMNRA [13] it is possible to model the RBS spectra and determine the different geometrical parameters.
2.1. Experimental arrangement
Measurements have been performed in two laboratories: Laboratoire Pierre Süe (LPS) at CEA-Saclay in France [14] and at the Institute of Ion Beam Physics and Materials Research of the Forschungszentrum Dresden-Rossendorf in Germany [15]. The experimental conditions at the LPS were a proton beam of 3.2 MeV and 3.5 MeV with a beam spot of 5 μm. RBS measurements were done by an annular PIPS detector and PIXE measurements by a Ge detector. At the Rossendorf microprobe, we have used a proton beam of 3 MeV with a beam spot of 3 μm. RBS measurements were done also with a PIPS detector and PIXE with a Si(Li) detector. In both cases, beam current was of the order on the nA and measurement times were around 1 h.
2.2. Fluid inclusion
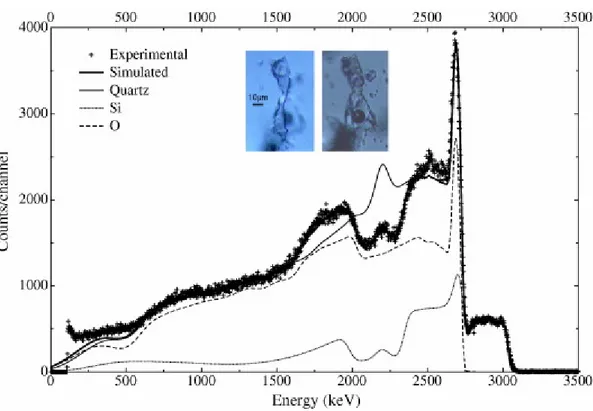
In the case of fluid inclusion, we have chosen a complex shape inclusion (cf. Fig 1). In this case, we see that it is necessary to determine the geometrical parameters at the very point of analysis. This inclusion has a variable width of 10–30 μm and a length of approximatively 100 μm. The depth and the thickness are variable. Fig. 1 represents the RBS spectrum of the fluid inclusion with a 3.5 MeV proton beam. The thin solid line is the spectrum that would be obtained if there was only quartz. This allows us to show the highly non-Rutherford behavior of the scattering of protons by oxygen and silicon. The effect of the fluid inclusion presence on the spectrum is the hole between 2 and 2.3 MeV and a bump between 1.7 and 2 MeV. It is due to the fact that the fluid inclusion is of course mainly composed of water. So, the hole is due to the lack of silicon and the bump to the higher amount of oxygen. By modeling this Si decreasing and this O increasing, it is then relatively easy to determine the depth and the thickness of the fluid inclusion by using SIMNRA software. In this case, the computed depth Z is of 14.4 ± 0.5 μm and the thickness e is 11.1 ± 0.5 μm. The difficulty in such fluid inclusion analysis is first to have a good mechanical stability of the sample holder as one measurement can take up to 1 h as the beam current can not be too high to avoid inclusion leaking due to the heat deposited by the beam.
2.3. Solid inclusion
For solid inclusion we have taken the case of a micro-inclusion of monazite again in quartz (see Fig. 2 [16]. The composition of monazite is PO4(Ce, La, Nd) with traces of Th, U and Pb.
The interest of monazite is that it is possible to determine the age of the crystal by measuring Th, U and Pb concentrations as Pb is only coming from the disintegration of U and Th [17]. As the disintegration periods are well-known, it is easy to compute the age from the following relationship:
where λ232, λ238 and λ235 are, respectively, equal to 4.93 × 10⁻¹¹, 1.55 × 10⁻¹⁰ and 9.85 × 10⁻¹⁰
years−1 and where MPb206, MPb207, MPb208, MTh232, MU235 and MU238 are the respective isotopic
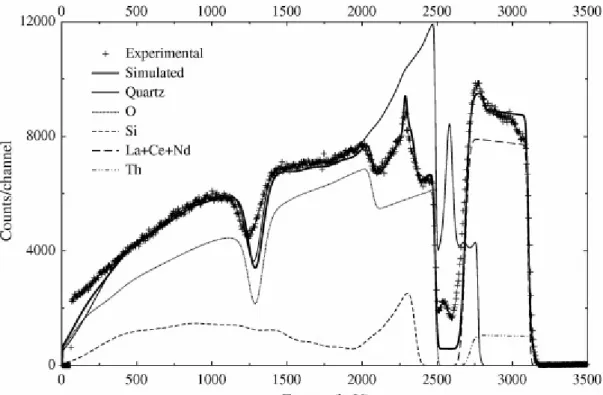
masses. RBS analysis is needed to determine the inclusion geometrical parameters which are required in the analysis of the PIXE spectrum e.g. with GUPIX program. Fig. 2 shows the elemental mapping using RBS (b) and Th (c). Single point analysis was performed in the more intense Th region. Fig. 3 represents the 3.2 MeV proton RBS spectrum of the monazite micro-inclusion. Again the thin solid line represents the RBS spectrum of quartz alone. In this case, the monazite is on the surface and its thickness e is 5.9 ± 0.5 μm. By feeding GUPIX with the thickness and the matrix composition of the inclusion, Th, U and Pb concentrations were determined and are, respectively, equal to 45,500 ± 500 ppm, 5500 ± 250 ppm and 880 ± 80 ppm. The computed monazite age is then equal to 300 ± 20 million years. Detection of monazite micro-inclusion is easier than for a fluid inclusion due to the presence of heavy elements. However, inaccurate database of L-line cross section specially for Th and U can lead to high uncertainties on the age determination. A stable microbeam is again needed in this case because irradiation time is long due to the low Pb concentration.
3. Conclusion
We have shown in this paper that proton RBS can be used to determined the geometrical parameters of fluid and solid micro-inclusions. The optimal microprobe setup for analysis of intra-crystalline inclusions is a beam size of 1 μm, good detector efficiency and resolution to separate rare-earth lines. Special attention is to be given to the microprobe beam stability as the single point measurements are long.
Acknowledgement
We are indebted to the Institut Universitaire des Sciences Nucléaires and to the Studium for financial supports.
References
[1] M. Kurosawa, S. Shimano, S. Ishii, K. Shima and T. Kato, Geochim. Cosmochim. Acta 67 (2003), p. 4337.
[2] M. Kurosawa, S. Shimano, S. Ishii, K. Shima and T. Kato, Nucl. Instr. and Meth. B 210 (2003), p. 464.
[3] K. Zaw, S.R. Hunns, R.R. Large, J.B. Gemmell, C.G. Ryan and T.P. Mernagh, Chem.
Geol. 194 (2003), p. 225.
[4] C.G. Ryan, E. van Achterbergh, C.J. Yeats, S.L. Drieberg, G. Mark, B.M. McInnes, T.T. Win, G. Cripps and G.F. Suter, Nucl. Instr. and Meth. B 188 (2002), p. 18.
[5] J.A. Maxwell, J.L. Campbell and W.J. Teesdale, Nucl. Instr. and Meth. B 43 (1989), p. 218.
[6] J.A. Maxwell, W.J. Teesdale and J.L. Campbell, Nucl. Instr. and Meth. B 95 (1995), p. 407.
[7] E.E. Horn and K. Traxel, Chem. Geol. 61 (1987), p. 29.
[8] C.G. Ryan, C.A. Heinrich and T.P. Mernagh, Nucl. Instr. and Meth. B 77 (1993), p. 463. [9] C.G. Ryan, Nucl. Instr. and Meth. B 158 (1999), p. 523.
[10] B. Menez, P. Philippot, M. Bonnin-Mosbah and F. Gibert, Nucl. Instr. and Meth. B 158 (1999), p. 523.
[12] G. Demortier, S. Mathot and B. Van Oystaeyen, Nucl. Instr. and Meth. B 49 (1990), p. 46.
[13] M. Mayer in: J.L. Duggan, I.L. Morgan (Eds.), Proceedings of the 15th ICAARI, AIP Conference Proceedings 475, 1999, p. 541.
[14] H. Khodja, E. Berthoumieux, L. Daudin and J.-P. Gallien, Nucl. Instr. and Meth. B 181 (2001), p. 83.
[15] F. Hermann and D. Grambole, Nucl. Instr. and Meth. B 104 (1995), p. 26.
[16] K. Kouzmanov, J.M. Beny, C. Ramboz, L. Bailly, in: Proceedings of ABCD-GEODE 2000, Borovets, Bulgaria, 2000, p. 38.
[17] F. Bruhn, A. Möller, S.H. Sie and B.J. Hensen, Nucl. Instr. and Meth. B 158 (1999), p. 616.
Figures
Fig. 2. Optical image (a) and elemental mapping of the monazite by the Ce, La, Nd and Th signal from RBS spectrum (b) and Th PIXE peak (c).