HAL Id: hal-02397843
https://hal.archives-ouvertes.fr/hal-02397843
Submitted on 6 Dec 2019HAL is a multi-disciplinary open access archive for the deposit and dissemination of sci-entific research documents, whether they are pub-lished or not. The documents may come from teaching and research institutions in France or abroad, or from public or private research centers.
L’archive ouverte pluridisciplinaire HAL, est destinée au dépôt et à la diffusion de documents scientifiques de niveau recherche, publiés ou non, émanant des établissements d’enseignement et de recherche français ou étrangers, des laboratoires publics ou privés.
Role of the two PsaE isoforms on O 2 reduction at
photosystem I in Arabidopsis thaliana
Anja Krieger-Liszkay, Ginga Shimakawa, Pierre Sétif
To cite this version:
Anja Krieger-Liszkay, Ginga Shimakawa, Pierre Sétif. Role of the two PsaE isoforms on O 2 reduction at photosystem I in Arabidopsis thaliana. Biochimica biophysica acta (BBA) - Bioenergetics, Elsevier, 2019, �10.1016/j.bbabio.2019.148089�. �hal-02397843�
1
Role of the two PsaE isoforms on O2 reduction at photosystem I in Arabidopsis thaliana
Anja Krieger-Liszkay,*, Ginga Shimakawa, Pierre Sétif
Institute for Integrative Biology of the Cell (I2BC), CEA, CNRS, Univ Paris-Sud, Université Paris-Saclay, 91198, Gif-sur-Yvette cedex, France
*Author for correspondence: Anja Krieger-Liszkay; e-mail anja.krieger-liszkay@cea.fr
Keywords: photosystem I, oxygen reduction, photoperiod, photosynthetic electron transport
High lights
- Plants grown in short day generate more ROS at photosystem I than in long day - The subunit PsaE2 of photosystem I facilitates the reduction of oxygen
- Reduction of oxygen at PSI lowers the susceptibility of PSII to photoinhibition
Abbreviations
EPR, electron spin resonance; DCMU, 3-(3,4-dichlorophenyl)-1,1-dimethylurea; DCPIP, 2,6-Dichlorophenolindophenol; DBMIB, 2,5-dibromo-3-methyl-6-isopropylbenzoquinone; (FA, FB), terminal acceptors of PSI; LD, long day conditions; NPQ, non-photochemical quenching; P700, primary electron donor in PSI; PS, photosystem; ROS, reactive oxygen species; SD, short day conditions
2
Abstract
Leaves of Arabidopsis thaliana plants grown in short days (8 h light) generate more reactive oxygen species in the light than leaves of plants grown in long days (16 h light). The importance of the two PsaE isoforms of photosystem I, PsaE1 and PsaE2, for O2 reduction was studied in plants grown under these different growth regimes. In short day conditions a mutant affected in the amount of PsaE1 (psae1-1) reduced more efficiently O2 than a mutant lacking PsaE2 (psae2-1) as shown by spin trapping EPR spectroscopy on leaves and by following the kinetics of P700+ reduction in isolated photosystem I. In short day conditions higher O2 reduction protected photosystem II against photoinhibition in psae1-1. In contrast in long day conditions the presence of PsaE1 was clearly beneficial for photosynthetic electron transport and for the stability of the photosynthetic apparatus under photoinhibitory conditions. We conclude that the two PsaE isoforms have distinct functions and we propose that O2 reduction at photosystem I is beneficial for the plant under certain environmental conditions.
3
1. Introduction
Life in an oxygenic atmosphere unavoidably leads to the production of reactive oxygen species (ROS) during normal cell metabolism and increasingly under stress. Plants are especially susceptible to oxidative stress, because ROS are formed during photosynthetic electron transport in the light in addition to other sources. When plants are exposed to higher light intensities than that needed for saturation of photosynthetic electron transport, the yield of light-induced ROS formation increases. Plants have different strategies to cope with high light intensities such as non-photochemical quenching and downregulation of photosynthetic electron transport by photosynthetic control, both activated by a low pH value in the thylakoid lumen [1,2]. The superoxide anion radical (O2•-) is mainly generated at the acceptor side of photosystem I (PSI), the so-called Mehler reaction [3,4]. In the presence of a high proton gradient, the yield of O2•- production is also lowered, since the linear electron transport is slowed down [5]. Despite these protection mechanisms, a certain amount of ROS is always generated in the light by photosynthetic electron transfer reactions and plays an important physiological role that allows plants to adapt to changes in their environment [6-8]. O2 •-production at the level of PSI has been reported to be higher in leaves and in isolated thylakoid membranes from Arabidopsis thaliana and Nicotiana tabacum plants grown under short day conditions (SD; 8 h light, 16 h dark) compared with plants grown under long day conditions (LD; 16 h light, 8 h dark) [5,9]. This difference in O2•- production at the level of PSI could not be explained by a difference in the size of proton gradient. The differences in PSI protein composition in SD and LD plants leading to different yields of light-induced ROS generation remain to be identified.
PSI is a multisubunit complex (for recent X-ray structure of plant PSI, see [10,11]). The electron transfer chain in PSI consists of the cofactors P700, A0, (both chlorophyll molecules), A1 (phylloquinone) and the 4Fe-4S clusters Fx, FA and FB [12]. O2•- is thought to be mainly generated by electron donation from the reduced (FA, FB) or, when they are reduced, from phylloquinone to O2 [13,14]. An increase in the lifetime of the reduced terminal acceptors (FA, FB) is expected to increase the generation of O2•-. The extrinsic protein
4
subunit PsaE together with PsaC and PsaD forms the docking site of ferredoxin at the acceptor side of PSI [15-17]. Deletion of the psaE gene in the cyanobacterium Synechocystis sp PCC 6803 leads to more O2 reduction than observed for the wild type [18].
In A. thaliana the subunit PsaE is encoded by two genes, PSAE1 and PSAE2. The
PSAE1 transcript is about three times more abundant than the PSAE2 transcript under
standard growth conditions [19,20]. A mutant affected in the amount of PsaE1, named
psae1-1, has been first identified by Varotto and coworkers [19]. This mutant had stunted growth,
was pale, suffered from enhanced PSII photoinhibition and showed a lower level of P700 oxidation under steady-state conditions. Furthermore, it has been reported that in psae1-1 a fraction of LHCII was stably associated with PSI and that state transitions were suppressed [21]. In contrast, a mutant, psae2-1, lacking the isoform PsaE2, showed similar PSI redox kinetics like the wild type [22]. Plants lacking PsaE1 have been shown to have a higher NPQ than the wild type [19,23], and a higher efficiency of cyclic electron flow has been suggested to take place in psae1-3 [23], a knockout mutant of PsaE1 [22].
Here, we address the question whether the two isoforms PsaE1 and PsaE2 have different functions in respect to the partition between linear electron flow and Mehler reaction, thereby allowing the plant to adapt better to different light regimes. We used the previously published mutant psae1-1 [19] that shows a less severe phenotype than the knockout mutant psae1-3 [22], and psae2-1 [22]. Mutants affected in one of the PsaE isoforms were grown in SD and LD conditions and photosynthetic electron transport was measured by chlorophyll fluorescence and P700 absorption kinetics. ROS generation was followed using spin trapping EPR spectroscopy.
2. Materials and Methods
2.1. Material
Arabidopsis thaliana wild type, psae1-1 and psae2-1 plants were grown for 7 weeks in soil.
After sowing they were stratified for three days at 4°C and then transferred to short day conditions until day 14, planted in single pots and kept for 5 weeks either under short day
5
conditions (8 h continuous white light - 160 µmol quanta m-2 s-1, 21°C/16 h dark, 18°C) or long day conditions (16 h continuous white light - 160 µmol quanta m-2 s-1, 21°C /8 h dark, 18°C).
2.2. Photosystem I preparation
Leaves were grinded in 0.33 M sorbitol, 60 mM KCl, 10 mM EDTA, 1 mM MgCl2, 25 mM MES pH 6.1. After centrifugation, the pellet was first washed with 0.33 M sorbitol, 60 mM KCl, 10 mM EDTA, 1 mM MgCl2, 10 mM HEPES pH 7.5, then resuspended in 5 mM MgCl2, 10 mM HEPES pH 7.5 to break all intact chloroplast. After centrifugation, the pellet was resuspended in 0.3 M sucrose, 5 mM MgCl2, 10 mM HEPES pH 7.5 so as to have a final concentration of 1 mg of chlorophyll per ml. All centrifugations were performed at 5,000 g for 5 min at 4°C. Solubilization buffer (10 mM HEPES pH 7.5) containing 1.2 % beta-dodecyl maltoside (β-DM) was added (final chlorophyll concentration: 0.5 mg ml-1, β-DM: 0.6%). The sample was mixed for 1 min, followed by centrifugation to remove non-solubilized membranes. Then the supernatant was loaded on sucrose gradients (0.1-1 M sucrose, 10 mM HEPES pH 7.5, 0.03 % β-DM) and centrifuged for 145 min at 57 000 rpm using a fixed angle rotor (70.1 Ti). The lower band containing PSI was collected, frozen in liquid nitrogen and stored at -80°C.
2.3. Immunoblots
Thylakoid membranes were used for analysis by SDS-PAGE (12% acrylamide) and immunoblotting. Proteins were blotted onto nitrocellulose membrane. Labelling of the membranes with anti-PsaA and anti PsaE (Agrisera, Vännäs, Sweden) was carried out at room temperature in 1x TBS (50 mM Tris-HCl pH 7.6, 150 mM NaCl), 0.1% Tween 20 and 1% non-fat powder milk). After washing, bound antibodies were revealed with a peroxidase-linked secondary anti-rabbit antibody (Agrisera, Vännäs, Sweden) and visualized by enhanced chemiluminescence.
6
2.4. Chlorophyll fluorescence and P700 absorption
Chlorophyll fluorescence was measured on whole plants of Arabidopsis wild type, psae1-1 and psae2-1 with an imaging system (Imaging-PAM; Walz, Effeltrich, Germany). Prior to the measurements plants were dark-adapted for 5 min to obtain Fo and the maximum fluorescence (Fm). 5 min dark adaptation was sufficient to obtain correct Fo levels for plants that had been exposed prior to the measurement to 160 µmol quanta m-2 s-1. Variable fluorescence (Fv) is defined as Fm − Fo. The electron transport rate (ETR) was measured from the fluorescence parameters and calculated according to ETR=0.5 x Y(II) x light intensity x 0.84 (in µequivalents m-2 s-1). The PSII quantum yield, Y(II), is defined as (Fm’ − F)/Fm’ with F being the fluorescence in actinic light and Fm’ the maximum fluorescence obtained under illumination.
The redox state of P700 was monitored by following differences of the 875 nm and 830 nm transmittance signals using a DUAL-PAM-100 (Walz, Effeltrich, Germany). Prior to the measurements, the plants were kept in the light in the growth chamber so that the Calvin-Benson cycle enzymes were active. To determine quantum yields of PSI donor (Y(ND)) and acceptor side-limitations (Y(NA)) saturating pulse analysis was used [24]. After the determination of maximal P700 oxidation the leaf was illuminated stepwise at increasing light intensities from 10 to 633 µmol photons m-2 s-1. A saturating pulse was applied at the end of each light step for determination of P700 Y(NA),Y(ND) and ETR. Each actinic light intensity was applied for 180s before determining ETR, Y(ND) and Y(NA).
2.5 Photoinhibition treatment
Photosystem II photoinhibition. Leaves were first kept at low light (10 µmol quanta m-2 s-1)
for 1 h with the petioles in lincomycin solution (1 g l-1). The leaves were then placed on wet filter paper soaked with lincomycin (1 g l-1) and illuminated with white light (270 µmol quanta m-2s-1) for up to 3 h. The temperature of the illuminated leaves was 28°C. Prior to Fv/Fm determination, leaves were dark-adapted for 15 min to allow relaxation of non-photochemical quenching.
7
2.6 In vitro flash absorption spectroscopy
P700+ decay kinetics following a single turnover saturating laser flash was measured at 800 nm in PSI preparations as previously described [25]. Measurements were made in Tricine 20 mM pH 8, in the presence of 125 mM sucrose, 5 mM MgCl2, 30 mM NaCl, 0.5 mM ascorbate and 5 µM DCPIP. The P700+ decay kinetics were nicely fitted with two exponential components, from which the rates kr and ke of recombination and electron escape from the terminal electron acceptor (FA, FB)- were determined as explained in Mignée et al. (2017). In the case of single electron turnover, i.e. without accumulation of reduced acceptors, escape to O2 notably occurs mostly if not exclusively from (FA, FB)- as shown by the fact that binding of an inactive gallium-substituted Fd to PSI greatly inhibits electron escape [25].
2.7 Room-Temperature Spin-Trapping EPR Measurements
Spin-trapping assays were carried out using the spin trap 4-pyridyl-1-oxide-N-tert-butylnitrone (4-POBN) (Sigma-Aldrich). Leaves were vacuum-infiltrated with buffer (25 mM HEPES, pH 7.5, 5 mM MgCl2, 0.3 M sorbitol) containing the spin trap reagents (50 mM 4-POBN, 4% ethanol, 50 µM Fe-EDTA). Infiltrated leaves were placed into the buffer containing the spin trap reagents and illuminated for 30 min with white light (160 µmol quanta m-2 s-1). Incubation with the spin trap assay had no effect on photosynthetic parameters compared with infiltration with water. At the end of the illumination time, the leaves were removed and the EPR signal of the solution was monitored. EPR spectra were recorded at room temperature in a standard quartz flat cell using an ESP-300 X-band (9.73 GHz) spectrometer (Bruker, Rheinstetten, Germany). The signals were normalized to the fresh weight. The following parameters were used: microwave frequency 9.73 GHz, modulation frequency 100 kHz, modulation amplitude: 1G, microwave power: 6.3 milliwatt, receiver gain: 2x10⁴, time constant: 40.96 ms; number of scans: 4.
8
3. Results
Wild type, psae1-1 (hereafter called ΔE1) and psae2-1 (hereafter called ΔE2) show significant differences when grown in short day conditions (SD) or in long day conditions (LD). In SD conditions, all genotypes are smaller and paler (Fig. 1). In both light regimes
psae1-1 is smaller than the two other genotypes and it remains pale under LD conditions. The
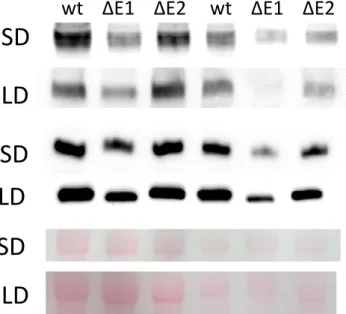
retarded growth has been described previously [19]. Immunoblot using specific antibodies directed against PsaE and PsaA showed that in isolated thylakoids the level of PsaE and PsaA were strongly reduced in ΔE1 compared to ΔE2 and wild type when plants were grown under both light regimes (Fig. 2). These data are in agreement with Varotto et al. [19].
Light-induced ROS generation was detected in leaves of wild type, psae1-1 and
psae2-1 using a spin trapping assay (Fig. 3). The production of •OH derived from O2
•-/H2O2 can be demonstrated by infiltrating leaves with the spin trap α-(4-pyridyl-1-oxide)-N-tert-bytylnitrone (4-POBN) [5]. The spin trapping assay depends on the presence of FeEDTA as catalyst of the Haber-Weiss reaction, and on light allowing photosynthetic electron transport. Only small background signals are detected in the presence of DCMU, an inhibitor that binds to the QB-binding pocket at PSII, or of DBMIB, an inhibitor of the cytochrome b6f complex.
Also no adduct is detected in the presence of SOD. These observations demonstrate that the spin trapping assay reacts with O2•-/H2O2 and that the O2•- originates from the reduction of O2 at PSI [5]. Fig. 3 shows that the EPR signal size is two times bigger when plants were grown in short day conditions (SD) than in long day conditions (LD) in case of ΔE1 and wild type in agreement with previous published data on Nicotiana tabacum and A. thaliana [5,9]. In contrast, ΔE2 showed no difference in ROS generation when grown in the two light regimes. This indicates that the two isoforms of PsaE might fulfill different functions in PSI.
Flash-induced absorption was used to characterize the properties of PSI in SD and LD ΔE1 and ΔE2. We studied in isolated PSI the P700+
decay following charge recombination in the presence of a slow exogenous electron donor. These measurements were done at 800 nm, where only P700+ contributes to absorption, on a slow time scale. A biphasic decay is observed (Fig. 4), which can be almost perfectly fitted (see red curve and residuals) with 2
9
exponential components. As previously described [25], this behavior is fully consistent with a simple kinetic scheme, where P700+ decays by recombination with (FA, FB)- (rate kr) and slow reduction by the exogenous donor DCPIPH2 (rate kdon.) and where (FA, FB)- decays by recombination with P700+ and by electron escape to oxygen (rate ke). The competition between recombination and escape results in a biphasic P700+ decay where the amplitudes of the fast and slow phases are proportional to kr and ke, respectively. Moreover, whereas the slow phase is due to reduction of P700+ by DCPIPH2 (kslow = kdon.), the rate of the fast component is the sum of 3 rates which are the charge recombination rate, the electron escape rate and the rate of slow donation by DCPIPH2 (kfast = kr + ke + kdon.). Getting kslow, kfast and the ratio of amplitudes of fast and slow phases, allows the 3 rates kr, ke and kdon. to be calculated.
In ΔE1 SD the escape rate ke is about 11 s-1 while it is about 6 s-1 in ΔE2 (Fig. 4). This is in agreement with a two times higher amount of O2
production in ΔE1 SD leaves compared with ΔE2 SD leaves (Fig. 3). The escape rate ke was about 7 s-1
for wild type SD, a value which is closer to the one observed for ΔE1 than ΔE2. In agreement, the amount of O2 •-production was comparable between wild type and ΔE1. The rate of charge recombination (kr) was slightly higher in ΔE2 than in ΔE1. kr of wild type was in between the values obtained for ΔE1 than ΔE2. In PSI preparations from LD plants, a smaller difference in kr and ke was observed between ΔE1, wild type and ΔE2. Compared with SD, kr increased slightly in ΔE1 and remained the same in ΔE2 while ke decreased from 11 s-1 to 10.0 s-1 in ΔE1 and increased from 6 s-1 to 8 s-1 in ΔE2. The rather similar ke values for both mutants and wild type in LD are in agreement with the ROS measurements on leaves which showed a similar level of ROS production in LD for all genotypes (Fig. 3).
To characterize the effect of the two growth photoperiods on photosynthetic electron transport in the two mutants, electron transport rates were determined using chlorophyll fluorescence (Fig. 5). Under both growth light regimes the apparent electron transport rate was lower in ΔE1 than in ΔE2 in agreement to previous work [19,22]. However, there is a clear difference between ΔE1 and ΔE2 grown in SD and LD. In ΔE1 the apparent electron
10
transport rates were higher in SD plants than in LD plants while the opposite was observed in ΔE2. Similar electron transport rates were observed in ΔE2 and wild type. We addressed the question whether PSI is affected differently in SD and LD plants in the two mutants by using the saturation pulse analysis to determine the PSI quantum yield at different light intensities. The PSI quantum yield depends on both, electron donation to P700+ and the amount of electron acceptors available to accept electrons from (FA, FB)-. Under both growth light regimes ΔE2 showed a higher donor side limitation than ΔE1 (Fig. 6, left panels). Under SD conditions Y(ND) was even a bit higher than under LD conditions, while there was no significant difference observed for ΔE1. In contrast, ΔE1 showed a significantly higher acceptor side limitation that ΔE2 under both light regimes (Fig. 6, right panels). When grown in SD, the difference in Y(NA) between ΔE1 and ΔE2 was even more pronounced. The higher acceptor side limitation in ΔE1 can be explained by the low amount of PSI found in this mutant (Fig. 2).
Limitation of electron transport in high light intensities is expected to trigger PSII photoinhibition since the reduction state of the plastoquinone pool is high under such conditions. PSII of wild type SD plants shows higher susceptibility to PSII photoinhibition than LD plants [5]. To investigate the susceptibility of ΔE1 and ΔE2 to photoinhibition, leaves infiltrated with lincomycin to block D1 synthesis and thereby PSII repair were subjected to high light for several hours. Fig. 7 shows the loss of the maximal quantum yield of PSII (Fv/Fm). ΔE2 showed the same differences in the extent of photoinhibition between SD and LD as the wild-type plants, with SD plants suffering more than LD plants. Similar differences in the susceptibility to photoinhibition between SD and LD plants have been reported previously for tobacco [5]. However, the opposite was found for ΔE1. In SD ΔE1 plants, PSII was more stable than in LD ΔE1.
11
Here we analyzed whether the two isoforms of the PSI subunit PsaE have different or redundant functions. We addressed this by using two mutants that lack either PsaE1 or PsaE2. Because PsaE1 and PsaE2 are present at different levels in wild-type PSI these lines also displayed different total PsaE levels (Fig. 2), such that differences between the two mutant lines could be either due to the different functions of PsaE1 and PsaE2 or just because of the difference in total PsaE amounts. Indeed, having with WT a control with maximum PsaE levels in hand, one would expect to have a dosage effect for the measured phenotypes in the descending order WT, ΔE2 and ΔE1, if the two PsaE isoforms would have identical functions and therefore only the total amount of PsaE1 and E2 was of relevance. This is clearly not the case as shown by the different response of the two mutant lines to the growth conditions as observed in O2 reduction (Figs 3, 4) electron transport parameters (Figs 5, 6) and their susceptibility to photoinhibition (Fig. 7), allowing to conclude that PsaE1 and PsaE2 have different functions.
According to the immunoblots shown in Fig. 2, a decrease in the amount of PsaE is correlated with a decrease in PsaA, indicating that all PSI reaction centers contain PsaE and that no PSI reaction centers without PsaE1 do exist. This observation is in agreement with Varotto et al. [19] who showed a concomitant decrease in the abundance of PSI-C and -D in ΔE1 and ΔE2 (psae1-1 and -2). The authors concluded that complete absence of PsaE is incompatible with PSI accumulation and photoautotrophic growth in A. thaliana. However, Ihnatowicz et al. [22] found in psae1-3, a mutant that contains less PsaE than ΔE1, and in the double mutant psae1-3 psa2-1, that lost all PsaE, no difference in the content of the PSI reaction center subunits (PsaA and PsaB) compared to the wild type. They suggested that the two PsaE isoforms are very likely functionally redundant and that differences in
12
phenotypes of the corresponding mutants are due to different expression levels and consequently protein concentrations of PsaE rather than to different functions of the two isoforms. It is known that other proteins of the photosynthetic apparatus such as the two isoforms of PsaD and of plastocyanin have redundant functions [30, 32]. However, according to our data shown in Fig. 2 and the results published by Varotto et al. [19] on ΔE1, we conclude that PSI is only stable in the presence of PsaE1 or PsaE2, respectively, and that the two isoforms have distinct functions. The higher capacity of PSI-E2 may be beneficial for photosynthetic electron transport and the generation of a proton gradient under SD conditions.
Mutants expressing only one of the two isoforms of PsaE show clear differences in electron transport to O2 as seen by spin trapping EPR in leaves and by P700+ decay kinetics obtained in isolated PSI (Figs 3 and 4). The presence of the isoform PsaE1 prevents partially the reduction of O2 at the acceptor side of PSI in SD conditions. The reduction of O2 seems to be beneficial under SD conditions as shown by an increase in the apparent electron transport rates in ΔE1 in SD measured in leaves by chlorophyll fluorescence (Fig. 5). In SD the absence of PsaE1, the higher rate of O2 reduction and the high non-photochemical quenching (NPQ) protect ΔE1 against PSII photoinhibition while ΔE2 is more susceptible (Fig. 7). The Mehler reaction keeps the plastoquinone pool oxidized as seen by the low level of donor side limitation of electron transport to PSI in ΔE1 compared with ΔE2 (Fig. 6). In ΔE1 SD a larger NPQ is observed compared with LD, especially at lower light intensities (up to 200 µmol quanta m-2 s-1; supplementary material, Fig. S1). This is most likely caused by an increase in the proton gradient generated when the electron flow to O2 is high. A higher proton gradient in SD than in LD has been shown previously in thylakoids from wild-type plants [5]. In ΔE2, like in wild type, NPQ is lower than in ΔE1 and almost the same in the two growth conditions (supplementary material, Fig. S1). The higher susceptibility of ΔE2 SD to PSII photoinhibition may be due to lower NPQ and a high reduction state of the plastoquinone
13
pool. When the plastoquinone pool is highly reduced, the probability of charge recombination reactions within PSII increases leading to the generation of the triplet state of chlorophyll and of singlet oxygen inside the PSII reaction center [26]. An increased level of singlet oxygen has been shown to damage PSII and to provoke degradation of the D1 protein [27].
Superoxide generation by photosynthetic electron transport has previously been shown to increase in leaves and isolated thylakoid membranes in wild-type A. thaliana and N.
tabacum when the photoperiod was shortened from 16 h light to 8 h light [5,9]. The
mechanism responsible for this effect is unknown. LD conditions are favorable for assimilation, and the synthesis of soluble sugars is favored over starch synthesis [31]. Under LD conditions the presence of the isoform E1 is clearly beneficial although the escape of electrons to O2 is diminished. In the wild type the majority of PSI contains PsaE1 [19,20], thereby allowing efficient NADP+ reduction and assimilation. However, the presence of PsaE2 in approximately 1/3 of the reaction centers in the wild type according to gene expression levels [19] allows still an efficient Mehler reaction (Figs. 3 and 4) which may be beneficial under certain environmental conditions when CO2 assimilation is limited. Superoxide production is not per se damaging for the photosynthetic apparatus. No negative side effect of an increased yield of superoxide production was seen on PSII or PSI stability.
Differences in ROS generation between thylakoids isolated from SD and LD wild-type plants were abolished in a mutant affected in the NADPH-dependent thioredoxin reductase (NTRC) [9]. As shown here, the presence of PsaE2 at PSI facilitates the reduction of O2; however the difference in O2 reduction in SD and LD persisted in ΔE1. This observation shows that there must exist an additional level of regulation, most likely a redox regulation, which affects O2 reduction at PSI. Both PsaE isoforms can be excluded as targets for redox regulation, since both isoforms do not contain cysteine residues. Future studies are required to elucidate the mechanism of redox regulation of superoxide generation at PSI.
14
We would like to thank Dario Leister (LMU München) for providing us with seeds of psae1-1 and psae2-1 and Mélanie Januario (Université Paris-Saclay) for performing the photoinhibition experiment. A.K.L., G. S. and P.S. benefit from the support of the LabEx Saclay Plant Sciences-SPS (ANR-10-LABX-0040-SPS) and the French Infrastructure for Integrated Structural Biology (FRISBI) ANR-10-INSB-05. G.S. is supported by a JSPS oversea research fellowship (201860126).
15
References
[1] P. Müller, X.-P. Li, K.K. Niyogi, Non-photochemical quenching. A response to excess light energy, Plant Physiol. 125 (2001) 1558-1566.
[2] C.H. Foyer, J. Neukermans, G. Queval, G. Noctor, J. Harbinson, Photosynthetic control of electron transport and the regulation of gene expression, J. Exp. Bot. 63 (2012) 1637-1661. [3] A.H. Mehler, Studies on reactions of illuminated chloroplasts, Arch. Biochem. Biophys. 33 (1951) 65-77.
[4] K. Asada, K. Kiso, K. Yoshikawa, Univalent reduction of molecular oxygen by spinach chloroplasts on illumination, J. Biol. Chem. 249 (1974) 2175-2181.
[5] L. Michelet, A. Krieger-Liszkay, Reactive oxygen intermediates produced by
photosynthetic electron transport are enhanced in short-day grown plants, Biochim. Biophys. Acta Bioenerg. 1817 (2012) 1306-1313.
[6] C. Gläßer, G. Haberer, I. Finkemeier, T. Pfannschmidt, T. Kleine, D. Leister, K.-J. Dietz, R.E. Häusler, B. Grimm, K.F.X. Mayer, Meta-analysis of retrograde signaling in Arabidopsis
thaliana reveals a core module of genes embedded in complex cellular signaling networks,
Mol. Plant 7 (2014) 1167-1190.
[7] K.X. Chan, S.Y. Phua, P. Crisp, R. McQuinn, B.J. Pogson, Learning the languages of the chloroplast: Retrograde signaling and beyond, Annu. Rev. Plant Biol. 67 (2016) 25-53. [8] K.-J. Dietz, I. Turkan, A. Krieger-Liszkay, Redox- and reactive oxygen species-dependent signaling into and out of the photosynthesizing chloroplast, Plant Physiol. 171 (2016) 1541-1550.
[9] A. Lepistö, E. Pakula, J. Toivola, E. Rintamäki, A. Krieger-Liszkay, F. Vignols, Deletion of chloroplast NADPH-dependent thioredoxin reductase results in inability to regulate starch
16
synthesis and causes stunted growth under short-day photoperiods, J. Exp. Bot. 64 (2013) 3843-3854.
[10] Y. Mazor, A. Borovikova, I. Caspy, N. Nelson, Structure of the plant photosystem I supercomplex at 2.6 Å resolution, Nat. Plants 3 (2017) 17014.
[11] X. Qin, M. Suga, T. Kuang, J.-R. Shen, Structural basis for energy transfer pathways in the plant PSI-LHCI supercomplex, Science 348 (2015) 989-995.
[12] K. Brettel, W. Leibl, Electron transfer in photosystem I, Biochim. Biophys. Acta Bioenerg. 1507 (2001) 100-114.
[13] M.A. Kozuleva, A.A. Petrova, M.D. Mamedov, A.Y. Semenov, B.N. Ivanov, O2 reduction by photosystem I involves phylloquinone under steady‐state illumination, FEBS Lett. 588 (2014) 4364-4368.
[14] M.A. Kozuleva, B.N. Ivanov, The mechanisms of oxygen reduction in the terminal reducing segment of the chloroplast photosynthetic electron transport chain, Plant Cell Physiol. 57 (2016) 1397-1404.
[15] N. Nelson, C.F. Yocum, Structure and function of photosystems I and II, Annu. Rev. Plant Biol. 57 (2006) 521-565.
[16] I. Caspy, N. Nelson, Structure of the plant photosystem I, Biochem. Soc. Trans. 46 (2018) 285-294.
[17] H. Kubota-Kawai, R. Mutoh, K. Shinmura, P. Sétif, M.M. Nowaczyk, M. Rögner, T. Ikegami, H. Tanaka, G. Kurisu, X-ray structure of an asymmetrical trimeric ferredoxin– photosystem I complex, Nat. Plants 4 (2018) 218-224.
[18] R. Jeanjean, A. Latifi, H.C.P. Matthijs, M. Havaux, The PsaE subunit of photosystem I prevents light-induced formation of reduced oxygen species in the cyanobacterium
17
[19] C. Varotto, P. Pesaresi, J. Meurer, R. Oelmüller, S. Steiner-Lange, F. Salamini, D. Leister, Disruption of the Arabidopsis photosystem I gene psaE1 affects photosynthesis and impairs growth, Plant J. 22 (2000) 115-124.
[20] M. Schmid, T.S. Davison, S.R. Henz, U.J. Pape, M. Demar, M. Vingron, B. Schölkopf, D. Weigel, J.U. Lohmann, A gene expression map of Arabidopsis thaliana development, Nat. Genet. 37 (2005) 501.
[21] P. Pesaresi, C. Lunde, P. Jahns, D. Tarantino, J. Meurer, C. Varotto, R.-D. Hirtz, C. Soave, H. Scheller, F. Salamini, D. Leister, A stable LHCII–PSI aggregate and suppression of photosynthetic state transitions in the psae1-1 mutant of Arabidopsis thaliana, Planta 215 (2002) 940-948.
[22] A. Ihnatowicz, P. Pesaresi, D. Leister, The E subunit of photosystem I is not essential for linear electron flow and photoautotrophic growth in Arabidopsis thaliana, Planta 226 (2007) 889-895.
[23] S. Hald, M. Pribil, D. Leister, P. Gallois, G.N. Johnson, Competition between linear and cyclic electron flow in plants deficient in Photosystem I, Biochim. Biophys. Acta Bioenerg. 1777 (2008) 1173-1183.
[24] C. Klughammer, U. Schreiber, An improved method, using saturating light pulses, for the determination of photosystem I quantum yield via P700+-absorbance changes at 830 nm, Planta 192 (1994) 261-268.
[25] C. Mignée, R. Mutoh, A. Krieger-Liszkay, G. Kurisu, P. Sétif, Gallium ferredoxin as a tool to study the effects of ferredoxin binding to photosystem I without ferredoxin reduction, Photosynth. Res. 134 (2017) 251-263.
[26] A.W. Rutherford, A. Krieger-Liszkay, Herbicide-induced oxidative stress in photosystem II, Trends Biochem. Sci. 26 (2001) 648-653.
18
[27] B.B. Fischer, R.I.L. Eggen, A. Trebst, A. Krieger-Liszkay, The glutathione peroxidase homologous gene Gpxh in Chlamydomonas reinhardtii is upregulated by singlet oxygen produced in photosystem II, Planta 223 (2006) 583-590.
[28] G. Shimakawa, C. Miyake, Oxidation of P700 ensures robust photosynthesis, Front. Plant Sci. 9 (2018).
[29] M.A. Schöttler, H. Kirchhoff, E. Weis, The role of plastocyanin in the adjustment of the photosynthetic electron transport to the carbon metabolism in tobacco, Plant Physiol. 136 (2004) 4265-4274.
[30] P. Pesaresi, M. Scharfenberg, M. Weigel, I. Granlund, W.P. Schröder, G. Finazzi, F. Rappaport, S. Masiero, A. Furini, P. Jahns, D. Leister, Mutants, overexpressors, and interactors of Arabidopsis plastocyanin isoforms: Revised roles of plastocyanin in photosynthetic electron flow and thylakoid redox state, Mol. Plant 2 (2009) 236-248.
[31] Y. Gibon, O.E. Bläsing, N. Palacios-Rojas, D. Pankovic, J.H.M. Hendriks, J. Fisahn, M. Höhne, M. Günther, M. Stitt, Adjustment of diurnal starch turnover to short days: depletion of sugar during the night leads to a temporary inhibition of carbohydrate utilization,
accumulation of sugars and post-translational activation of ADP-glucose pyrophosphorylase in the following light period, Plant J. 39 (2004) 847-862.
[32] A. Ihnatowicz, P. Pesaresi, C. Varotto, E. Richly, A. Schneider, P. Jahns, F. Salamini, D. Leister, Mutants for photosystem I subunit D of Arabidopsis thaliana: effects on
photosynthesis, photosystem I stability and expression of nuclear genes for chloroplast functions, Plant J. 37 (2004) 839-852.
19
Figure legends
Figure 1. Phenotypes of the Arabidopsis thaliana wild type (wt), ΔE1 and ΔE2 after
seven weeks grown on soil in two different light regimes.
SD: short day conditions (8 h continuous white light - 160 µmol quanta m-2 s-1, 21°C/16 h dark, 18°C); LD: long day conditions (16 h continuous white light - 160 µmol quanta m-2 s-1, 21°C /8 h dark, 18°C). After sowing they were stratified for three days at 4°C and then transferred to short day conditions until day 14, then planted in single pots and kept for 5 weeks under the indicated light regime.
Figure 2. PsaE and PsaA content in thylakoid membranes isolated from SD and LD
ΔE1, ΔE2 and wt.
Protein composition of the thylakoid membranes from short day or long day grown plants was analyzed by SDS-PAGE and immunoblotting with antibodies raised against PsaA and PsaE. To show that samples were loaded equally, the Ponceau-stained membrane is shown (large subunit of Ribulose-1.5-bisphosphate carboxylase/oxygenase). Numbers below the bands indicate the average intensity of each band from two different blots normalized to the wild type (100%).
Figure 3. Light-induced hydroxyl radical formation in SD and LD leaves.
A: Typical EPR spectra of the 4-POBN/α-hydroxyethyl adduct are shown. After infiltration with the spin trapping assay (50 mM 4-POBN, 50 µM FeEDTA, 4% EtOH in HEPES buffer pH 7.5), leaves were incubated in the same medium for 1 h at 160 µmol quanta m-2s-1 before detection of the radicals in the medium. B: EPR signal size (means ± sd; n = 8) normalized to fresh weight. Significant differences indicates as different letters, P < 0.05 (comparison SD
20
and LD); or *, P <0.05 and **, P<0.1 (comparison between genotypes) according to Student’s t test.
Figure 4. Rates of recombination and electron escape to oxygen measured from P700+
decay kinetics.
Rates kr (recombination, part B) and ke (escape, part C) were measured from P700+ decay kinetics after flash-induced charge separation (mean ± SD, 2 to 4 measurements in each case). Measurements were made at 800 nm on isolated PSI from SD and LD ΔE1 and ΔE2. An example of kinetic data (E1, SD, black curve) and fit with 2 exponential components (red curve) is shown in part A. kdon. is the rate of P700+ reduction by reduced DCPIP. Afast and Aslow are the preexponential factors of the fast and slow components, respectively. The slow component is shown in orange. The residuals are shown in blue after multiplication by 5. kr and ke are determined from the rates of the 2 components and from the ratio of the
preexponential factors. Significant differences indicates as different letters, P < 0.05
(comparison between genotypes); or *, P <0.05 and **, P<0.1 (comparison between SD and LD) according to Student’s t test.
Figure 5. Apparent rate of photosynthetic electron transport in leaves from SD and LD
wt, ΔE1 and ΔE2 in dependence on the light intensity.
Plants were exposed for 180 s to the indicated light intensity before the chlorophyll
fluorescence parameters were determined. Mature leaves were chosen for the measurements. Squares: wt, circles: ΔE1, triangles: ΔE2. Closed symbols: short day plants, open symbols: long day plants (mean ± SD, n=8; 3 biological replicates).
21
Figure 5. Activity of photosystem I (PSI) in leaves from SD and LD wt, ΔE1 and ΔE2 in
dependence on the light intensity.
The redox state of the PSI primary donor P700 was monitored through the changes in absorbance at 830 versus 875 nm. Leaves were kept in the dark for 5 min prior to the
measurements. Following the initial determination of maximal oxidation of P700, actinic light of the indicated intensities was given for 180 s. PSI donor-side limitation Y(ND) and
acceptor-side limitation Y(NA) are based on saturating pulse analyses. Squares: wild type, circles ΔE1, triangles: ΔE2. Closed symbols: short day plants, open symbols: long day plants (mean ± SD, n=8; 3 biological replicates).
Figure 7. Photoinhibition of photosystem II by continuous light in leaves from SD and
LD ΔE1 and ΔE2 in the presence of lincomycin
Effect of high light on chlorophyll fluorescence. Leaves were treated with lincomycin prior to high light exposure and floating for 3 h on lincomycin solution in high light (270 µmol quanta m-2s-1). Squares: wild type, circles ΔE1, triangles: ΔE2. Closed symbols: short day plants, open symbols: long day plants (mean ± SD, n=4).
22
Figure 1
SD
LD
23
anti-PsaA
2.4 µg Chl
wt ΔE1 ΔE2 wt ΔE1 ΔE2
Figure 2
anti-PsaE
1.2 µg Chl
LD
SD
LD
SD
LD
SD
Rubisco L
24 0 25 50 75 100 short day long day wt ΔE1 ΔE2 344 346 348 344 346 348 long day short day E2 E1 wt magnetic field, mT magnetic field, mT
A
B
Figure 3
a
a
b
b
b
**
E P R sig n a l siz e (%)b
*
25 0.0 0.2 1 2 0 1 2
A
kr kek
don. A at 800 nm (x 10 3 ) Time /sk
r+ k
e+ k
don.A
slowA
fast Afast Aslow=Figure 4
2 4 6 8 10 12 14B
k
r /s -1 wt E1 E2 wt E1 E2short day long day
0 2 4 6 8 10 12
C
k
e /s -1 wt E1 E2 wt E1 E226 0 100 200 300 400 500 600 700 0 20 40 60 80 100
light intensity, µmol quanta m-2s-1
el ectron t ran spo rt (µ eq ui val en ts m -2 s -1 ) short day long day 0 100 200 300 400 500 600 700 0 20 40 60 80 100 el ectron t ran spo rt, µ eq ui val en ts m -2 s -1
light intensity, µmol quanta m-2s-1
short day long day 0 100 200 300 400 500 600 700 0 20 40 60 80 100 el ectron t ran spo rt (µ eq ui val en ts m -2 s -1 )
light intensity, µmol quanta m-2s-1
short day long day
ΔE1
ΔE2
Figure 5
wt
27
Figure 6
0 200 400 600 800 0.0 0.2 0.4 0.6 0.8 1.0 0 200 400 600 800 0.0 0.2 0.4 0.6 0.8 1.0long day
ΔE1 ΔE1 ΔE2 ΔE2light intensity, µmol quanta m-2 s-1 light intensity, µmol quanta m-2 s-1
Y (ND ) Y (NA) wt wt 0 200 400 600 800 0.0 0.2 0.4 0.6 0.8 1.0 0 200 400 600 800 0.0 0.2 0.4 0.6 0.8 1.0
short day
ΔE1 ΔE1 ΔE2 ΔE2light intensity, µmol quanta m-2 s-1
Y
(ND
)
Y
(NA)
light intensity, µmol quanta m-2 s-1
wt
28 0 60 120 180 0,4 0,6 0,8 Fv/ Fm time, min 0 60 120 180 0,4 0,6 0,8 time, min Fv/ Fm
Figure 7
ΔE1
ΔE1
ΔE2
ΔE2
short day
long day
34