HAL Id: hal-01451664
https://hal.archives-ouvertes.fr/hal-01451664
Submitted on 1 Feb 2017
HAL is a multi-disciplinary open access
archive for the deposit and dissemination of
sci-entific research documents, whether they are
pub-lished or not. The documents may come from
teaching and research institutions in France or
abroad, or from public or private research centers.
L’archive ouverte pluridisciplinaire HAL, est
destinée au dépôt et à la diffusion de documents
scientifiques de niveau recherche, publiés ou non,
émanant des établissements d’enseignement et de
recherche français ou étrangers, des laboratoires
publics ou privés.
Assessing the Feasibility of Estimating Axon Diameter
using Diffusion Models and Machine Learning
Rutger Fick, Neda Sepasian, Marco Pizzolato, Andrada Ianus, Rachid Deriche
To cite this version:
Rutger Fick, Neda Sepasian, Marco Pizzolato, Andrada Ianus, Rachid Deriche. Assessing the
Feasibil-ity of Estimating Axon Diameter using Diffusion Models and Machine Learning. IEEE International
Symposium on Biomedical Imaging (ISBI), Apr 2017, Melbourne, Australia. �hal-01451664�
Assessing the Feasibility of Estimating Axon Diameter using
Diffusion Models and Machine Learning
Rutger H.J. Fick
1Neda Sepasian
2Marco Pizzolato
1†Andrada Ianus
3,4Rachid Deriche
11
Universit´e Cˆote d’Azur, Inria, France
2
Eindhoven University of Technology, The Netherlands
3
Centre for Medical Image Computing, Department of Computer Science, UCL, London, UK
4Champalimaud Neuroscience Programme, Champalimaud Centre for the Unknown, Lisbon, Portugal
ABSTRACT
Axon diameter estimation has been a focus of the diffu-sion MRI community for the past decade. The main argu-ment has been that while diffusion models always overesti-mate the true axon diameter, their estimation still correlates with changes in true value. Until now, this remains more as a discussion point. The aim of this paper is to clarify this hypothesis using a recently acquired cat spinal cord data set, where the diffusion MRI signal of both a multi-shell and Ax-Caliber acquisition have been registered with the underlying histology values. We find that the axon diameter as estimated by signal models and AxCaliber does not correlate with their true sizes for axon diameters smaller than 3 µm. On the other hand, we also train a random forest machine learning algo-rithm to map signal-based features to histology values of axon diameter and volume fraction. The results show that, in this dataset, this approach leads to a more reliable estimation of physically relevant axon diameters than using sophisticated diffusion models.
Index Terms— Diffusion MRI, Axon Diameter, Vali-dation, Histology, MAP-MRI, 1D-SHORE, AxCaliber, Ma-chine Learning, Random Forest
1. INTRODUCTION
For over twelve years has axon diameter estimation been a subject of interest in the diffusion MRI community [1]. How-ever, recent works suggest that the diffusion signal is not sen-sitive enough to variations in axon diameters within the phys-iological range [2, 3]. We attempt to investigate this claim by using a recent public data set of a cat spinal cord [4], where both high-quality diffusion MRI acquisitions and underlying histology values are registered to the same template.
Our aim is to verify whether histological variations in mean axon diameter correlate with estimates produced by var-ious state-of-the-art diffusion MRI models. We evaluate the
†The author expresses his thanks to Olea Medical and to the
Provence-Alpes-Cˆote d’Azur Regional Council for providing grant and support.
AxCaliber multi-compartment model [5], as well as “apparent axon diameter” estimates by signal models such as Mean Ap-parent Propagator (MAP)-MRI [6] and 1D-Simple Harmonic Oscillator Reconstruction and Estimation (1D-SHORE) [7]. We produce these correlations for both the dataset as a whole and for separate segmentation of the data based on different axon diameter ranges. In this way, we can evaluate for which axon diameter ranges these methods are actually sensitive.
We also evaluate a machine learning approach to axon di-ameter estimation [8], where we use a random forest algo-rithm to learn a direct mapping between signal-based metrics and the underlying histology. As we will show, this algorithm picks up on correlations in the data that allows us to predict not only axon diameter, but also intra-axonal and even myelin volume fractions, using metrics that on their own do not have this interpretation.
2. MATERIALS
We base our experiments on a recent dataset where both Ax-Caliber and multi-shell diffusion MRI acquisitions have been registered to one axial slice of cat spinal cord [4]. The data is 64 × 64 voxels with resolution 0.16 × 0.16 × 0.16 mm3.
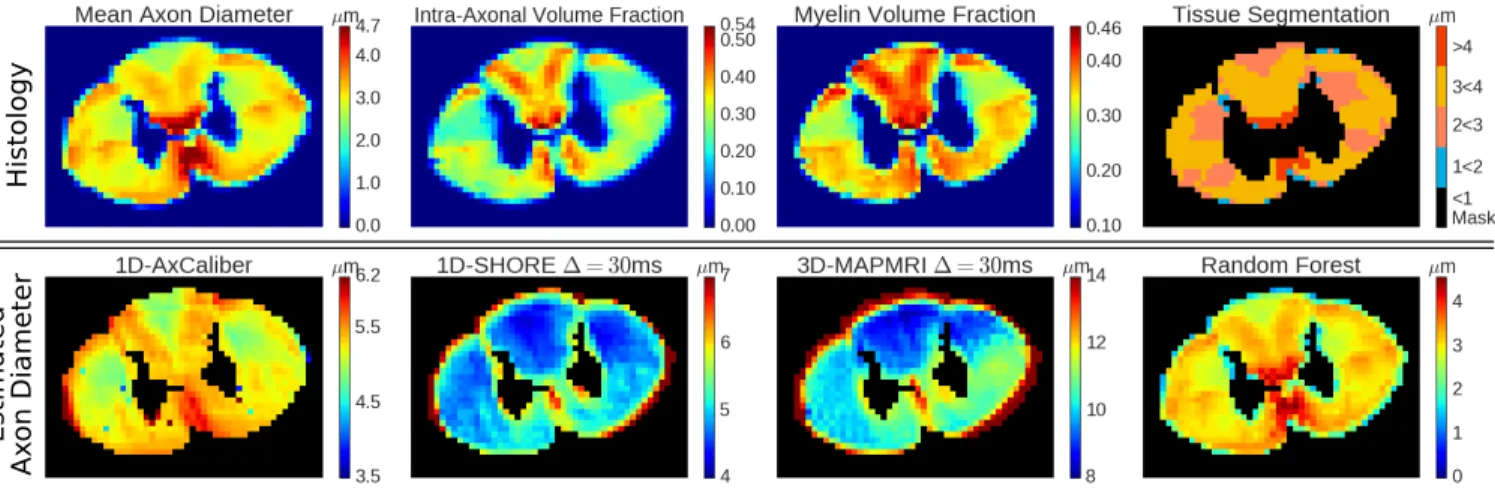
His-tology: For every voxel, the mean axon diameter, restricted volume fraction, and myelin volume fraction is known, see top Fig. 1. We segment the data into 4 ROIs with diam-eters [1 − 2; 2 − 3; 3 − 4; > 4] µm, see top-right Fig. 1. Diffusion MRI: The data was scanned on a Agilent 7T an-imal scanner equipped with 600 mT/m gradients. A single shot EPI sequence was used: BW=250kHz, TR=2s. One Ax-Caliber acquisition was acquired (perpendicular to the axon axis) with parameters δ=3/8/8/8 ms, ∆ = 7/12/25/40 ms, G = [0 .. 849] mT/m (199 increments) and TE minimized (36 - 62ms). The data was TE-normalized by dividing the data for every TE by the G=0 signal. The multi-shell acquisition was acquired with parameters δ=3ms, ∆=30ms, 4 shells with bvalue={40,189,1680,6720}s/mm2, TE=47ms, with a total of 796 diffusion weighted images.
Histology
Estimat
ed
Ax
on Diameter
Fig. 1. Top row, from left to right: Histology values of mean axon diameter, intra-axonal volume fraction, and myelination. The final image shows the masked tissue segmentation based on axon diameter we use in our experiments. Bottom row, the estimated axon diameter using AxCaliber, 1D-SHORE, MAP-MRI and Random Forest using both DTI and MAP-MRI features.
3. AXON DIAMETER ESTIMATION
Diffusion models relate the measured diffusion MRI model to axon diameters by making several assumptions on both the dMRI acquisition and tissue composition. An essential one is modeling axons as an ensemble of parallel cylinders, which is reasonably accurate in our spinal cord data. We compare signal-based and compartment-based approaches, whose par-ticular model assumptions we clarify in this section.
3.1. Axon diameter using signal models
Signal models can relate the diffusion signal to the “apparent axon diameter” (AAD) by calculating the Return-To-Axis probability (RTAP) of the Ensemble Average Propagator (EAP) as AAD = 2/√πRT AP [7, 6]. The EAP P (r) with r the 3D displacement vector is estimated as the Fourier Trans-form (FT) of the measured signal attenuation E(q) with q the 3D q-space vector. The FT is facilitated by representing E(q) with a Fourier basis expansion
ˆ E(q) = Nq X i ciΦi(q) FT ⇐⇒ ˆP (r) = Nq X i ciΨi(r) (1)
with Φ = F T (Ψ) and c the basis coefficients. The AAD is called “apparent” because this interpretation relies on several strong assumptions that the tissue is composed of only intra-axonal space, the gradient pulse length is infinitesimally small (δ ≈ 0), and the diffusion time is long enough for diffusing particles to be restricted.
We estimate the AAD using Laplacian-regularized MAP-MRI [9, 10] on the multi-shell acquisition, and 1D-SHORE [7] on the ∆ = 30ms segment of the AxCaliber one to have the same ∆ between the two. MAP-MRI is the 3D-generalization of 1D-SHORE, so results are expected to be similar.
3.2. Axon diameter using compartment models
Compartment models separate the signal contributions of the intra- and extra-axonal space by fitting a combination of bio-physical models. We consider the AxCaliber model [5] for the AxCaliber acquisition. This model represent the measured signal E(q, ∆, δ) as
E(q, ∆, δ) = f · Eintra(q, ∆, δ) + (1 − f ) · Eextra(q, ∆, δ) (2)
where Eintrais given by the Van Gelderen cylinder model [11]
and Eextraby a Gaussian. We fit AxCaliber with 3 free
param-eters; mean axon diameter hDi, intra-axonal volume fraction f and extra-axonal diffusivity D⊥.
3.3. Axon Diameter using Random Forest Regression
We also include a Random Forest (RF) regression approach to estimate axon diameters from an ensemble of randomly trained decision trees [8]. From the multi-shell acquisi-tion, we use it to learn a mapping between rotationally in-variant signal-based features, derived from DTI [12] and MAP-MRI, to the ground truth histology parameters. For every shell separately we compute the DTI metrics Frac-tional Anisotropy (FA); Mean Diffusivity (MD); parallel and perpendicular diffusivity (Dk and D⊥). Using the
multi-shell data at once we also compute the MAP-MRI metrics Return-to-Origin, Return-to-Axis and Return-to-Plane Prob-ability (RTOP, RTAP, RTPP); overall, parallel and perpen-dicular non-Gaussianity (NG, NGk, NG⊥); and Propagator
Anisotropy (PA). This results in 26 features per voxel. We train the RF regressor, containing 100 trees of max-imum depth 20, on a random selection of 90% of all voxels in the mask and predict the histology parameters on the re-maining 10%. We repeat this process 10 times, predicting a different 10% of the data each time, such that every voxel has
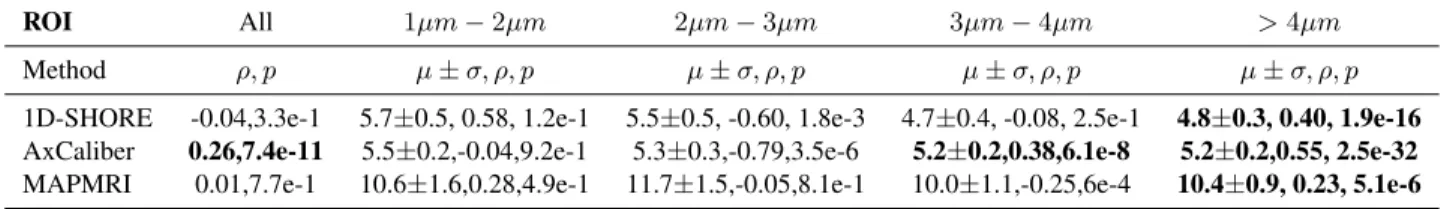
Table 1. Table of the mean (µ) and standard deviation σ of the estimated axon diameters in the tissue segmentation indicated in Figure 1, top-right. We also provide the pearson correlation with the histology diameters (ρ) and the two-tailed p-value (p). When a method’s estimate correlates positively (ρ > 0) and significantly (p < 0.05) with histology the numbers are bold-faced.
ROI All 1µm − 2µm 2µm − 3µm 3µm − 4µm > 4µm
Method ρ, p µ ± σ, ρ, p µ ± σ, ρ, p µ ± σ, ρ, p µ ± σ, ρ, p
1D-SHORE -0.04,3.3e-1 5.7±0.5, 0.58, 1.2e-1 5.5±0.5, -0.60, 1.8e-3 4.7±0.4, -0.08, 2.5e-1 4.8±0.3, 0.40, 1.9e-16
AxCaliber 0.26,7.4e-11 5.5±0.2,-0.04,9.2e-1 5.3±0.3,-0.79,3.5e-6 5.2±0.2,0.38,6.1e-8 5.2±0.2,0.55, 2.5e-32
MAPMRI 0.01,7.7e-1 10.6±1.6,0.28,4.9e-1 11.7±1.5,-0.05,8.1e-1 10.0±1.1,-0.25,6e-4 10.4±0.9, 0.23, 5.1e-6
been predicted. From the fitted RF regressor we also obtain which features were most relevant in the prediction. We use different subsets of signal features in the training to clarify which ones, from which model, are most relevant to histol-ogy parameter prediction.
4. RESULTS
4.1. Correlations of Signal and Compartment Models
We show the predicted axon diameters of AxCaliber, the AAD of 1D-SHORE and MAP-MRI and RF prediction in Fig. 1. As expected, all approaches significantly overestimate the axon diameter compared to their actual values top-left, except for RF. Of the modeling approaches, the AxCaliber result appears to be most similar to histology, showing the same general pattern. On the other hand, AAD estimates from both signal-based models appear quite flat compared to histology. The RF approach is closest to the ground truth.
Taking a closer look at the modeling approaches in Ta-ble 1, we show the mean and standard deviation of the axon diameter estimates within the axon diameter-based tissue seg-mentation in Fig. 1-top-right. We also produce the Pearson correlation (ρ) and the p-value of the diameter estimates ver-sus the histology values. Our aim is to verify if changes in estimated diameter also correlate (ρ > 0) with histological diameter changes in these ranges. When this is so and the re-sults are significant (p-value < 0.05) we boldface the rere-sults. First, considering all ROIs at the same time, we see that only estimates by AxCaliber consistently correlate with axon diameter. Both signal models have a Pearson correlation close to 0, indicating no linear correlation. However, looking at the diameter-segmented results, we notice that none of the mod-els produce axon diameters that correlate positively with his-tology when axons are smaller than 3µm. Though, it can be seen that AxCaliber correlates positively for axons larger than 3µm, and even signal model estimates correlate well with axon larger than 4µm.
4.2. Histology prediction through Machine Learning
In Table 2 we show that we can use RF regression to not only predict histology-based axon diameter, but also restricted
vol-ume fraction and even myelin volvol-ume fraction. Note here that the RF algorithm only picks up on correlations between the input signal features and the output histology parameters. This is emphasized by the observation that we use signal mod-els to predict myelination, despite the fact that myelin has no diffusion signal contribution.
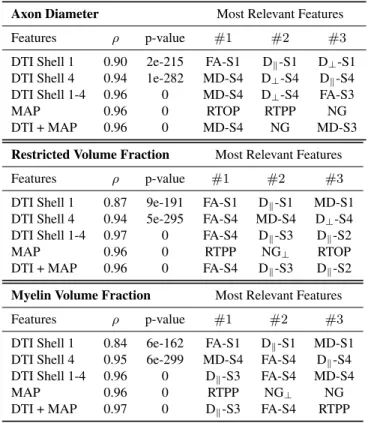
Our experiment evaluates which features, from which models and which shells of the multi-shell acquisition, pro-duce the best prediction of the tissue histology. From top to bottom in Table 2, for every histology metric, we predict histology values using DTI features of 1) only the first shell (b = 41s/mm2); 2) the last shell (b = 6720s/mm2); 3) all
shells combined; 4) only MAP-MRI on all shells; and 5) all DTI and MAP-MRI features combined.
The first thing to notice is that for any feature subset the Pearson correlation is always very high (ρmin = 0.84) with
p-values close to zero. Using only DTI features of shell 1 produces the lowest ρ for all histology parameters, with FA and Dkconsistently the most relevant features. Using only the
DTI features of shell 4 not only raises ρ in all cases, but also changes the ordering of relevant features for every histology parameter. Using the DTI metrics of all shells together raises the correlation to nearly linear with ρ = 0.96 and up. The rel-evant features show that in this case, the DTI-metrics derived from the shells with the highest b-values are the most impor-tant. Using only MAP-MRI features also produces similar nearly linear correlations. Finally, using all features together does not further increase ρ, but the most relevant features do show that MAP-MRI features are never the most important in predicting histology parameters.
5. DISCUSSION AND CONCLUSION
In this work we assessed, using a spinal cord data set with known ground truth histology, whether diffusion model-derived estimates of axon diameter are sensitive to axon diameter changes within the physically relevant range. While the results on this spinal cord data set don’t directly gen-eralize to brain tissue, it does give a good idea about what performance we can expect in similar nervous tissues. The results show that even the most sophisticated dMRI models have trouble in being sensitive to axon diameters smaller than 3µm. This was not previously pointed out by [4]. As we
Table 2. Results of random forest regression algorithm for different subsets of signal features. We show pearson corre-lation (ρ), p-value and the three most relevant features in the prediction for axon diameter, restricted volume fraction and myelin volume fraction.
Axon Diameter Most Relevant Features
Features ρ p-value #1 #2 #3
DTI Shell 1 0.90 2e-215 FA-S1 Dk-S1 D⊥-S1
DTI Shell 4 0.94 1e-282 MD-S4 D⊥-S4 Dk-S4
DTI Shell 1-4 0.96 0 MD-S4 D⊥-S4 FA-S3
MAP 0.96 0 RTOP RTPP NG
DTI + MAP 0.96 0 MD-S4 NG MD-S3
Restricted Volume Fraction Most Relevant Features
Features ρ p-value #1 #2 #3
DTI Shell 1 0.87 9e-191 FA-S1 Dk-S1 MD-S1
DTI Shell 4 0.94 5e-295 FA-S4 MD-S4 D⊥-S4
DTI Shell 1-4 0.97 0 FA-S4 Dk-S3 Dk-S2
MAP 0.96 0 RTPP NG⊥ RTOP
DTI + MAP 0.96 0 FA-S4 Dk-S3 Dk-S2
Myelin Volume Fraction Most Relevant Features
Features ρ p-value #1 #2 #3
DTI Shell 1 0.84 6e-162 FA-S1 Dk-S1 MD-S1
DTI Shell 4 0.95 6e-299 MD-S4 FA-S4 Dk-S4
DTI Shell 1-4 0.96 0 Dk-S3 FA-S4 MD-S4
MAP 0.96 0 RTPP NG⊥ NG
DTI + MAP 0.97 0 Dk-S3 FA-S4 RTPP
showed here, using a machine learning approach like Ran-dom Forest regression can overcome this limitation. Though, machine learning prediction is also limited in that it is hard to generalize to data that was not included in the training set. But similarly, diffusion MRI models also cannot produce accu-rate results in data for which their model assumptions are not met. This is particularly evident in our signal model results using MAP-MRI and 1D-SHORE, who have the strongest tissue assumptions. Their AAD estimates were found to have Pearson correlations close to zero overall in the data, but did correlate positively in voxels with diameters larger than 4µm. Moreover, AxCaliber showed to correlate better with histology for smaller axon diameters compared to the multi-shell techniques. This might also be a consequence of a lower axon diameter resolution limit [3] due to the higher gradient strength available (849 mT/m vs 600 mT/m), not only the model assumptions. Nonetheless, the results clearly show that, in this particular (limited) data set of one slice, the machine learning approach vastly outperformed the modeling approaches in the estimation of histology parameters, which should be considered in future works.
Acknowledgments
This work was partly supported by ANR ”MOSIFAH” un-der ANR-13-MONU-0009-01, the ERC unun-der the European Union’s Horizon 2020 research and innovation program (ERC Advanced Grant agreement No 694665:CoBCoM).
6. REFERENCES
[1] Assaf et al., “New modeling and experimental frame-work to characterize hindered and restricted water dif-fusion in brain white matter,” Mag Res Med, vol. 52, no. 5, pp. 965–978, 2004.
[2] Novikov et al., “Revealing mesoscopic structural uni-versality with diffusion,” PNAS, vol. 111, no. 14, pp. 5088–5093, 2014.
[3] Drobnjak et al., “Pgse, ogse, and sensitivity to axon diameter in diffusion mri: Insight from a simulation study.,” Mag Res Med, vol. 75, no. 2, pp. 688–700, 2016.
[4] Duval et al., “Validation of quantitative mri metrics us-ing full slice histology with automatic axon segmenta-tion,” ISMRM, 2016.
[5] Assaf et al., “Axcaliber: a method for measuring axon diameter distribution from diffusion mri,” Mag Res Med, vol. 59, no. 6, pp. 1347–1354, 2008.
[6] ¨Ozarslan et al., “Mean apparent propagator (map) mri: a novel diffusion imaging method for mapping tissue mi-crostructure,” NeuroImage, vol. 78, pp. 16–32, 2013.
[7] ¨Ozarslan et al., “Nuclear magnetic resonance character-ization of general compartment size distributions,” New J Phys, vol. 13, no. 1, pp. 015010, 2011.
[8] Nedjati-Gilani et al., “Machine learning based com-partment models with permeability for white matter mi-crostructure imaging,” in MICCAI. Springer, 2014, pp. 257–264.
[9] Fick et. al., “Mapl: Tissue microstructure estimation using laplacian-regularized map-mri and its application to hcp data,” NeuroImage, vol. 134, pp. 365–385, 2016.
[10] Garyfallidis et al., “Dipy, a library for the analysis of diffusion mri data,” Frontiers in neuroinformatics, vol. 8, pp. 8, 2014.
[11] Vangelderen et al., “Evaluation of restricted diffusion in cylinders. phosphocreatine in rabbit leg muscle,” J Mag Res, Series B, vol. 103, no. 3, pp. 255–260, 1994.
[12] Basser et al., “Mr diffusion tensor spectroscopy and imaging.,” Biophys J, vol. 66, no. 1, pp. 259, 1994.