Publisher’s version / Version de l'éditeur:
Physical Review A, 57, 4, pp. 2794-2801, 1998-04-01
READ THESE TERMS AND CONDITIONS CAREFULLY BEFORE USING THIS WEBSITE. https://nrc-publications.canada.ca/eng/copyright
Vous avez des questions? Nous pouvons vous aider. Pour communiquer directement avec un auteur, consultez la première page de la revue dans laquelle son article a été publié afin de trouver ses coordonnées. Si vous n’arrivez pas à les repérer, communiquez avec nous à [email protected].
Questions? Contact the NRC Publications Archive team at
[email protected]. If you wish to email the authors directly, please see the first page of the publication for their contact information.
NRC Publications Archive
Archives des publications du CNRC
This publication could be one of several versions: author’s original, accepted manuscript or the publisher’s version. / La version de cette publication peut être l’une des suivantes : la version prépublication de l’auteur, la version acceptée du manuscrit ou la version de l’éditeur.
For the publisher’s version, please access the DOI link below./ Pour consulter la version de l’éditeur, utilisez le lien DOI ci-dessous.
https://doi.org/10.1103/PhysRevA.57.2794
Access and use of this website and the material on it are subject to the Terms and Conditions set forth at
Optical deflection of molecules
Sakai, Hirofumi; Tarasevitch, A.; Danilov, J.; Stapelfeldt, H.; Yip, R. W.;
Ellert, C.; Constant, E.; Corkum, P. B.
https://publications-cnrc.canada.ca/fra/droits
L’accès à ce site Web et l’utilisation de son contenu sont assujettis aux conditions présentées dans le site LISEZ CES CONDITIONS ATTENTIVEMENT AVANT D’UTILISER CE SITE WEB.
NRC Publications Record / Notice d'Archives des publications de CNRC:
https://nrc-publications.canada.ca/eng/view/object/?id=77520014-aae0-4862-ad2b-a5119d812865 https://publications-cnrc.canada.ca/fra/voir/objet/?id=77520014-aae0-4862-ad2b-a5119d812865Optical deflection of molecules
Hirofumi Sakai,1,2A. Tarasevitch,1,3J. Danilov,1,3 H. Stapelfeldt,1,*R. W. Yip,1,4C. Ellert,1E. Constant,1,5
and P. B. Corkum1
1
Steacie Institute for Molecular Sciences, National Research Council of Canada, Ottawa, Ontario, Canada K1A 0R6
2Electrotechnical Laboratory, 1-1-4 Umezono, Tsukuba, Ibaraki 305, Japan 3International Laser Centre, Moscow State University, Moscow, Russia
4De´partement de Chimie, Universite´ du Que´bec a` Montre´al, Montreal, Que´bec, Canada H3C 3P8 5De´partement de Physique, Faculte´ des Sciences, Universite´ de Sherbrooke, Sherbrooke, Que´bec, Canada J1K 2R1
~Received 18 August 1997!
When intense light interacts with a molecule it induces a force proportional to the gradient of the Stark shift. We use this nonresonant force to deflect I2 and CS2molecules. We trace the direction of molecules in a molecular beam, showing that the molecules that pass near the center of a 1.06-mm or 10.6-mm laser beam will focus. We predict that Stark shifts on the order of 50 meV can be obtained for all small molecules and atoms while maintaining ionization rates below 106s21. Among the devices that can be based on the nonresonant
Stark shift are molecular accelerators and molecular quantum wires. @S1050-2947~98!01503-0# PACS number~s!: 42.50.Vk, 33.80.Ps, 51.70.1f
I. INTRODUCTION
Intense laser fields apply forces to molecules that are strong enough to control both the internal and external mo-lecular variables @1–5#. Experimentally, we study the control over the trajectory of a molecule using the force resulting from the gradient of the nonresonant laser-induced Stark shift. This force arises from the gradient of the interaction of the laser-induced dipole moment with the laser field. The potential well depths that we measure are approximately 10 meV deep and we predict potential well depths of 50 meV or more for molecules and atoms at intensities where the ion-ization rate is less than 106 s21. Theoretically, we discuss
characteristics of the new class of molecular devices that can be based on the nonresonant dipole force.
We demonstrate laser-induced forces with both 1.06 mm ~YAG! @6# and 10.6mm (CO2) light interacting with carbon
disulfide (CS2) and iodine (I2) molecules and show that
these light beams can be used as molecular lenses. By choos-ing two wavelengths and two molecules we emphasize the generality of the nonresonant dipole force. On one hand, we have chosen 1.06 mm to direct our thoughts towards future experiments where very small focal spots ('0.5mm) are achieved. As we will discuss in the concluding section, such small focal spots will allow us to control the position of molecules with almost atomic scale precision. For example, we show that such exotic new devices as molecular quantum wires can be constructed. On the other hand, we have chosen 10.6-mm light since the interaction of intense infrared light with small molecules and atoms is especially simple @2,7#. For example, we know that midinfrared light should be the least intrusive strong field source @2# for manipulating a small molecule. With infrared light, ionization, excitation, and dissociation will all be minimized since resonances are unlikely to play a significant role in the multiphoton
ioniza-tion of the molecule and it is well known that small neutral molecules cannot be efficiently vibrationally excited by mid-infrared light @8#. Consequently, the maximum fields that we calculate by approximating multiphoton ionization by tun-neling is appropriate for 10-mm light and may slightly over-estimate the appropriate fields at 1.06mm.
Our experimental approach gives us the opportunity to study the deflection of molecules with precision. We trace the deviation of the molecular trajectories caused by their interaction with either the CO2 or YAG laser field at
differ-ent offsets from the cdiffer-enter of the molecular lens. Thus, the information that we get is analogous to the information ob-tained in optical ray tracing.
This work should be considered in the context of the large international effort in manipulation and control of the posi-tion and velocity of electrons @9#, atoms @10#, and nano or microscopic particles ~optical tweezers! @11,12#. We will show that molecular optics can be developed in direct anal-ogy with atomic optics and our experimental approach to molecular diagnostics based on multiphoton ionization intro-duces a general method for performing molecular optics ex-periments.
II. OVERVIEW OF THE EXPERIMENT
A schematic of the experimental layout is shown in Fig. 1. Iodine or carbon disulfide molecules from a pulsed molecu-lar beam are injected into a vacuum chamber along a direc-tion perpendicular to the flight axis of a time-of-flight mass spectrometer. An intense YAG or CO2 beam, traveling
per-pendicular to both the molecular beam and time-of-flight axis, interacts with the molecular beam. Those molecules that pass through the deflecting beam experience the laser-induced dipole force.
We label those molecules to be measured by placing the deflecting laser beam just upstream of the focus of a femto-second diagnostic laser beam. The femtofemto-second pulse ionizes the molecules producing singly charged molecular ions by nonresonant multiphoton ionization. Due to the highly non-*Present address: Department of Chemistry, Aarhus University,
Langelandsgade 140, DK-8000 Aarhus C, Denmark.
57
linear nature of multiphoton ionization the measurement is confined to the high intensity region @13# of the femtosecond beam. The femtosecond beam is focused to a smaller spot than the deflection beam. With our experimental procedure we have more than 10 resolution elements across the central portion of the focus of the CO2laser.
Only molecules that come from the small nozzle ~diam-eter 250mm! and pass through the small focus of the probe laser 8 cm below the nozzle can be ionized by the colliding-pulse mode-locked ~CPM! colliding-pulse. This ensures that the mol-ecules that are studied initially have a very small velocity in the direction of the time-of-flight axis. Molecules that gain more energy from the deflection beam than the initial trans-verse energy spread are observable through a difference in arrival times of the singly charged molecular ions compared to the arrival time without the deflection beam. By scanning the diagnostic beam with respect to the center of the deflect-ing beam focus, the molecular deflection is measured as a function of the position inside the deflecting beam. Our mea-surement is the molecular analog of ray tracing in optics and we show the molecular beam will focus.
III. EXPERIMENTAL CONSIDERATIONS
A 10-Hz pulsed beam of I2 or CS2 molecules was used directly or was seeded in an argon or neon jet expanding from the initial pressure of 1 atm into the vacuum chamber with the average operating pressure of about 1026 Torr. For
I2, a container filled with solid I2 at room temperature was
placed directly before the pulsed nozzle ~vapor pressure of I2
at room temperature is about 0.3 Torr! while for CS2a partial
gas pressure of 25 Torr was used. The nozzle diameter of the jet was 250mm.
The molecules entered a time-of-flight mass spectrometer with the molecular beam axis ~the x axis! perpendicular to the flight axis ~the y axis!. The molecular velocity is given by @14# vx'
S
2k M g g21 T0D
1/2 , ~1!where k is the Boltzmann constant, M is the mass of the buffer gas atoms,gis the specific heat ratio of the buffer gas,
and T0 is the initial temperature. For Ar at T05300 K, Eq.
~1! predicts vx5560 m/s and for neon it predicts 790 m/s.
For iodine molecules buffered with neon, we measured vx
5800 m/s, in excellent agreement with the prediction. Either a Nd:YAG or a CO2laser beam ~described in Secs.
IV and VI, respectively! intersected the molecular beam ap-proximately 8 cm below the nozzle, exerting a dipole force on those molecules that pass through the focus. The dipole force accelerated the molecules perpendicular to the initial direction. The velocity change was measured by ionizing the molecules and using a time-of-flight mass spectrometer to determine the velocity of the ions. The time-of-flight mass spectrometer consisted of an accelerating region ~approxi-mately 30 V/cm! defined by two plates separated by 3 cm and an equal length field-free drift region. After passage through the field-free region the ions were accelerated to 2 keV. Molecular ions with an initial transverse velocity com-ponent towards the detector arrived at the detector earlier than a zero transverse velocity ion. Similarly, ions with transverse velocity away from the detector arrived later.
The 80-fs duration ionizing pulse originating from a 10-Hz amplified CPM dye laser @15# contained 0.66mJ per pulse and was focused to a spot size of v0;2.5mm
corre-sponding to a peak intensity of 831013 W/cm2. We operated
the laser with just high enough intensity to produce the sin-gly charged molecular ion by nonresonant multiphoton ion-ization. It is possible to use multiphoton ionization to select and label the molecules of interest since ionization does not change the velocity of the molecule significantly @16#. Thus, measuring the ion velocity is equivalent to measuring the neutral molecule velocity. Using multiphoton ionization is important because the multiphoton ionization rate is a highly nonlinear function of the laser intensity so the measurement can be localized in both space and time.
The dye amplifier was pumped with 0.53mm light from a frequency-doubled Nd:YAG laser. The undoubled radiation ~1.06mm! from the same YAG laser was used to deflect the molecules. We introduced a delay between the deflection and the CPM pulse to ensure that the femtosecond ionization occurred without the strong infrared pulse present. This de-lay required the focal spots of the two beams to be offset in the direction of the molecular beam. With this experimental arrangement, the CPM laser could probe the spatial depen-dence of the induced dipole force along direction of the time-of-flight axis simply by moving its focus with respect to the focal volume of the deflection beam. Although the mass spectrometer was designed so that the flight time was insen-sitive to the position where ionization occurred ~space focus-ing!, whenever we moved the relative position of the deflec-tion and probe beams the probe beam was kept fixed so as to keep the measurement conditions constant.
IV. EXPERIMENTAL RESULTS WITH 1.06-mm DEFLECTION BEAM
The 10-Hz Nd:YAG laser (l51.064mm) produced 14-ns @full width at half maximum ~FWHM!# pulses and we used these pulses in the energy range of 10 mJ. Figure 2 shows the experimental arrangement used with the YAG beam. The YAG ~deflection! and dye ~measurement! beams passed through two independent 1-m lenses and were com-bined with a dichroic beam splitter before reaching foci 1 m in front of the vacuum chamber. Here, the focal spot
inten-FIG. 1. Schematic of the experimental arrangement of the target chamber viewed in the direction of the laser beam ~z axis!.
sity distribution of the YAG was measured to be Gaussian and the beams were positioned with respect to each other. The foci in the target chamber were obtained with an f /2, on-axis, 5-cm focal-length parabolic mirror, which produced a 20 times reduced image of the measured focal spots. The YAG beam was focused in the center of the chamber to an
v057mm Gaussian focal spot giving a peak intensity, I0
;931011 W/cm2at 10 mJ. At this intensity the YAG pulse produced some CS2 and I2 ions. These ions arrive at the
detector earlier than the ions produced by the femtosecond pulse since the YAG pulse arrives 25 ns before the femto-second probe pulse. Thus, the peaks are clearly distin-guished.
Since our velocity measurement is restricted to those mol-ecules that pass through the very small focal spot of the CPM laser, in the absence of the deflection pulse, we expect the transverse velocity distribution of the molecular beam to be very narrow. The initial velocity spread along the time-of-flight axis, Dvy
init, is determined by Dv
y
init
5D/(l/vx) where D5250mm is the diameter of the nozzle, l58 cm is the distance from the nozzle to the laser focus, and vx is the
longitudinal velocity of the CS2 or I2 molecules. The
esti-mated velocity spread Dvyinit>1.4 m/s for unbuffered CS2 is
typical. It corresponds to a lateral kinetic energy of approxi-mately 0.2meV. In the experiment the FWHM of the peak is ;3.4 ns, corresponding to a y-axis velocity Dvyinit5
67.2 m/s for CS2 and Dvy
init
563 m/s for I2. This value is
the resolution limit of our time-of-flight spectrometer. Time-of-flight spectra obtained with or without 1.06-mm light at a peak intensity of 131012 W/cm2are shown in Fig.
3 for CS2 molecules. Each spectrum is the average of 1000
shots. The solid curve shows the arrival time for the CS2 molecules without the deflecting YAG laser. The dashed and dotted curves show the arrival times when the molecular beam crosses the deflection beam at approximately 6v0/2.
The dashed ~dotted! curve shows results obtained for mol-ecules deflected towards ~away from! the microchannel plate detector. As indicated in the figure, if the molecule is de-flected away from the detector by the attractive central po-tential it should arrive later than if the molecule is deflected towards the detector. To ensure that the flight time is always the same without the deflection laser present, the focus of the CPM beam is not moved. Instead, we moved the focus of the deflecting laser beam.
The shift of arrival times Dt ~with respect to the unde-flected molecules! measured at the center position of the half maximum of the time-of-flight spectrum is plotted in Fig. 4 as a function of the position of the deflection beam. The results for the deflection of I2 ~expanded in the jet using an argon buffer gas! are shown in Fig. 4~a! and for CS2
~ex-panded in a neon buffer gas! in Fig. 4~b!. In both cases the laser intensity was approximately 1012 W/cm2. The vertical
axes show the change in the arrival time and the correspond-ing transverse velocity Dvy5DteV/mL, acquired in the
de-flecting field. The charge and mass of the molecular ion are denoted by e and m, V is the extracting voltage, and L 53 cm is the separation between the first two plates of the time-of-flight spectrometer. For the measurements in Fig. 3 the V/L was 33 V/cm.
Figure 4~a! shows data, plotted with open and solid circles, obtained on two successive runs indicating the accu-racy of the iodine data. Figure 4~b! contains plots obtained for linear and circular polarization. Experimentally, the l/4 wave plate in the 1.06-mm beam path is rotated without changing the light intensity. The good agreement between the deflection measured with both polarization shows that the molecules do not align.
The experimental results allow us to determine the depth of the potential well produced by the intense laser beam. When a molecule enters the YAG laser focus a dipole mo-ment is induced. The interaction of this dipole and the field results in a Stark shift U of the ground state of the molecule given by @17#
U~ x,y ,z,t !5214aE2~ x,y ,z,t !, ~2!
where E(x,y,z,t) is the space- and time-dependent pulse en-velope of the deflecting laser field. Equation ~2! includes a time average over one period of the laser field and neglects any effect of alignment of the molecule by averaging over all
FIG. 2. Experimental schematic showing the optical arrange-ment used to position the YAG ~deflection! beam and the dye ~mea-surement! beam. The deflection and measurement beams are offset
in both space and time. FIG. 3. Portion of the time of flight spectrum showing the time of arrival of the undeflected beam ~solid curve! and the deflected beams ~dashed and dotted curves!. A schematic shows the relative placement of the focus of the deflecting laser and the measurement laser. Deviations of the arrival time of a zero transverse velocity molecule from the arrival time of a deflected molecule allow the transverse velocity to be measured. The horizontal scale shows both the arrival time and the velocity.
angles @a5(ai12a')/3 where ai anda' are the
polariz-ability parallel and perpendicular to the molecular axis, re-spectively#.
The induced dipole force, F52¹U, exerted on a mol-ecule is proportional to the gradient of the intensity. Using
I(x,y,z,t)5I0exp@22(x21y2)/v02#exp(24ln2t2/t2) ~we probe
near z50!, the y component of the dipole force, Fy, is given
by Fy524 U0 v02 y exp$22@~ vit!21y2#/v02% 3exp
H
24 ln2S
t 2 t2DJ
, ~3!where U0 is the Stark shift at the peak of the laser pulse in
both space and time and x52vitdescribes the motion of the
molecules along the molecular beam direction. For Dvyt
!y, the experimentally observed velocity shift is given by Dny5(1/m)*2` ` Fy(t)dt yielding Dny52 4
A
pU0 &mv0vi 1A
112 ln2@~v0/vi!/t#2 y 3exp~ 22y2/v02!. ~4!Equation ~4! shows that the data points in Fig. 4 should have a dispersionlike shape. In both Figs. 4~a! and 4~b!, the solid line corresponds to the normalized derivative of the spatial intensity profile of the YAG beam. In Fig. 4~b! de-viation of the data points from the dispersion curve are ob-served for molecules deflected away from the microchannel plate detector. This deviation disappears when the deflecting laser intensity is lowered and ionization caused by the YAG beam is absent. We ascribe the deviation to the influence of the charge produced by the deflecting YAG beam. Molecular ions produced by the YAG, although produced 25 ns earlier than those ions produced by the CPM beam, have only moved about a micron during that 25 ns. They have therefore not left the focal volume before the femtosecond pulse probes the deflected molecules. Molecular ions from mol-ecules that are deflected away from the microchannel plate detector ~positive direction! interact with these YAG pro-duced molecular ions much more strongly than molecules deflected toward from the detector.
Equation ~4! can be used to estimate the depth of the Stark potential, U0 based on the experimental measurements
and to compare with the results obtained from Eq. ~2! for I2 and CS2 ~see next section!. Solving Eq. ~4! for U0 at y
5v0/2 ~where the acquired transverse velocity is maximum!
yields U057 meV for CS2and U056.6 meV for I2.
V. ACHIEVABLE MAGNITUDES
OF THE LASER-INDUCED DIPOLE POTENTIAL The polarizabilities of atoms and small molecules are well known. Assuming that the static values @18# can be used at 1.06 mm we expect from Eq. ~2! U0510 meV at I5
931011W/cm2for CS
2and U0512 meV for I2. There are a
number of uncertainties in our experiment. For example, only 1-mm error in measuring v0 of the deflection beam
leads to 25% error in the intensity. In addition, we expect the experiment to underestimate U0 since the spatial resolution
of the measurement is still limited. The measured and calcu-lated values of U0 agree within our experimental accuracy.
Our theoretical estimate of the Stark potential ignores any molecular alignment to the laser field either for CS2or for I2.
However, the alignment potential, given by UA52 1 4(ai
2a')E2exceeds 10 meV for CS2in a 931011-W/cm2laser
field. With an expected rotational temperature of 5 K @19# we should expect an average angular spread of about 30° about the direction of polarization for linearly polarized light @20# and thenai must replaceain Eq. ~2! ~that is, U'2
1 4aiE2!
andai(ai517.3310240C m2/V for CS2!is almost twice a
~a59.6310240C m2/V for CS2!.
Experimentally, we find no difference between the deflec-tion using linear and circular polarizadeflec-tion in Fig. 4~b! indi-cating that alignment does not play a significant role in our experiment, even for rotationally cooled molecules. We be-lieve that the reason that we do not see significant alignment is that the longitudinal mode beating of our non-transform-limited YAG laser pulse gives rise to unobserved temporal
FIG. 4. Change in flight time caused by deflection of the mo-lecular beam by the deflection beam and the associated change in transverse velocity of the molecular beam plotted as a function of the relative position of the focus of the deflecting and the ionizing laser beams. The derivative of the measured focal distribution is also shown by the solid curve. ~a! Data obtained for I2with linear polarized light. The open and filled circles correspond to two suc-cessive scans with realignment. ~b! Data for CS2with the deflection laser polarized linearly, or circularly ~d!. In both cases the expan-sion of the CS2molecules was buffered with neon.
structure on the pulse. This approximately 50-ps structure introduces a fluctuating potential that rotationally heats the molecules.
The potential well that we measure through the nonreso-nant laser-induced dipole force is approximately 4 orders of magnitude larger than the typical potential depths reached in continuous waves studies on atoms ~on the order of 1 meV @10,21#!. Thus to trap molecules with the nonresonant dipole force will require much less cooling than is typical in atomic trapping experiments. The Stark potential is proportional to the laser intensity, so the maximum potential well depth that can be achieved is limited by the maximum achievable in-tensity without ionization @2,7,22,23#. For CS2(I2), with its
ionization potential of 10.1 eV ~9.3 eV!, the tunnel ionization rate equals 106 s21 at an intensity of 831012 W/cm2
(531012W/cm2). Although multiphoton ionization does not
exhibit threshold behavior, the ionization rate is a very non-linear function of the laser intensity and a rate of 106 s21can
be taken as an approximate effective threshold. This rate is particularly appropriate for our 10-ns pulse duration since it corresponds to about only 1% ionization during a 10-ns pulse. For these intensities Eq. ~2! predicts a potential well depth of about ;90 meV for CS2and ;70 meV for I2. The slightly lower ionization potential of iodine molecules is compensated by its higher polarizability and consequently the maximum Stark shift remains about the same. At this laser field strength many molecules should align with the field ~the alignment potential would be approximately 100 meV for CS2!making the total well depth even greater.
In our YAG results we could not achieve this average intensity without ionization for two reasons. First, our Nd:YAG laser produces multilongitudinal mode output, which gives rise to transient spikes of higher peak intensity than would occur for a pulse with a smooth temporal profile. Since multiphoton ionization is highly nonlinear, the high-intensity spikes limit the average high-intensity that can be em-ployed before multiphoton ionization occurs. Second, for 1.06 mm light illuminating I2 or CS2, we do not satisfy the
conditions for tunnel ionization @23# although we have used the tunneling approximation to calculate the maximum field that we can use. Other multiphoton ionization processes @24# raise the ionization rate and therefore lowers the peak inten-sity at which significant ionization is reached. Using 10.6
mm light places us securely in the tunneling limit @7,23#. We now demonstrate that deflection is also observable with a 10-mm deflection field.
VI. EXPERIMENTAL RESULTS WITH 10.6-mm DEFLECTION BEAM
The pulsed 10-Hz CO2 laser consisting of a hybrid TEA CO2oscillator and a double-passed TEA CO2amplifier
pro-duced a 10.6-mm pulse with approximately 50% of the pulse energy of 600 mJ in a 70-ns ~FWHM! gain switched peak. The remaining part of the energy was contained in a long tail that is not used in this experiment. The temporal structure of the pulse was monitored to ensure single longitudinal mode operation using a photon-drag detector.
Because of the high energy of the CO2 pulse it was not
possible to use the same focusing procedure as described above for the YAG laser. Figure 5 shows the experimental
arrangement used with the CO2 deflection beam. The CO2
~deflection! and dye ~measurement! beams were combined using a Ge window ~M 2 in Fig. 5! antireflection coated for l510.6mm and reflective at 0.625mm. The beam diameters were approximately 2 and 1 cm at l510.6mm and l 50.6mm, respectively. Using two diaphragms ~D1 and
D2!, the beams were aligned with an accuracy of about 2–4
mrad along the mirror axis of the 5-cm focal-length, 2.5-cm-diameter ( f /2) parabolic mirror ~M 3 in Fig. 5!, mounted inside the vacuum chamber.
We measured the diameter of the focal spot at l 510.6mm with the CO2 amplifier switched off. For that
measurement the parabolic mirror M 3 was placed outside the vacuum chamber. A 5-mm-thick NaCl window was mounted in front of the mirror at the angle of 45° with re-spect to the incident beam. A 25-mm-diameter pinhole was scanned in the vicinity of the waist of the CO2beam reflected
from the NaCl window. The measured focal spot diameter is about 35 mm ~FWHM!. Thus, we estimate the intensity in the beam waist as 4.531011W/cm2.
We used a reference beam to properly adjust the relative position of the deflection and the probe foci. A wedged (;2 in.) NaCl window ~SP in Fig. 5! reflected approxi-mately 4% of the incident radiation at both wavelengths. Using a 1-m focal-length gold-coated mirror ~M 4 in Fig. 5! the foci of the reflected beams are projected onto the refer-ence plane ~RP in Fig. 5! producing a magnified (320) im-age of the measurement area inside the vacuum chamber. We adjusted the relative position of the beam waists in the jet by tilting the infrared beam (;0.1°) in the vertical direction so that the CO2beam shifted 25mm upstream of the CPM laser focus. In that case it takes the molecules about 75 ns to travel from the center of the deflection beam to the probed volume ~note: argon was used as the buffer gas for these measure-ments!.
Each time-of-flight spectrum was a result of averaging over 250–500 shots. There was no ionization by the CO2
laser pulse. To eliminate the influence of the timing jitter
FIG. 5. Experimental schematic showing the optical arrange-ment used to position the CO2~deflection! beam ~1! and the dye
~measurement! beam ~2!. M 1, M 3, and M 4 are gold-coated mirror.
M1 is flat, M 2 is a germanium plate used as a beam splitter, M 3 is
an f /2 parabolic mirror with focal length of 5 cm while the radius of curvature of M 4 is R52 m. SP is a NaCl window used to reflect a small sample of the beam for alignment purposes. The focal prop-erties of the beam inside of the chamber were imaged of the refer-ence plane RP.
between the CO2and dye pulses, time-of-flight spectra were
only recorded if the two pulses arrived at the proper delay. Figure 6 shows the successive CS21 spectra recorded at
different horizontal positions of the deflecting beam. Just as for CS2molecules deflected by the YAG beam one can see a
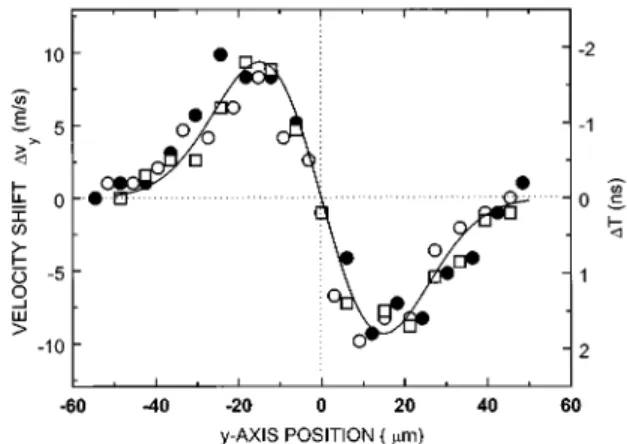
definite shift in the temporal position of the ion spectra. In Fig. 7 we have plotted the temporal shift of the maximum of the time-of-flight spectra and the corresponding Dvy versus
horizontal position of the deflecting beam for three succes-sive scans. The solid line corresponds to the normalized de-rivative of a Gaussian profile withv0530mm. This
magni-tude is in agreement with our estimated beam waist of the infrared beam.
The data in Fig. 7 are more symmetric than those obtained using the YAG laser. We observed no ionization of the CS2
molecules up to 531011W/cm2, the highest intensity that
we could achieve. Consequently, there are no space-charge effects. Moreover, the bigger diameter of the waist of the CO2beam allows higher relative resolution of measurement.
Assuming the Gaussian shape of the curve with v0
530mm we obtain U054 meV from Eq. ~4!. This value can
be compared to a well depth of about 4.5 meV obtained using U521
4aE2@Eq. ~2!# at our estimated operating
inten-sity of 431011W/cm2.
VII. DISCUSSION AND CONCLUSIONS
A. Maximum Stark shifts
We have studied two molecules that have relatively large polarizabilities ~a59.6310240C m2/V for CS2 and a
'12.1310240C m2/V for I
2! and we have noted that the
maximum Stark shift that can be achieved for I2 and CS2
should be approximately the same. In general, any neutral atom or small molecule has approximately the same maxi-mum Stark shift although the polarizability can vary greatly. This is because, as the molecular polarizability decreases, the ionization potential increases and the increase in the maxi-mum intensity that the molecule can withstand @2,22# roughly compensates for the decreasing polarizability. For example, we predict that H2, a very unpolarizable molecule, can experience a 50-meV Stark shift at an intensity @2,22# where the tunnel ionization rate reaches our reference value of 106 s21. Even helium, a very unpolarizable atom and
Cs, a very polarizable atom can support a maximum Stark
shift of approximately 30 meV at the intensity where their ionization rates approach 106 ~for He this intensity is
2.631014W/cm2 and for Cs, 3.531011 W/cm2!. Therefore,
the deflection that we have demonstrated above, and the con-sequences discussed below, are very general.
B. Focusing of molecules
In addition to showing control over the external variables of a molecule through the nonresonant laser-induced dipole force, we have also shown a method of focusing molecules. The data in both Fig. 4 and in Fig. 7 show that molecules that pass near the center of the deflection beam gain a velocity that is proportional to their distance from the center. These molecules must meet at a common point below the laser focus. For example, in the CO2data in Fig. 7, the molecules
gain a transverse velocity of 5 m/s at an offset from the beam center of 5mm. These molecules will reach the axis ~defined by the line joining the aperture and the center of the laser beam! in 1 ms. During that time the CS2molecules, moving
with a longitudinal velocity of 500 m/s, travel 500mm. Con-sequently the focal length of the molecular lens is f >500mm.
This experiment demonstrates one-dimensional focusing. Two deflection laser beams at right angles to each other would produce two-dimensional focusing as would a laser beam focused through an axicon.
C. Two-dimensional trapping: Molecular quantum wires A dramatic implication of the results that we have just described is the possibility of forming molecular ~or atomic! quantum wires. That is, confining molecules ~or atoms! in two dimensions with confinement so strong that their trans-verse translational energy is quantized. Molecules propagat-ing in a molecular quantum wire would be the analog of light propagating in an optical fiber. What makes molecular quan-tum wires especially exciting is that it appears that molecules can be confined to within about 10–60 Å, not much larger than a molecular dimension.
FIG. 7. The dependence of CS21 time of flight ~left axis! and
transverse velocity ~right axis! on the relative displacement of the deflecting and measurement beams. Open and filled circles and squares correspond to three successive scans with realignment. Solid curve is a derivative of the Gaussian curve with FWHM 35 mm.
FIG. 6. Ion spectra for successive 12-mm steps between the relative positions of the deflecting and measurement beams.
Producing a molecular quantum wire does not require a large extrapolation over the present experiment. Consider the output of a long-pulse 1.06-mm laser focused to produce a line of high-intensity radiation. Such a line can be achieved using an axicon or a hollow core waveguide. Alternatively, a standing wave pattern produced by counterpropagating beams in two perpendicular directions produces an array of molecular quantum wires. The diameter of a line focus can be less than one wavelength of light ~the FWHM diameter of a standing wave is approximately l/4! providing a confine-ment potential in two dimensions that is required for the molecular quantum wire. The length of the line focus is not confined by physics, but is, of course, confined by the size and complexity of the laser required.
It is possible to calculate the zero-point energy of such a trap. Assuming the confinement potential characteristic of a standing wave in one dimension U0cos2(2p
r/l), the potential
well structure near the well minimum is given by U5 2U0@12(2p2/l2)r2# so the zero-point energy of the
ground state is Eg5p\U01/2/lm1/2. For realistic parameters,
l51mm, U0550 meV and taking the H2 mass for m, we obtain Eg51024 eV. The approximate dimensions of the
ground-state wave function would be about 60 Å. For larger mass molecules the zero-point energy is reduced as is the diameter of the ground-state wave function. Having deter-mined the level spacing in the quantum wire we now discuss the issues involved in coupling molecules into the fundamen-tal mode of the wire.
In our molecular deflection experiment, the molecular beam had an estimated lateral kinetic energy Ekin of about
1027 eV in the region of the laser focus. This is orders of
magnitude less than the zero-point energy in the molecular wire. Since the lateral kinetic energy of the beam is given by
Ekin512mv'5
1
2mvx sin2qwhereq5d/2l, it is clear that the
lateral kinetic energy can even be reduced if vx or m is
reduced.
The major problem to be overcome before molecular quantum wires are produced is coupling this beam of mol-ecules into the wire without simultaneously coupling too much of their longitudinal energy into transverse motion. In analogy with optical fibers where laser light is coupled into the fundamental mode of the fiber using lenses, we believe that molecular lenses, such as we have just described, will be very helpful.
D. Three-dimensional trapping: Molecular quantum dots The approximately l/4 dimensions of a two-dimensional trap can also be achieved in three dimensions. With well depths of 50–100 meV the zero-point energy will again be approximately 1024 eV. It is clear that trapping is possible
even for molecules at or near room temperature. For a mo-lecular temperature of approximately 1 degree K the ground state will be preferentially populated. Methods for cooling have been discussed @4,21#. However, molecules in such a trap will interact differently than in free space. Laser-induced van der Waals complexes will play a major role and must be considered @25#.
E. An accelerator for neutral molecules
If the Stark shift can be on the order of 100 meV, approxi-mately one order of magnitude greater than those measured
here, the gradient of the Stark shift can be much larger still. The largest intensity gradient that can be produced without a surface present occurs in standing waves where the region of highest and lowest intensity are separated by 0.25l. This is almost two orders of magnitude smaller than the scale length of the intensity gradient that we have used and should lead to much higher acceleration.
Molecules trapped in a standing wave can be accelerated if the pattern is accelerated. Acceleration of a standing wave pattern is possible using an appropriately chirped pulse. The velocity Va of a pattern is determined by the frequency
dif-ference dn between the counterpropagating beams dv
52Va/l. Since the maximum force is constant, the velocity
will increase linearly with time so the frequency chirp that is required to follow the molecules’ motion is linear. The tech-nology of pulse shaping and chirping is well advanced @26# and linearly chirped pulses covering a wide frequency range are readily produced.
In an optimally accelerated standing wave with a gradient of the Stark shift of 43105 V/m, a hydrogen molecule will
achieve a velocity Va520 km/s in 1 ns corresponding to a
kinetic energy of 4 eV. For such a short acceleration length, the maximum frequency differencedvbetween the
counter-propagating beams is only about 40 GHz. Since the kinetic energy increases quadratically with time a kinetic energy of 400 eV is possible after 10 ns and the required frequency chirp is within the bandwidth of a picosecond pulse. The requirements necessary for this acceleration are available in many laboratories today. Accelerating neutral rotationally and vibrationally cold molecules to hundreds of keV ener-gies appears feasible.
F. Excited states
Although this paper has only explicitly discussed ground-state molecules or atoms, the polarizability can be much larger for excited states than for the ground state @27#. Thus, for a given laser intensity the ground and excited states of a molecule experience different Stark shifts and therefore can be spatially separated according to their electronic state. In addition, since Stark shifts are dependent on the internuclear coordinates, intense nonresonant radiation modifies the po-tential energy surfaces of a molecules and consequently the internal dynamics. In general, the nonresonant laser-induced Stark shifts provide us with robust methods for manipulating the external and internal variables of quantum systems.
ACKNOWLEDGMENTS
The authors acknowledge financial support from NATO laboratory linkage Grant No. LG 921398, enabling this inter-national collaboration to occur. In addition, E.C. thanks the International Council of Canadian Studies and C. Ellert thanks the A. V. Humboldt Foundation for financial support. The experiment benefited from the technical assistance of David Joines, Daniel Roth, and Bert Avery. We appreciate discussions with NRC colleague Tamar Seideman, who, par-allel with these experiments, has modeled molecular focus-ing. Helpful discussions with Misha Ivanov and Albert Stolow are also gratefully acknowledged.
@1# P. B. Corkum, M. Yu Ivanov, and J. Wright, in Annual
Re-views of Physical Chemistry, edited by H. Strauss, G. Babcock,
and S. Leone ~Annual Reviews Inc., Palo Alto, CA, 1997!. @2# P. Dietrich and P. B. Corkum, J. Chem. Phys. 97, 3187 ~1992!;
Comments At. Mol. Phys. 28, 357 ~1993!; F. Ilkov et al., Phys. Rev. A 51, R2695 ~1995!.
@3# P. Dietrich et al., Phys. Rev. A 47, 2305 ~1993!.
@4# B. Freidrich and D. Herschbach, Phys. Rev. Lett. 74, 4623 ~1995!.
@5# T. Seideman, J. Chem. Phys. 106, 2881 ~1997!.
@6# H. Stapelfeldt, H. Sakai, E. Constant, and P. B. Corkum, Phys. Rev. Lett. 79, 2787 ~1997!.
@7# P. B. Corkum, N. H. Burnett, and F. Brunel, Phys. Rev. Lett.
62, 1259 ~1989!.
@8# T. B. Simpson et al., J. Chem. Phys. 83, 628 ~1985!. @9# P. H. Bucksbaum, D. Schumacher, and M. Bashkansky, Phys.
Rev. Lett. 61, 1182 ~1988!; J. Chaloupka et al. ~unpublished!. @10# See, for example, papers in Atomic Physics 14, AIP Conf. Proc. No. 323, edited by D. J. Wineland, C. E. Weiman, and S. J. Smith ~American Institute of Physics, New York, 1994!. @11# A. Ashkin, J. M. Dziedzic, and J. E. Bjorkholm, S. Chu, Opt.
Lett. 11, 288 ~1986!.
@12# S. K. Svoboda and S. Block, Annu. Rev. Biophys. Biomol. Struct. 23, 247 ~1994!; A. Ashkin and J. M. Dziedzic, Science
235, 1517 ~1987!; T. T. Perkins et al., Science 264, 822
~1994!.
@13# H. Stapelfeldt, E. Constant, and P. B. Corkum, Phys. Rev. Lett.
74, 3789 ~1995!.
@14# D. R. Miller, in Atomic and Molecular Beam Methods, edited by B. Scoles ~Oxford University Press, New York, 1988!, p. 15.
@15# C. Rolland and P. B. Corkum, Opt. Commun. 59, 64 ~1986!. @16# P. B. Corkum, N. H. Burnett, and F. Brunel, in Atoms in
In-tense Fields, edited by M. Gavrila ~Academic Press, New
York, 1992!, p 109.
@17# A. A. Radzig and B. M. Smirnov, Reference Data on Atoms,
Molecules and Ions ~Springer-Verlag, New York, 1085!.
@18# K. J. Miller, J. Am. Chem. Soc. 112, 8543 ~1990!.
@19# D. T. Cramb, H. Bitto, and J. R. Huber, J. Chem. Phys. 96, 8761 ~1992!.
@20# M. Yu. Ivanov ~unpublished!.
@21# J. T. Bahns, W. C. Stwalley, and P. L. Gould, J. Chem. Phys.
104, 9689 ~1996!.
@22# M. V. Ammosov, N. B. Delone, and V. P. Krainov, Zh. Eksp. Teor. Fiz. 91, 2008 ~1986! @Sov. Phys. JETP 64, 1191 ~1986!#. @23# L. V. Keldysh, Zh. Eksp. Teor. Fiz. 47, 1945 ~1964! @Sov.
Phys. JETP 20, 1307 ~1965!#.
@24# B. Walker et al., Phys. Rev. Lett. 73, 1227 ~1994!.
@25# M. Yu Ivanov, D. R. Matusek, and J. S. Wright, Phys. Rev. A
54, 5159 ~1996!.
@26# A. M. Weiner, J. P. Heritage, and R. N. Thurston, Opt. Lett.
11, 153 ~1986!.
@27# R. W. Molof et al., Phys. Rev. A 10, 1131 ~1974!.