Publisher’s version / Version de l'éditeur:
Vous avez des questions? Nous pouvons vous aider. Pour communiquer directement avec un auteur, consultez la première page de la revue dans laquelle son article a été publié afin de trouver ses coordonnées. Si vous n’arrivez pas à les repérer, communiquez avec nous à PublicationsArchive-ArchivesPublications@nrc-cnrc.gc.ca. Questions? Contact the NRC Publications Archive team at
PublicationsArchive-ArchivesPublications@nrc-cnrc.gc.ca. If you wish to email the authors directly, please see the first page of the publication for their contact information.
https://publications-cnrc.canada.ca/fra/droits
L’accès à ce site Web et l’utilisation de son contenu sont assujettis aux conditions présentées dans le site LISEZ CES CONDITIONS ATTENTIVEMENT AVANT D’UTILISER CE SITE WEB.
18th International Conference on Port and Ocean Engineering Under Arctic
Conditions [Proceedings], 2005
READ THESE TERMS AND CONDITIONS CAREFULLY BEFORE USING THIS WEBSITE.
https://nrc-publications.canada.ca/eng/copyright
NRC Publications Archive Record / Notice des Archives des publications du CNRC :
https://nrc-publications.canada.ca/eng/view/object/?id=50b02443-a35a-4fc4-84dc-c7b1c1ff99b9 https://publications-cnrc.canada.ca/fra/voir/objet/?id=50b02443-a35a-4fc4-84dc-c7b1c1ff99b9
Archives des publications du CNRC
This publication could be one of several versions: author’s original, accepted manuscript or the publisher’s version. / La version de cette publication peut être l’une des suivantes : la version prépublication de l’auteur, la version acceptée du manuscrit ou la version de l’éditeur.
Access and use of this website and the material on it are subject to the Terms and Conditions set forth at
Explicit FEA and constitutive modelling of damage and fracture on
polycrystalline ice - simulations of ice loads on offshore structures
Derradji-Aouat, A.
EXPLICIT FEA AND CONSTITUTIVE MODELLING OF DAMAGE AND FRACTURE
IN POLYCRYSTALLINE ICE - SIMULATIONS OF ICE LOADS ON STRUCTURES
A. Derradji-Aouat
National Research Council, Institute for Ocean Technology, St. John’s, NL, A1B 3T5, Canada,
ABSTRACT
In Finite Element Analyses (FEA) of ice interactions with offshore structures, the
constitutive material model for the behaviour of ice becomes a critical factor to accurately
calculate maximum ice loads. Cracking activity is an integral part of the interaction process and
it can be modelled using a hybrid approach of constitutive modelling of ice behaviour and
explicit numerical solution
1.
In this paper, a brief summary for the constitutive model, damage formulation, failure
criterion, and numerical solution is presented. The subject of how both micro and macro cracks
are modelled and used in the simulations of typical ice-structure interaction problems (and
subsequently to calculate maximum ice loads) is discussed in the light of the results of two
different examples. The 1
stexample is a numerical simulation of an ice sheet (100 by 60 by 0.5
m) impacting a large fixed concrete structure (120 by 40 by 40 m) in the Bell Isle Strait (BIS),
Newfoundland, Canada. The 2
ndsecond example, however, is a simulation of a cylindrical rigid
indentor impacting an ice block (10 by 2 by 2 m) at high speed. The results from both examples
are discussed in the light of the “damage and fracture” formulation of the present constitutive
model and failure criterion for ice. Conclusions and recommendations for future work are
provided.
INTRODUCTION
In ice engineering, pressure-contact area formulas are used to determine the magnitude of
the loads induced by ice on offshore structures and ships. Historically, the pressure-area type of
formulation started in the 1980s, it is semi-empirical in principle and widely used by engineers
and scientists. Over the last 50 to 70 years, many other methods and equations have been
proposed to compute ice loads on offshore structures. Examples include the work by
Barnes
(1928), Korzhavin (1962), Michel and Toussaint (1977) and by Bohon and Weingarten
(1985). It1
* The expression “cracking activity” means crack initiation, propagation, and accumulation.
* The expression “constitutive model” means the stress-strain law that is used to model the mechanical behaviour of ice (such as elastic, elasto-plastic, viscous, …etc.).
* The expression “numerical solution” is used to indicate how cracking activity can be integrated in an existing numerical methodology such as the Explicit Finite Element Method (EFEM).
is important to emphasize that most of these formulations are empirical, and therefore extrapolations to compute ice loads in other interactions scenarios and ice conditions are surrounded by uncertainties. More importantly, most existing equations were developed for ice loads on rigid structures.
For complex2 or compliant structures (where the flexibility and/or the vibrations of the structure cannot be ignored), the use of empirical formulations may result in overestimations of the magnitude of ice loads, and subsequently overestimation of total costs. Recent work by Qianjin et al. (2002) shows that the vibrations of existing jacket offshore structures in the Bohai sea effect significantly the process of the interactions between ice and jacket columns, and the validity of using existing ice load formulation on such compliant structures is surrounded by very high level of uncertainty.
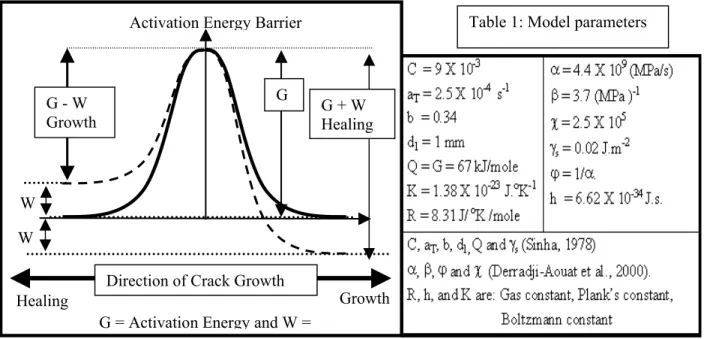
Table 1: Model parameters
Healing G - W Growth G G + W Healing
Direction of Crack Growth G = Activation Energy and W =
Growth Activation Energy Barrier
W W
Fig. 1: Schematic of an energy barrier and constitutive model parameters
For structures where the flexibility and/or the frequency (vibrations) of the structure cannot be overlooked, the use of a much broader solution is needed (Derradji-Aouat, 2003 a). This broader type of solution is usually achieved using numerical methods, such as the finite element method (FEM)
Numerically, since impact and collision scenarios involve highly non-linear displacements and induce non-linear dynamic forces and vibrations in the structural elements, Explicit FEM (EFEM) is emerging as the preferred method for numerical simulations (Derradji-Aouat, 2003a)
For effective use of EFEM, a “constitutive model” for the mechanical behaviour (stress and deformation) of ice is needed. Equally important, a “numerical solution technique” that is able to simulate cracks and cracking activity is also needed. These are two fundamental tools that are necessary for reliable simulations of ice loads on offshore structures (Derradji-Aouat 2003a). In addition to the capability of the numerical solution to model cracks and fracture “elements breaking away”, the broader definition of the expression “numerical solution technique” includes contact algorithms, interaction model, and time step size (Derradji and Lau, 2005).
In this work, two types of cracks are considered and discussed (they are micro-cracks and macro-cracks). The expression “micro-cracks” is used as a synonym for the word “damage”; it is defined as those cracks that are within the lattice and at the grain boundaries. As defined by Sinha (1989), micro-cracks have one dimension much larger than the other two, and the largest dimension is in the order of the grain boundary size.
2
In complex structures, the load transfer between structural members and to the foundation is not a straight path. Each structural component affects the response of the entire structure and affect the ice-structure process.
Mechanically, micro-cracking activity is a softening mechanism in the ice “constitutive” behaviour (Derradji-Aouat et al., 2000). Macro-cracks are those generated in the ice stress field (continuum); they may extend from a few centimetres to metres, or even kilometres. These are large cracks “fractures”, and they may result in the separation of large ice blocks and ice masses.
In this paper, a brief review of the damage constitutive model and the numerical solution are presented. It is not the scope of this paper to present a review of existing constitutive models for ice behaviour and damage; a review was previously given by Derradji-Aouat et al. (2000). An example of an ice sheet (100 by 60 by 0.5 m) impacting a large fixed concrete structure (120 by 40 by 40 m) in the Bell Isle Strait, Newfoundland and Labrador, Canada, is presented to show how these constitutive and numerical models are used to analyze and design an actual offshore structure in ice infested waters. Also, the results from a second example of a rigid cylindrical indentor (radius = 0.5 m) impacting a large ice block (10 by 2 by 2 m) are presented. The results from these two examples are discussed in the light of damage modeling and fracture mechanics. Conclusions and recommendations for improvements are provided.
CONSTITUTIVE MODEL FOR ICE BEHAVIOUR AND ITS DAMAGE
Time Dependent Behaviour of Polycrystalline IceFor ice engineering problems, the temperature of ice rarely goes below –50oC (223oK). Thus, the homologous temperature (T/Tm) of ice is always greater than 0.8. In material sciences, a material is considered to be in a high temperature state if its homologous temperature is ≥ 0.35. Thus, in nature, ice exists at high temperature states. In its natural high temperature states, when loaded, polycrystalline ice undergoes creep deformation and grain-boundary sliding (Sinha, 1978). A consequence of the high temperature deformation is that the stress-strain behaviour of ice is time (rate) and temperature dependent. Theoretically, time and temperature stress-strain dependent behaviour of polycrystalline ice is best shown through a simple creep curve (constant load test). There are three stages of creep (time dependent) deformation of ice when subject to a constant load: they are the primary (transient), the secondary (steady state), and the tertiary (accelerated rate) stages. During the primary stage, the strain rate decreases, and ice exhibits a strain hardening behaviour. During the tertiary stage, the strain rate increases, and ice exhibits a strain softening behaviour, this softening mechanism is induced mainly by the formation and accumulation of micro-cracks (damage at the grain boundaries). The secondary stage is a transitional stage from strain hardening to strain softening behaviour (Derradji-Aouat et al., 2000).
In order to produce a constitutive equation that describes the behaviour of polycrystalline ice, it was hypothesized that the overall behaviour of ice can be presented as the sum of two constitutive models. These are: the intact (damage free) ice model and the crack-activity (damage) ice model:
Damage ij Intact ij Total ij ε = ε + ε (1)
The intact ice model [(εij)Intact] describes the behaviour of ice in the non-damaged (crack free) state of the ice, while the damaged ice model [(εij)Damage] describes the effect of micro-cracks on the overall mechanical behaviour of ice. The intact model formulation was presented as the sum of the instantaneous elastic strain, (εij)ie, a visco-elastic strain (εij)ve, and a visco-plastic strain (εij)vp. Since the work in this paper is focused on the structural deterioration, damage and failure of ice, the mathematics for the intact ice model is not discussed (it was given by Derradji-Aouat et al., 2000).
Damage “Micro Cracking Activity” Formulation
The strains induced by the micro-cracks [(εij)Damage] are formulated on the basis of the rate theory for fracture kinetics. Historically, Krausz and Krausz (1989) developed a fracture kinetics and crack growth theory for polycrystalline metals. Their concept was based on the idea that crack growth results from a succession of inter-atomic bond breaking. They indicated that under external loads, the inter-atomic distances stretch, if the load is sufficient enough, the inter-atomic bonds break, and the crack moves forward. Also, backward
movement of a crack is possible (crack healing) if the atoms are brought close to each other enough to restore the broken bonds. The process of bond breaking and healing occurs in steps (called energy activations). For a crack to grow (or to heal), an activation energy barrier must be overcome. As shown in Fig. 1, in the absence of external loads (solid line in Fig. 1), a state of activation equilibrium exists (meaning that forward activations are equal to the backward ones and the net result is no damage). Upon application of external work, W, the curve shifts from solid to dashed lines in Fig. 1. The energy required for a crack to grow is (G – W) while the energy needed for a crack to heal is (G + W). Thus, the energy needed for a crack to heal is larger than the energy needed for a crack to grow .
The rate of crack growth is defined as the number of forward activations per second. Similarly, the rate for crack healing is the number of backward activations per second. The Net Rate for Crack Growth (NRCG) is the sum of the two:
(
)
T K W exp T K W exp * T R G exp h T K NRCG − − − = (2a) where K, h, R are constants (given in Table 1) and the external work, W, is:
ε
χ
=
KT
(
)
ve
*
q
-
P
W
(2b)where the constant χ is given in Table 1. The deviatoric tensor for the visco-elastic strains (ε)ve , and the shear and hydrostatic stresses (q and P) are given in Appendix A.
The work “W” is formulated as a function of the stress difference (q – P). This means that the shear stress, q, enhances the growth of micro-cracks while the hydrostatic pressure, P, opposes it. The energy needed to create new surfaces (due to the opening of new micro-cracks) is:
t ) NRCG ( c A s 2 U = γ ∆ (2c)
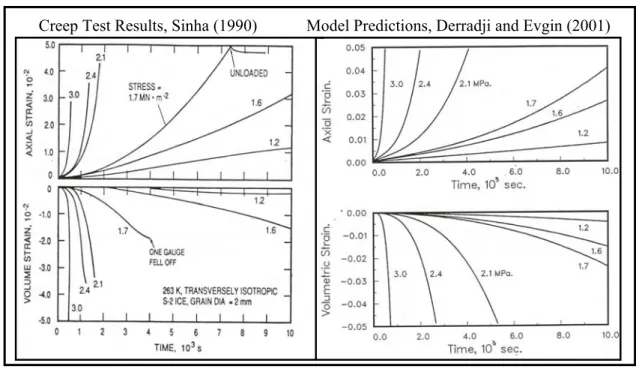
Creep Test Results, Sinha (1990) Model Predictions, Derradji and Evgin (2001)
Test Results
Predictions
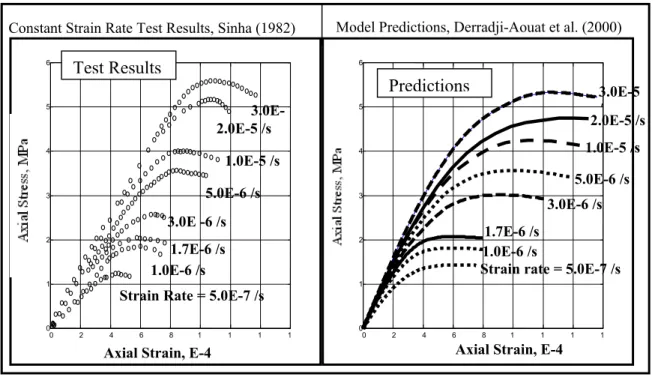
Model Predictions, Derradji-Aouat et al. (2000) Constant Strain Rate Test Results, Sinha (1982)
1.7E-6 /s 1.0E-6 /s
Strain rate = 5.0E-7 /s 3.0E-6 /s 5.0E-6 /s 1.0E-5 /s 3.0E-5 / 2.0E-5 /s 6 5 4 3 2 1 1 1 6 8 1 1
Axial Strain, E-4
4 2 0 0
Strain Rate = 5.0E-7 /s 1.0E-6 /s 1.7E-6 /s 3.0E -6 /s 5.0E-6 /s 1.0E-5 /s 3.0E-2.0E-5 /s 6 5 4 3 2 1 1 1 1 4 6 8
Axial Strain, E-4
1 2
0 0
Fig. 2b: Constant strain rate test results and model predictions
where γs is the surface energy (value given in Table 1), ∆t is the time increment, and Ac is the new area created as a result of the opening of the new micro-crack.
Eq. 2c, is an energy potential equation (Derradji-Aouat et al., 2000), and therefore both shear
and volumetric strains generated by micro-cracks are calculated as:
( ) q ij S KT P q Cosh * RT G exp h 2 d s t 6 ij q q U damage ij e = ϕ ∆ γ η − η σ ∂∂ ∂ ∂ ϕ = (3a)
( )
(
)
η − η γ ∆ ϕ = σ ∂∂ ∂ ∂ ϕ = ε KT P q Cosh * RT G exp h 2 d s t 3 4 ij P P U damage v (3b)where φ is the coefficient of proportionality (Table 1).
Initial Value Problem - Damage Model Predictions
Sinha (1990) presented the results of a series of long-term creep tests (Fig. 2a, left). All tests were performed at – 10oC, grain size ≈ 2 mm, and load range from 1.2 MPa to 3.0 MPa. Fig. 2a (right) shows the model predictions of the test results. A quick comparison between measured and predicted curves indicates that the model predicted successfully the test results (over 90% agreement). Both experimental and predicted curves show that significant amounts of tertiary creep took place. It is important to reiterate that, in this constitutive model, the tertiary creep is an accelerated deformation process induced by the micro-cracking activity “ that is damage at the grain boundaries”. The model predicted the volumetric expansion/dilation due to the openings of micro-cracks by using Eq.3b.
A 2nd example to show the ability of the constitutive model to predict failure of ice (peak stresses) is given. Sinha (1982) presented the results of a series of constant strain rate tests (Fig. 2b, left). The tests were performed at – 10oC, grain size ≈ 4 to 5 mm, and strain rates from 5 10-7 /s to 3 10-5 /s.
The model predictions of Sinha’s (1982) test results are given in Fig. 2b (right). Comparisons between predicted and measured stress strain curves indicate that the predictions are in very good agreement with the experimental data (over 90% agreement), and the model was able to predict the failure stresses. It is important to note that the present constitutive model (Eq. 1) does not have a failure criterion. It predicts the peak stresses
because the effects of micro-cracks [damage model, (εij)Damage in Eq. 1] becomes dominant with time as compared to the strains predicted by the intact model [(εij)Intact in Eq. 1]. As loading time continues, the result is that the overall mechanical behaviour switches from a hardening to softening one.
-20 0 20 40 60 80 100 0 3 6 9 12 15 18
Hydrostatic Pressure, P, MPa. Oct ah edra l Sh ear Str es s, q, MP a. 5.4E-4/s
Strain rates ranging from 5.4E-4/s to 1.4E-2/s
1.4E-3 /s 5.4E-3 /s
14E-3 /s
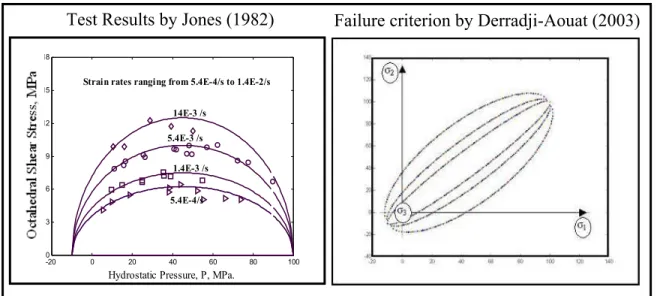
Failure criterion by Derradji-Aouat (2003)
Test Results by Jones (1982)
Fig. 3: An example for triaxial test results and the development of failure criterion (Derradji-Aouat, 2003) In the last two examples, the model predictions of tertiary creep (Fig. 2a) and the predictions of the failure stresses (Fig. 2b) are very good. However, all calculations were limited to low strain rates (about < 10-3 /sec). At high strain rate (about 10-3 /sec and greater), for constant strain rate tests, the model predicts linear elastic stress-strain curves with no failure at all. And, for creep tests, it does not predict tertiary creep (damage). This is due to the fact that, at high strain rates, the load is applied relatively fast, and the damage model [(εij)Damage in Eq. 1] does not have enough time to produce any significant amount of strains due to cracking activities. It was concluded (Derradji-Aouat, 2000) that present constitutive model (Eq. 1) does not predict the brittle mode of failure of ice. Note that brittle modes of failure take place at high strain rates (about 10-3 /sec and greater 1). Therefore, it was recommended that the constitutive model needs a complementary (additional equations) for brittle failure of ice at high strain rates.
Failure Criterion for Ice – Brittle Failure Model Formulation
For high strain rates, the failure criterion for ice was developed on the basis of triaxial test results (such as those by Jones, 1982, and Rist and Murrell, 1994). Strain rates from 1.4 10-6 s-1 to 10-2 s-1, confining pressures from 0.0 to 85 MPa, and temperatures between -5.2oC and –44.7oC were investigated. The analyses of the experimental results show that, when the results of all triaxial tests are plotted in the octahedral stress plane (τoct versus P), the failure stresses follow a series of elliptical curve (an example is given in Fig. 3 right, where the test results by Jones, 1982, and their corresponding elliptical curves are plotted).
Note that in the triaxial test results, σ2 = σ3. However, in true 3-D case (σ1 ≠ σ2 ≠ σ3), the elliptical curves are generalized into ellipsoids, in which the axis of revolution is the hydrostatic pressure axis P. In terms principal stresses, the equation for the ellipsoid failure surface is:
0. 1 ) 1 (I * 3 F ) 2 (I * 2 F ) 2D (J * 1 F + + 2 = (4)
where F1, F2, and F3 are model functions and J2D is the 2nd deviatoric stress tensor. I1,and I2 are the 1st and 2nd stress tensors (the stress notation in this paper is the same as in Dessai and Siriwardane. The complete mathematical derivation of Eq. 4 was given by Derradji-Aouat (2003 b).
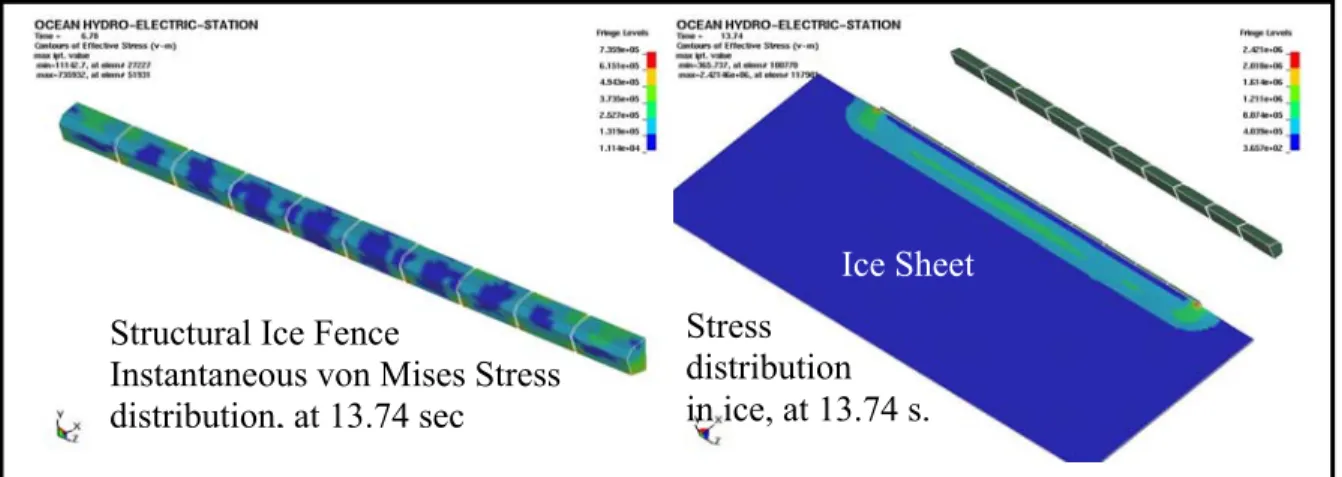
Ice Sheet
Stress
distribution
in ice, at 13.74 s.
Structural Ice Fence
Instantaneous von Mises Stress
distribution, at 13.74 sec
Fig. 4a: Local loads on the structural ice fence and stress distribution in the ice sheet at 13.74 s.
BOUNDARY VALUE PROBLEM SIMULATIONS –APPLICATIONS
Algorithms for the implementation of the constitutive model into the numerical solution were presentd by Martonen et al., (2003). Derradji-Aouat and Lau (2005) presented the algorithm for contact and erosion of ice. In this section, two different examples are presented to show how the
a. combined constitutive and numerical model is used to analyze and design a complex offshore structure for ice-infested waters.
b. constitutive model can be used to further the development and research in the area of damage mechanics and fracture of ice and in the area of calculations of ice loads on offshore structures.
First Example – Ice Loads on a Complex Offshore Structure
A large concrete structure (120 m long by 40 m wide by 40 m high) is struck by a large ice floe (100 m long X 60 m wide X 0.5 thick) is considered. Originally, the structure was proposed as a hydroelectric generation station in the BIS. The structure was designed to harness electric power from the natural current and tidal waves in the strait. The detaills regarding the strcutural design concept, the development of the finite elements model and its boundary conditions, typical ice conditions and ice regimes in the strait were given by (Derradji-Aouat and Lau, 2005). In this paper, additional results with respect to ice behaviour, local and global loads on the structure, and structural response are given.
An instantaneous ice load distribution on the structural ice fence is shown in Fig. 4a (left); this is a snapshot of the stress distribution at 13.74 seconds of the simulations. The stress contours show high load areas (red), low load areas and non-loaded areas (dark blue). As the simulation continues with time, the intensity of the loads as well as the distribution of the loaded areas changes in time and in space. This is similar to what Jordaan et al., 1993, called high-pressure and low-pressure zones.
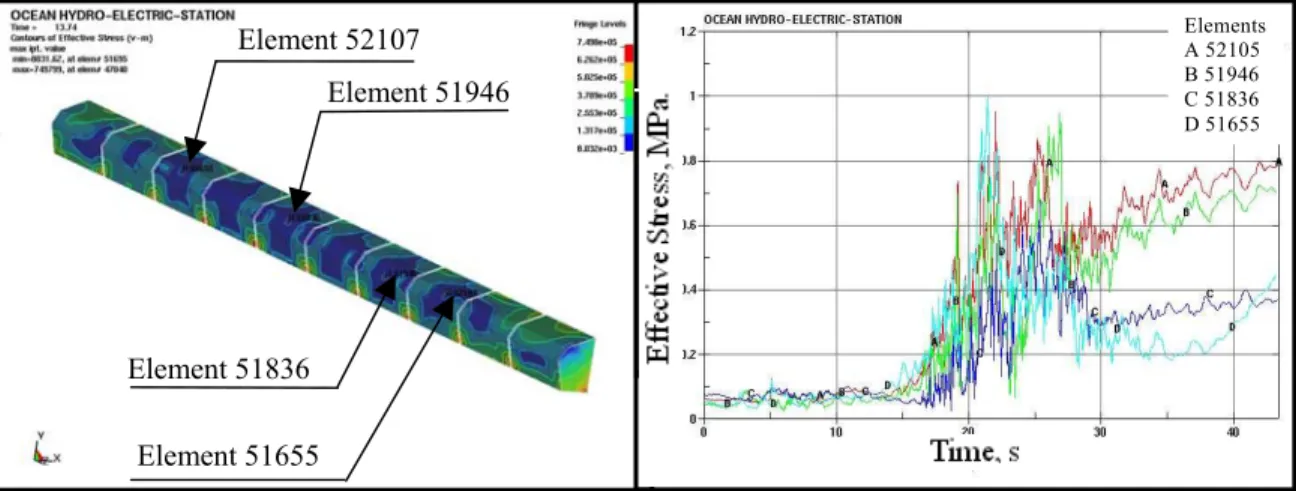
On the other side, from the ice sheet standpoint, the global stress distribution at 13.74 seconds is much different (Fig. 4a right). The von Mises stress distribution at 13.74 sec of the impact show high shear stress zones at the corners of the ice fence combined with a lesser stress magnitude (along the ice sheet-ice fence) due to bending stresses generated by ice ride up on the sloped ice fence. Examples of stress distribution and calculated time histories in ice elements are shown in Fig. 4c. Note that it is possible to plot stress time histories of any element (of the structure or ice), however, the elements presented in Fig. 4b and 4c are just examples.
Figures 4a to 4c indicate that, during interactions, the ice sheet elements and the structural
element undergo different patterns of stress distribution and behaviour. The two entities (ice and
structure) are subjected to different stress time histories and undergo different responses.
The global ice load on the structure can be presented as the resultant of the contact loads
“interface forces” between the structure and the ice sheet. In the present example, there are two
contacts: Ice contact with the ice fence and ice contact with the vertical walls. The contact forces in
both cases are given in Fig. 4d. The global ice load is the sum of the two. As expected, the vertical
walls resist much of the global loads as compared to the ice fence. In this example, a maximum global
ice load of about 40 MN is obtained.
Elements A 52105 B 51946 C 51836 D 51655 Element 51655 Element 51836 Element 51946 Element 52107
Fig. 4b: Left: Local stress distributions in the structural ice fence Right: Stress time histories for the elements indicated on the right
Elements A 119281 B 117981 C 116981 D 117995 117995 117981 119281 117681
Fig 4c: Left: Stress distribution in the ice sheet
Right: Stress time histories for the elements indicated on the right
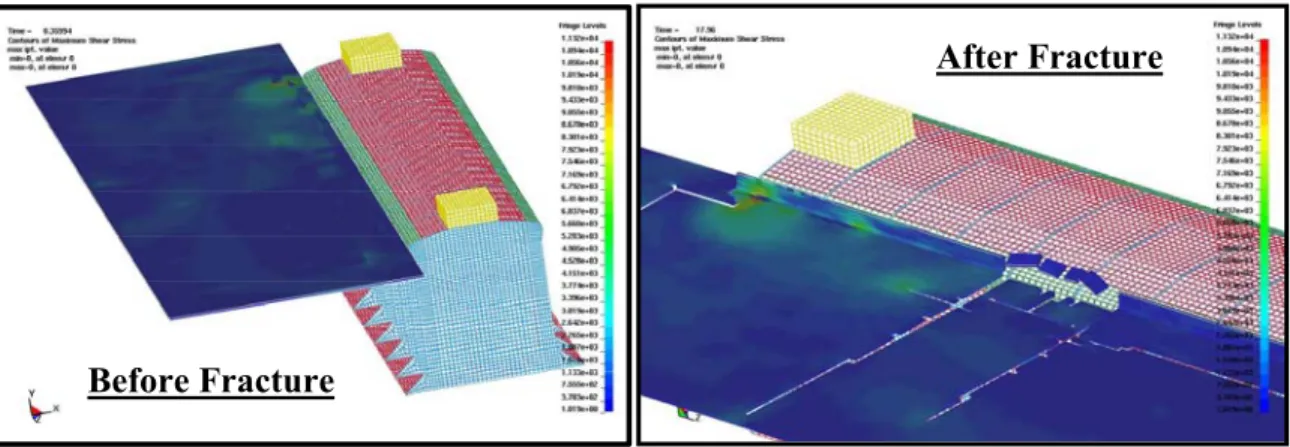
Large fractures (macro-cracks) are generated in the ice sheet when the ice elements are eroded away (eroded elements are sometimes called killed elements). Erosion of an ice element is activated, when the element reaches the brittle failure condition. An example for large fractures generated in the ice sheet is shown in Fig 4e. Numerically, erosion means that a failed element is taken out of the initial mesh and/or its stiffness is set to zero. Over the last few years, in the literature, many erosion algorithms were presented (for example to simulate excavation in geotechnical engineering). Most of them were developed to satisfy the condition that “when an element reaches the failure condition, the element stiffness is set to zero”. This technique is used in the present work. However, it is believed that much better erosion algorithm is needed for ice behaviour (Martonen et al., 2003). This due to the fact that, unlike geotechnical materials, fractures in ice are rate (time) and temperature dependent in addition to being dependent on its failure criteria.
Vertical Walls
Ice Fence
Fig. 4d: Global ice loads on the structure
After Fracture
Before Fracture
Fig. 4e: Example for simulated large fractures in the ice sheet (before and after fractures).
Second Example – Ice-Structure Indentation Simulations
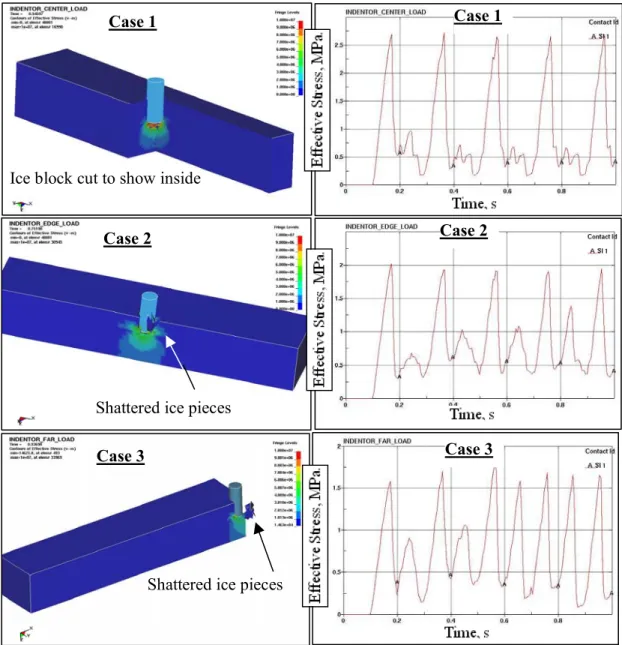
A practical way to show how damage can be simulated numerically is through the analysis of a simple indentation test simulations. In this example, a cylindrical rigid indentor (radius = 0.25 m) impacting an ice block (10 by 2 by 2 m) at a constant velocity of 1 m/s is considered. Note that this is not an initial velocity case, the indentor is forced downwards through the ice block at 1m/s during the entire time of the simulation. The locations of the impacted areas were varied Three cases were considered (Fig. 5a): In case 1, the impacted area was at the center of the ice block. In case 2, the impacted area was at the edge. In case 3, the impacted area was at the corner (Fig. 5a). In a way, the results from these three cases provide an insight into the effect of material confinement on the magnitude of the indentations loads.
Case 1: Location (5, 1) Case 2: Location (5, 1.75) Case 3: Location (9.75,1.75) X Y Z 10 m 2 m 2m
Fixed Bottom Nodes (Z = 2.0) in all directions
The results of the numerical simulations for all three cases are given in Fig. 5b. The von Mises stress (shear) distributions are shown on the left side, while the global ice load time histories are shown on the right. In all three cases, the indentor forced its way through the ice block, creating a hole in the process (Fig. 1a). In cases 2 and 3, shattered ice pieces were observed (due to low confinment). It appears that, in these simulations, the size of the indentor is very small (as compared to the size of the ice block) and its velocity is high (1 m/s), the result is a fast breaking of ice elements (erosion). Maximum global ice loads of 2.7, 2.0 and 1.75 MPa were calculated in cases 1, 2 and 3, respectively.
The reduction of the maximum ice loads is attributed to the material confinement effects. All ice load time histories (Fig. 5b) are charracterized by high peaks followed by a smaller ones. The higher peack corresponds to the breaking of intact ice (non damaged ice), or pushing on a very compacted and confined ice layer, while the small peaks corresponds to the loads on broken ice and the clearing of ice pieces. Actual indentation experimental results of such impact scenario are very valuable to validate the present model.
CONCLUSIONS AND RECOMMENDATIONS
The interactions of ice sheets with offshore structures involve complex mechanical behaviour of ice and a matching complex response of the structure. Depending on the interaction scenario, type of structure and the environmental conditions (such as impact velocity), ice behaviour could range from a simple visco-elastic ice behaviour to a complex damage state variables and fracture driven constitutive behaviour. Over the last 30 years, much valuable laboratory and theoretical research has been completed and published, and yet the question (and debate) of developing methods for accurate simulations of the interactions between ice sheets (or ice masses, such as bergybits) and structures still persists.
In this paper, it has been shown that a constitutive model for ice (that includes damage, micro-cracking formulation), a failure criteria (that deals with large fracture in the ice media) and a robust numerical solution method (such as EFEM) can be all combined to produce a powerfull tool that can be used to simulate the interactions of ice with actual offshore structures, and subsequently, calculate both local and global ice loads. It is recognised that this type of numerical approach is complex, and it may need to be simplified, however it is virtually the only solution that combines all important mechanisms observed during ice structures into one single solution. Equally important; this type of numerical solution is virtually the only solution for calculating ice loads on compliant offshore structures; where the flexiblility and/or the vibrations of the structure due to ice breaking can not be ignored.
It is recommended that other physics phenomena observed in ice experiments have to be modelled and incorporated in the constituitive model. One of these is the recrystallization of the impacted (crushed) ice and the other is the progress of damage in the ice lattice. Melanson et al. (1999), Meglis et al. (1999), and Muggeridge and Jordaan (1999) have reported many new observations amd information regarding the microscopic mechanical behaviour of ice under external loads. It is important to include some of this new information in the present constitutive model formulation. For example, recrystalisation is an important mechanism, it reflects the fact that an alternating softening-hardening mechanisms of deformation should be formulated (softening is due to damage – hardening is due to recrystallization). At the moment, the model takes into account only the softening mechanism due to micro-cracking activity.
The main recommendation is a systematic verification and validation of the present contitutive-numerical approach. Verification process will be directed towards adressing the following concerns: Are the constitutive equations complete? Does the constitutive include formulations for the important mechisms for ice mechanical behaviour, damage and fracture? Does the numerical model includes algorithms for all process involved in typical ice-structures interactions, such as the ability to simulate large fractures, non-uniform contact of ice with the structure and the non-simulatneous failure of ice?
The validation process will be focussed on comparisions between the results of actual laboratory and field experiments and the predictions of the model. Naturally, the experimental data should be of high quality.and worthy for validation of constitutive-numerical models. The quality of the experimental data will be accessed through an uncertainty analysis procedure (Derradji-Aouat et al., 2004).
Case 2
Case 3
Ice block cut to show inside
Shattered ice pieces
Case 1 Case 1
Case 2
Case 3 Shattered ice pieces
Fig. 5b: Ice-structure indentation simulations results 1. REFERENCES
2. Barnes H.T: Ice Engineering. Renouf Pub. Corp., Montreal, 1928.
3. Bohon W.M. and Weingarten J.S. (1985). The calculations of ice forces on Arctic structures. Proceedings of the Arctic, San Francisco, pp. 456 – 464.
4. Derradji-Aouat A (2000). A Unified failure envelop for isotropic fresh water ice and iceberg ice. OMAE-2000. New Orleans, USA. Polar and Arctic session, PDF file #1002.
5. Derradji-Aouat A., Sinha N.K., and Evgin E. (2000). Mathematical modelling of monotonic and cyclic behaviour of fresh water columnar S-2 ice. Cold Regions Science and Technology, Vol. 31, No. 1, 59-81. 6. Derradji-Aouat A (2003 a). Emerging Trends in Numerical Predictive Technologies in Offshore and Marine
Engineering. Journal of Offshore Mechanics and Arctic Engineering, Vol. 125, No. 4, pp. 293-296.
7. Derradji-Aouat A. (2003 b): Multi-Surface Failure Criterion for Saline Ice in the Brittle Regime. Cold Regions Science and Technology, in press, September 2002.
8. Derradji-Aouat A., Izumiyama K, Yamaguchi H., and Wilkman G. (2004). Experimental uncertainty analysis for ice tank ship resistance experiments using a model for a Canadian icebreaker “Terry Fox”. Oceanic Engineering Inter national, Vol. 8, No. 2, pp.49 -69.
9. Derradji-Aouat A. and Lau M. (2005). Ice loads on electric power generating stations in the bell isle strait. Submitted to POAC-2005. Potsdam, New York, USA, June 26 – 30.
10. Jones S.J. (1982). The confined compressive strength of ice. J. Glaciology, Vol. 28, pp. 171-177.
11. Jordaan I.J, M.A. Maes, brown P.W and Hermans I.P. (1993). Probabilistic analysis of local ice pressures. Journal of Offshore Mechanics and Arctic Engineering, Vol. 115, pp. 83-89
12. Krausz A.S. and Krausz K. 1989. Fracture Kinetics of Crack Growth. Kluwer Academic Publishers, 180 p. 13. Korzhavin N.K., 1962Action of Ice on Engineering Structures. CREEL Translation # 260, Hanover.
14. Martonen, P. Derradji-Aouat A., Määttänen M, and Surkov G. (2003). Non-linear Finite Elements Simulations of Level Ice Forces on Offshore Structures using a Multi surface Failure Criterion. Proceedings of POAC-2003. Trondheim, Norway, pp. 223- 232.
15. Melanson P.M., Meglis I..L., Jordaan I.J. and Stone B.M. (1999). Micro-structural change in ice I. Constant deformation rate tests under triaxial stress conditions. J. Glaciology, Vol. 45, No 151, p-p. 417437.
16. Meglis I.L., Melanson P.M. and Jordaan I.J. (1999). Micro-structural change in ice II. Creep behaviour under triaxial stress conditions. Journal of Glaciology, Vol. 45, No 151, pp. 438-448.
17. Michel B. and Toussaint N. (1977). Mechanisms of indentation of ice. J. Glaciology, Vol. 19, pp. 285-300. 18. Muggredge K.J. and Jordaan I.J. (1999). Micro-structural change in ice III. Creep behaviour under triaxial
stress conditions. Journal of Glaciology, Vol. 45, No 151, pp. 449-455.
19. Qianjin Yue, Xiangjun Bi1, Xi Zhang and Tuomo Karna (2002). Dynamic ice forces caused by crushing failure. Proceedings of the 16th IAHR International Symposium on Ice. New Zealand, PP. 134 – 141. 20. Rist M. A. and Murrell S.A.F. (1994). Ice triaxial deformation. J. Glaciology, No. 135, pp. 305-318. 21. Sinha N.K. 1978. Rheology of columnar-grained ice. Exp. Mechanics, Vol.18, No. 12, pp. 464-470. 22. Sinha N.K, 1982. Constant strain -stress rate of columnar-grained ice. Exp. Mech. Vol. 17, pp. 785. 802. 23. Sinha N.K. 1990. Kinetic of micro-fracturing and creep dilatation in polycrystalline columnar grained and
equiaxed Ice. 4th Int. Conference on Creep, University College, Swansea, UK., pp. 345-354.
APPENDIX A: NOMENCLATURE AND DEFINITIONS
σij and εij are the stress and strain tensors and Sij is the deviatoric stress tensor. q and P = deviatoric shear stress and hydrostatic pressure:
(
)
(
)
(
)
σ −σ + σ −σ + σ −σ ==
+
+
3
σ
2
σ
1
σ
3
1
P
and 2 1 q 1 2 2 2 3 2 3 1 2J2D and τoct are the 2nd invariant of the deviatoric stress tensor and the octahedral shear stress, respectively.
oct 2 3 D 2 J 3 q = = τ
εv = volumetric strain: εv = ε11 + ε22 + ε33 and eij= deviatoric strain tensor:
ii ε ij δ 3 1 ij ε ij e − =
I1, I2, I2 are the 3 invariants of the stress tensor. G, W, and d = activation energy, work, and grain size. T and Tm = temperature and melting temperature (in oK).