HAL Id: hal-02156651
https://hal.archives-ouvertes.fr/hal-02156651
Submitted on 6 May 2020HAL is a multi-disciplinary open access archive for the deposit and dissemination of sci-entific research documents, whether they are pub-lished or not. The documents may come from teaching and research institutions in France or abroad, or from public or private research centers.
L’archive ouverte pluridisciplinaire HAL, est destinée au dépôt et à la diffusion de documents scientifiques de niveau recherche, publiés ou non, émanant des établissements d’enseignement et de recherche français ou étrangers, des laboratoires publics ou privés.
Models
Eric Le Bourg
To cite this version:
Eric Le Bourg. Cross-Sectional and Longitudinal Designs in Animal Models. Encyclopedia of Biomed-ical Gerontology. Elsevier. vol. 1, Academic Press, pp. 462–467., Elsevier, 2020. �hal-02156651�
Cross-sectional and longitudinal designs in animal models
Eric Le Bourg,
Centre de Recherches sur la Cognition Animale (CRCA), Centre de Biologie Intégrative (CBI Toulouse), Université de Toulouse, CNRS, UPS, Toulouse, FranceGlossary
Cros-sectional design: a study that measures a trait at various ages in different subjects. Longitudinal design: a study that measures a trait at various ages in the same subjects.
Key-words
Cross-sectional design — longitudinal design — lifespan — ageing — animal models
Abstract
Age-related changes can be studied by relying on cross-sectional or longitudinal designs. These designs do not allow to draw the same conclusions, because they face different issues. This article describes these designs in animal models.
Introduction
Studying the effects of ageing on any variable requires selecting the best method to do so. In a perfect world, one would like to obtain a measure reflecting with no bias the age-related change, with a minimal amount of time, money, and effort. Yet, in real life, this is always a compromise.
This article is not devoted to the study of designs used in human beings (but see [1]), but to those that can be used in animal models. Even if studies on humans may share some features with those on animal models, it remains that the problems that the experimenter encounters in human and animal studies are widely different. For instance, subjects of longitudinal human studies may decide to stop their participation to the study, which implies that the experimenter is concerned with right censoring of data (data being available up to a certain age, but not thereafter, for another cause than the death of the subject), but mice or flies used in a longitudinal study are not offered this choice. Therefore, right censoring of data is often not an issue in animal studies.
Only traits that can be studied at the individual level are considered below. In some cases, the effects of ageing are not studied in individuals, but only on groups. For example, age-related changes of mortality rates cannot be studied in individuals, because a mortality rate is the
proportion of individuals dying during a time interval.
There are two main methods for measuring age-related changes, cross-sectional and longitudinal designs.
Strengths and weaknesses of cross-sectional designs
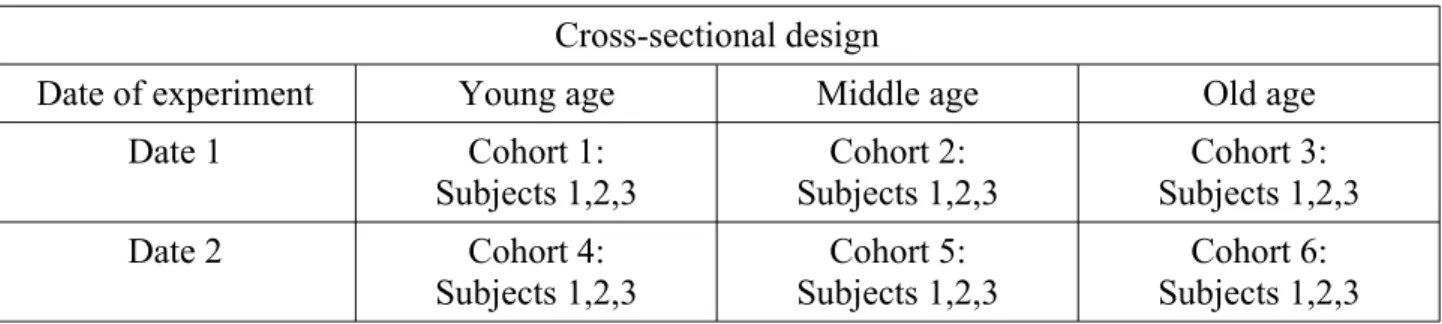
In a cross-sectional design, an individual is observed only once at one age: an individual is thus observed only once during its whole life (Table 1). The effect of age is observed by studying at the same time (Date 1 in Table 1) different age groups, say at young, middle and old age. Such a procedure will allow a study to be carried out quickly, because all animals are observed at the same time, provided animals of the needed ages are available (for example, by purchasing mice of different ages). Another advantage of performing the experiment in a narrow time is that there is a good chance that the experimental conditions will remain the same during the whole experiment. However, relying on this design requires that some assumptions are met.
Table 1. Cross-sectional design. In this table, three age groups are used but other ones could be used as well.
Cross-sectional design
Date of experiment Young age Middle age Old age
Date 1 Cohort 1:
Subjects 1,2,3 Subjects 1,2,3Cohort 2: Subjects 1,2,3Cohort 3:
Date 2 Cohort 4: Subjects 1,2,3 Cohort 5: Subjects 1,2,3 Cohort 6: Subjects 1,2,3 Firstly, because the subjects of different ages are observed at the same time, they are obviously born at different times, and it is implied that these birth cohorts (numbered cohorts 1, 2, 3 in Table 1) are similar, i.e. that belonging to a specific cohort does not modify the conclusions on the effect of age. In mice, because they live for 2-3 years, many events could have happened in the rearing facility during that time, and animals of cohort 1 could be different from those of cohort 2 because of different living conditions or events during their life. In humans, people born at different dates have lived in different conditions, which can modify the conclusions of the study. For instance, undernutrition in early life, including in utero, because of war, famine, and so on, increases vulnerability to cardio-vascular diseases [2]. Comparing such a cohort at old age to younger ones, spared from undernutrition in early life, can give rise to spurious conclusions regarding the effect of age, because a cohort effect is added to the age effect. In animals, the cohort effect seems negligible, but this will not always be the case. For instance, the lifespan of fruit flies
of the same strain measured in the same laboratory under the very same breeding conditions over a 4 years period varied greatly, for unknown reasons [3]. Flies born at different times may have been subjected to different conditions during their development even if breeding methods are standardised, which could make lifespan and age-related changes to vary.
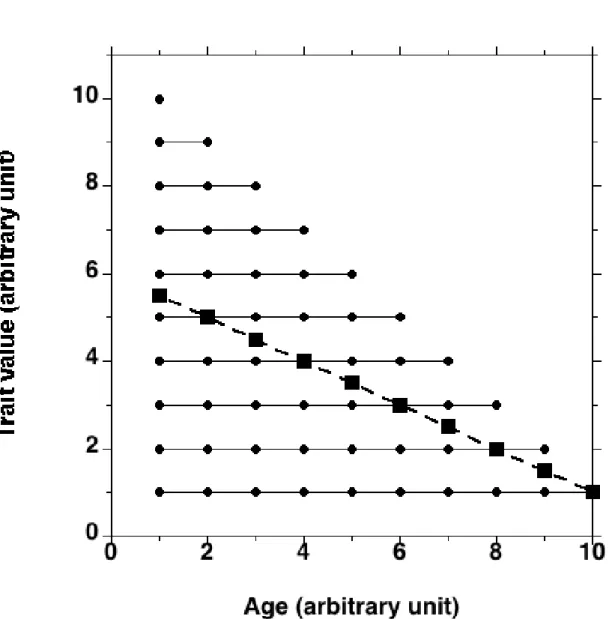
Secondly, the cross-sectional design implies that the studied trait is not linked with lifespan, but in many cases there is no basis for such an assumption. If the measured trait is linked with lifespan, the age effect may partly reflect a differential survival effect linked to the trait under study. Figure 1 shows the case where the value of a trait does not change with age, with animals displaying the highest value dying the first. In such an extreme case, the average value observed at successive ages would decrease while the value of this trait, measured on the same individuals at different ages, does not change with age. Therefore, this study would spuriously conclude that the trait decreases with age, while no age-related decrease is observed in any individual. Obviously, this is only a theoretical example, as observing absolutely no effect of age on a trait while lifespan is highly dependent on this trait is surely a rare event. As a more realistic example, it has been reported that the loss of weight between 22 and 28 months of age was 2.27 g in a sample of 76 mice, but it was only 1.35 g if only mice alive at 28 months of age were taken into account (n = 54). Therefore, ca 40 % of the weight loss was due to selective mortality, heavier mice dying the first, between 22 and 28 months of age [4].
Thirdly, since the cross-sectional approach does not observe age-related changes in the same individuals, it is impossible to know the individual trajectories during ageing. Some subjects can display an age-related decrease, while other ones could show a lower decrease, or no decrease, and even an age-related increase. Averaging the values at each age may therefore give the illusion that all animals age at the same rate, and thus negate individual variability. The cross-sectional design is therefore not suitable for a study of the individual variability of ageing.
Figure 1: Example of a trait that does not change with age, but is linked with lifespan, the value of the trait decreasing as lifespan increases. The solid lines show individual values and the dashed line is the average at each age of individual data. A cross-sectional study observing different animals at the same time would conclude that the value of the trait decreases with age, whereas this is not the case. See also [5].
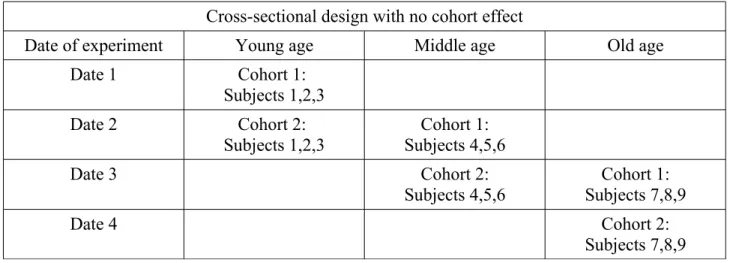
A first strategy to avoid the cohort effect could be to repeat the experiment with other cohorts. As in Table 1, three new cohorts (numbered 4, 5, 6 in Table 1) are observed in a new experiment at Date 2 and one expects to observe similar results if there is no cohort effect. In addition, repeating the experiment can confirm that the whole results observed at Date 1 can be generalised to other dates of experiment. Another strategy to avoid the cohort effect is to observe animals of the same cohort at different ages. Thus, for instance (Table 2), some animals are observed at young age (Cohort 1, subjects 1, 2,3), other ones at middle age (4, 5, 6), and the last survivors at old age (7, 8, 9). The study then lasts, at least, the same time as the difference between the youngest and oldest ages of observation, which can also be an issue, because of the possible change over time of the experimental conditions. For example, a study in mice, which live for 2-3 years, may be confronted with changes of staff during this period. Because a single cohort is observed, it cannot be excluded that this very cohort is different from other ones. Repeating the experiment with another cohort (Cohort 2 in Table 2) could allow to know whether the observed effects are specific to this cohort or not. If the results are similar within and among cohorts, then the observed age-related changes can be considered as robust.
The other issues of the cross-sectional design (measurement of individual age-related changes, survival linked to the trait under study) cannot be avoided by slightly modifying its design and require to rely on a longitudinal design.
Table 2. Cross-sectional design with no cohort effect. In this table, three age groups are used but other ones could be used as well.
Cross-sectional design with no cohort effect
Date of experiment Young age Middle age Old age
Date 1 Cohort 1:
Subjects 1,2,3
Date 2 Cohort 2:
Subjects 1,2,3 Subjects 4,5,6Cohort 1:
Date 3 Cohort 2: Subjects 4,5,6 Cohort 1: Subjects 7,8,9 Date 4 Cohort 2: Subjects 7,8,9
Strengths and weaknesses of longitudinal designs
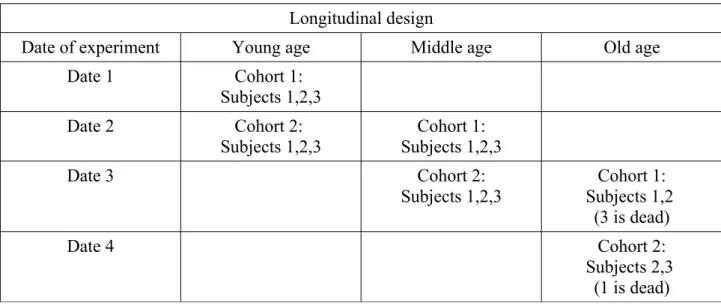
In a longitudinal study, subjects are observed several times during life (Table 3). In this way, only the effects of ageing are observed because they are not mixed with a possible survival linked to
the trait under study (Figure 1). A longitudinal design also makes it possible to specify individual trajectories of ageing. Finally, a longitudinal study allows to know, by keeping the animals until their death, whether the studied trait is linked with longevity. In such a case, the next question will be to know whether this is a correlation or a causal link. For instance, it has been hypothesised that flies die sooner if they are more active, because there is an inverse, causal, relationship between metabolism and lifespan (review in [6]): however, it does not seem that more active flies die sooner [7]. If there is no correlation with longevity, cross-sectional experiments could then be done, with a cohort followed at various ages or several cohorts observed at the same time (Tables 1 and 2), as cross-sectional studies are easier to perform than longitudinal ones. The fictitious longitudinal experiment shown in Figure 1 shows that ageing has no effect on the studied trait, but that it is linked with lifespan. Therefore, in this very case, the mean values at each age are fully misleading, as they do not represent the real effect of age.
Table 3. Longitudinal design. In this table, three age groups are used but other ones could be used as well.
Longitudinal design
Date of experiment Young age Middle age Old age
Date 1 Cohort 1:
Subjects 1,2,3
Date 2 Cohort 2:
Subjects 1,2,3 Subjects 1,2,3Cohort 1:
Date 3 Cohort 2: Subjects 1,2,3 Cohort 1: Subjects 1,2 (3 is dead) Date 4 Cohort 2: Subjects 2,3 (1 is dead)
An advantage of the longitudinal design is that the statistical analysis is expected to provide more significant results because a more powerful analysis (an analysis of variance for repeated measures for instance, or a t-test for related samples) than a between-groups analysis is now required. When the same animals are observed, say, at two ages, the difference between the two ages is not linked to the random difference between subjects, and there is a good chance that the score of Subject 1 at age 1 will be correlated with its score at age 2 (for instance, the weight of Subject 1 at age 2 is dependent on its weight at age 1). By contrast, when comparing different subjects at ages 1 and 2, the difference between the two observations is linked to the age but also to
the random difference between individuals (the weight of Subject 1 at age 1 is not linked to the weight of Subject 2 at age 2), and thus the age-linked difference is mixed with random differences between subjects.
A longitudinal study provides more information than a cross-sectional one, but it has also shortcomings. The first one is that a cohort is followed during life and that the observed effects of age may be specific to that cohort. Repeating the experiment with a second cohort can then be useful to verify that the same trends are observed (Cohort 2 in Table 3). The second issue is that the longitudinal design cannot be used if the measurement kills the subject, for instance recording heat survival time in flies or making a slice of brain tissue in mice. A third problem is that being subjected to the procedure at successive ages can modify the effects of age. For example, mice whose ability to build a cotton nest is observed in a longitudinal study maintain good scores as they age, while those tested in a cross-sectional study have lower scores with age [8]. In this study, the effect of age is thus only seen if mice are building a nest for the first time. By contrast, if they are offered the opportunity to build it at various ages, mice do not show any effect of age on this ability. The longitudinal design thus fails to display an effect of age, but it also shows that age impairments can be minimised, if not eliminated, if the subjects have some training experience. Combining a longitudinal study and a cross-sectional one allowed to reach this conclusion.
Cross-sectional and longitudinal designs have both shortcomings and advantages, and it cannot be said that one design is better than the other one. If both approaches can be used, the best compromise seems to perform a longitudinal study (is there a real age effect and a correlation with lifespan?) and a cross-sectional study (easier to perform than a longitudinal experiment). In human beings, this combination is known as the sequential design [1]. If longitudinal studies appear not to be of an obvious interest, only cross-sectional studies will probably be done in a next step. There are examples of animal studies that have compared the results of cross-sectional and longitudinal experiments to know whether they provided similar results [9, 10, 11].
However, using a cross-sectional or a longitudinal design is not the only decision before studying age-related changes. It is necessary to select the number of observed ages, and to really observe the trait one expects to observe.
How many observations during life?
Whatever a cross-sectional or a longitudinal design is selected, it is necessary to decide how many age groups will be used in the study. If only two age groups, such as young and old animals, are used to study ageing, the conclusion of the study can only be that the value of the trait increases, decreases or does not change with age. This would be a rather poor and maybe wrong conclusion,
and it is desirable to increase the number of observed ages to refine the conclusions. Three age groups is the minimal number to test whether the age effect is linear or not, with a possible maximum or minimum at middle age.
Ideally, a young age, an older age but when mortality is still low, the age at mean lifespan, and still an older age should be used. The second age group makes it possible to show an effect of age before the onset of mortality, i.e. without being biased by a possible survival linked to the trait under study, even in a cross-sectional study. The third group is generally used in all studies. The last group, often called the senescent group, shows the effects of age at a very advanced age, but the issue is that the number of survivors can decrease quickly during the study, which decreases the sample size. However, particularly in flies and nematodes, it is possible to use more age groups in longitudinal experiments studying behaviour, such as for instance the measurement of activity each week in flies [7], thrice a week in nematodes [12], or even throughout lifetime without any interruption in the fly Anastrepha ludens [13].
Are we really observing the trait we want to observe?
Measuring a trait in an animal implies that it can display it, but some needed abilities may be affected, the experimenter being unaware of this issue. The risk becomes important to conclude that a trait has been altered with age, whereas it only reflects, at least in part, the effect of age on another trait.
Several authors have reported that positive phototaxis decreases with age in Drosophila
melanogaster flies, i.e. that old flies are less attracted to light. For example [14], the authors
recorded the percentage of flies entering a lighted area in 10 seconds: this percentage decreased sharply with age and no fly was photopositive at oldest ages. By contrast, the effect of age was low, since the percentage of photopositive choices decreased from ca 90 % in young flies to 80 % in oldest ones, in another study [15] where flies had to choose between a lighted vial and a darkened one, without a time constraint to make the choice. In this latter study, the time to choose the vial increased with age, which shows that locomotor capacities decrease with age, a well-known result. This shows that the first experiment mainly observed the effects of age on reactive locomotor activity, flies having only 10 seconds to enter the lighted area, to the point that the results considered as showing an age-linked positive phototaxis decrease show mainly a slower speed with age.
Such an issue could also occur in rodents. In the Morris’ spatial learning task, an animal, placed in a large circular pool filled with opaque water, has to find an invisible submerged platform whose position is constant: the animal learns in a few trials to find the platform in order to escape
water. The distance crossed before finding the platform decreases more quickly in young animals than in old ones, and the latter therefore seem to learn less quickly. However, older rats less tolerate the temperature of the water (20-25 °C) and become hypothermic during the test [16]. It can thus be hypothesised that the learning task in the pool is more stressful for old rats than for young ones. In fact, if old rats are accustomed to a daily 30 °C bath for one month and then subjected to learning using 30 °C water, they correct some deficiencies compared to older animals not accustomed to this 30 °C bath and also tested in a 30 °C pool [17]. Caution should therefore be exercised before concluding that old rats learn less well than young ones, as a part of the differences seem not to be linked with learning ability.
These examples in flies and rats show that the effects of age on one trait can have an impact on the effects observed on another trait, this being possibly unknown to the experimenter.
The confusion between lifespan and aging
The following remarks mainly concern research on short-lived animal models such as
Caenorhabditis elegans nematodes and D. melanogaster, but not rodents whose high lifespan is
long and costly to measure (it is thus rare that studies on rodents only measure lifespan, but see [18]). These remarks are provided only because it may happen that some authors make a confusion between lifespan and ageing.
For species such as C. elegans and D. melanogaster, it is easy to record lifespan, whereas performing, for instance, behavioural experiments to observe age-related changes requires skills that are not necessarily mastered by the researcher. As a result, it may happen that articles report lifespan results and infer conclusions about ageing [19]. There is therefore a risk of confusion between the effects on lifespan, on the one hand, and on ageing, on the other hand. For example, an article is entitled “Propyl gallate delays senescence in Drosophila melanogaster” [20] and another one “A mutation in succinate dehydrogenase cytochrome b causes oxidative stress and ageing in nematodes” [21]. In these articles, the authors studied lifespan, but there is no result showing that animals aged more or less quickly.
In human beings, two persons dying at the same old age, say 90, may have experienced very different lives at old age, the first one having died during his jogging, and the second one being bedridden for several years. To use an analogy, life is like a movie: knowing the length of it does not give any information about its content and nobody would select the films to watch because of their length, a long movie being a good movie. It is the same with ageing and lifespan: knowing lifespan does not always give information on the physiological state of the animal at old age. Yet, this is the reasoning of some researchers when they measure lifespan and infer conclusions
regarding ageing. The good news is however that several authors stress that studies, particularly on flies, must take into account the physiological state of animals, and not only lifespan, and some studies report lifespan increases and lower behavioural aging, while other studies do not show such a relationship [22]. The behaviour describes how the animal lives, and other phenotypes, such as resistance to stress (heat, cold, starvation, desiccation, infection, oxidative stress, etc.), can characterise the physiological state of flies throughout their lifespan. For these studies too, it is inaccurate to conclude that a greater lifespan will equate a better resistance to stress since this is not always observed [23].
B.P. Yu (Ed.), Methods in aging research. Boca Raton, CRC Press, 1999, pp. 25-42.
2 R.H Salam, J.K Das, Z.A. Bhutta, Impact of intra-uterine growth restriction on long-term health, Current Opinion in Clinical Nutrition and Metabolic Care 17 (2014) 249-254.
3 F.A. Lints, C.V. Lints, P. Bullens, M. Bourgois, J. Delincé, Unexplained variations in life span of the Oregon-R strain of Drosophila melanogaster over a four-year period. Experimental Gerontology 24 (1989) 265-271.
4 L. Piantanelli, A. Zaia, G. Rossolini, A. Piantanelli, A. Basso, V.N. Anisimov, Long-live euthymic BALB/c-nu mice. I. Survival study suggests body weight as a life span predictor. Mechanisms of Ageing and Development 122 (2001) 463-475.
5 A.K. Brunet-Rossinni, S.N. Austad, Senescence in wild populations of mammals and birds, in: E.J. Masoro, S.N. Austad (Eds.), Handbook of the biology of aging, sixth edition. Burlington, Academic Press, 2006, pp. 243-266.
6 F.A. Lints, The rate of living revisited, Gerontology 35 (1989) 36-57.
7 E. Le Bourg, The rate of living theory. Spontaneous locomotor activity, aging and longevity in
Drosophila melanogaster, Experimental Gerontology 22 (1987) 359-369.
8 B.W. Marquette, C.W. Schneider, A longitudinal investigation of the effects of experience on the behavior of aging mice. Growth Development and Aging 55 (1991) 35-42.
9 E. Le Bourg, Alternation behavior, aging and longevity in Drosophila melanogaster: cross-sectional and longitudinal studies. Biology of Behaviour 12 (1987) 163-174.
10F. Dellu W. Mayo, M. Vallée, M. Le Moal, H. Simon, Facilitation of cognitive performance in
aged rats by past experience depends on the type of information processing involved: a combined cross-sectional and longitudinal study, Neurobiology of Learning and Memory 67 (1997) 121-128.
11S. Yanai, H. Okaichi, The effect of task experience, long-term dietary restriction and aging on performance in reference and working memory tasks: a longitudinal and cross-sectional design study. Psychologia 52 (2009) 13-24.
12S.A. Duhon, T.E. Johnson, Movement as an index of vitality: comparing wild type and the age-1 mutant of Caenorhabditis elegans, Journal of Gerontology, Biological Sciences 50A (1995) B254-B261.
13S. Zou, P. Liedo, L. Altamirano-Robles, J. Cruz-Enriquez, A. Morice, D.K.Ingram, K. Kaub, N. Papadopoulos, J.R. Carey, Recording lifetime behavior and movement in an invertebrate model, Plos One 6 (2011) e18151.
14R. Arking, R.A. Wells, Genetic alteration of normal aging processes is responsible for extended longevity in Drosophila. Developmental Genetics 11 (1990) 141-148.
15E. Le Bourg, J. Badia, Decline in photopositive tendencies with age in Drosophila melanogaster (Diptera: Drosophilidae). Journal of Insect Behavior 8 (1995) 835-845.
16M.D. Lindner, V.K. Gribkoff, Relationship between performance in the Morris water maze task, visual acuity, and thermoregulatory function in aged F-344 rats. Behavioural Brain Research 45 (1991) 45-55.
17T.R. Mabry, R. McCarty, P.E. Gold, T.C. Foster, Age and stress history effects on spatial performance in a swim task in Fischer-344 rats. Neurobiology of Learning and Memory 66 (1996) 1-10.
18A. Caratero, M. Courtade, L. Bonnet, H. Planel, C. Caratero, Effect of a continuous gamma irradiation at a very low dose on the life span of mice. Gerontology 44 (1998) 272-276.
19E. Le Bourg, F.A. Lints, N. Fresquet, P. Bullens, Review. Hypergravity, aging, and longevity in
Drosophila melanogaster. Comparative Biochememistry and Physiology A 105 (1993) 389-396.
20D.L. Ruddle, L.S. Yengoyan, J. Miquel, R. Marcuson, J.E. Fleming, Propyl gallate delays senescence in Drosophila melanogaster. Age 11 (1988) 54-58.
21N. Ishii, M. Fujii, P.S. Hartman, M. Tsuda, K. Yasuda, N. Senoo-Matsuda, S. Yanase, D. Ayusawa, K. Suzuki, A mutation in succinate dehydrogenase cytochrome b causes oxidative
22M.S. Grotewiel, I. Martin, P. Bhandari, E. Cook-Wiens, Functional senescence in Drosophila
melanogaster. Ageing Research Reviews 4 (2005) 372-397.
23S.E. Schriner, N.S. Katoozi, K.Q. Pham, M. Gazarian, A. Zarban, M. Jafari, Extension of
Drosophila lifespan by Rosa damascena associated with an increased sensitivity to heat.