Cytokine production from peripheral whole blood in atopic and nonatopic
asthmatics: relationship with blood and sputum eosinophilia and serum IgE
levels
J. Bettiol1, P. Bartsch1, R. Louis1, D. De Groote2, Y. Gevaerts2, E. Louis2, M. Malaise2 1Department of Pneumology, CHU Sart-Tilman, University of Liège, Liège
2
Inflammatory Disease Research Group, CHU Sart-Tilman, University of Liège, Liège, Belgium
Abstract
Background: The cytokine network is thought to be essential in orchestrating airway inflammation in asthma.
Although evidence has accumulated to suggest that atopic asthma is a Th2 disease, much less is known about nonatopic asthma.
Methods: We have compared the production of IL-4, IL-6, IFN-γ, and TNF-α from peripheral blood leukocytes
between atopic (n = 21) and nonatopic (n = 22) asthmatics and healthy nonatopic subjects (n = 20). Peripheral blood was incubated for 24 h either without stimulus or with LPS or PHA. Cytokines were measured by the immunotrapping technique (Dynamic Immunoassay).
Results: When compared to healthy nonatopic subjects, both atopic and nonatopic asthmatics showed increased
blood and sputum eosinophilia associated with raised total serum IgE levels. Similarly, both asthma groups displayed spontaneous, endotoxin-induced overproduction of IL-6. Enhanced spontaneous, endotoxin-induced release of IL-4 combined with reduced spontaneous IFN-γ production was seen only in atopic asthma. In this group of patients, the production of IL-4 was related to the extent of blood and sputum eosinophilia. In nonatopic asthmatics, serum levels of IgE were inversely related to the production of IFN-γ.
Conclusions: Both atopic and intrinsic asthma display raised blood and airway eosinophilia, raised total serum
IgE, and overproduction of IL-6 from peripheral blood. Atopic asthma is also characterized by impaired
spontaneous release of IFN-γ and increased production of IL-4 that correlates with the magnitude of eosinophilic inflammation.
Keywords : atopic and nonatopic asthma ; eosinophils ; IgE; interferon-γ ; interleukin-4 ; interleukin-6.
Atopic asthma is an airway eosinophilic bronchitis in which the inflammatory process seems to be governed by Th2 cytokines produced by T cells (1, 2). Also characteristic of atopic asthma is the peculiar commitment of B cells to produce IgE against aeroallergens. Although the majority of asthmatics seem to be atopic based on a positive skin prick test to common aeroallergens, there remain about one-third of asthmatics, called nonatopic or "intrinsic" asthmatics, in whom no sensitization to common aeroallergens can be identified (3-5). It is well recognized that eosinophilic inflammation is also a feature of nonatopic asthma (6). The immunologic profile in this type of asthma has been much less studied than in atopic asthma. Previous studies have shown that
overproduction of IL-5 by both peripheral blood mononuclear cells (PBMC) and BAL cells was characteristic of both atopic and nonatopic asthma (7, 8), whereas increased production of IL-4 was restricted to atopic asthma (7). However, other recent data based on in situ hybridization and immunohistochemistry techniques have challenged this initial view and have indicated increased IL-4 and IL-5 synthesis (9) together with an increased number of cells expressing the high-affinity IgE receptor (10) within the bronchial mucosa from both atopic and nonatopic asthmatics. These observations tend to support the view that both types of asthma share a similar immunologic disorder, and cast doubt on the view that "intrinsic" asthma is a distinct pathologic and immunologic entity.
Our purpose here was to assess the cytokine production from peripheral whole blood at the secreted protein level in nonatopic and atopic asthma by a one-stage technique. This technique allows us to detect the cytokines produced from whole blood as soon as they are released from leukocytes, thereby avoiding the confounding effect of any degradation after release (11). Moreover, using the whole blood instead of the PBMC also has the advantage of taking into account the granulocyte fraction, which is also likely to contribute to the pool of
cytokines released from leukocytes in vivo.
In this study, we have compared the production of IL-4, IL-6, TNF-α, and IFN-γ, a set of cytokines thought to be pertinent to asthma pathophysiology. In order to provide insights into the role of these cytokines in regulating the immunoinflammatory process in asthma, we have sought to determine the relationships between cytokine production and total serum IgE and sputum cell counts. While IFN-γ and IL-4 are regarded as key cytokines in regulating, in opposed ways the IgE production, as well as the balance between Th1 and Th2 lymphocytes (12), IL-6 is mainly viewed as a potent and nonspecific stimulating agent of B and T cells (13). As far as TNF-α is concerned, it is a potent and nonspecific inflammatory cytokine favoring the transendothe-lial passage of granulocyte as well as their tissular recruitment (14).
MATERIAL AND METHODS Subjects
Forty-three steroid-naive asthmatic subjects (21 with atopic asthma and 22 with intrinsic asthma) and 20 healthy nonatopic subjects, whose demographic and functional characteristics are shown in Table 1, participated in the study.
Asthma was diagnosed on the basis of a clinical history of recurrent wheeze, breathlessness, or cough associated with bronchial hyperresponsiveness to meth-acholine (PC20M< 16 mg/ml) or significant reversibility of FEV1 ( > 15% from baseline and at least > 200 ml) after inhalation of 400 µg salbutamol when baseline FEV1 was <80% predicted. Methacholine bronchial responsiveness was determined by a modification of Cockcroft's method, as previously described (15).
Atopy was defined by positive skin prick tests (wheal diameter of ≤ 3 mm when compared to control saline) to common aero allergens including house-dust mites; cat and dog dander; grass, tree, and weed pollens; and molds (Stallergenes, Antony, France). Thus, nonatopic or "intrinsic" asthmatics were those patients with negative skin prick tests to common aeroallergens.
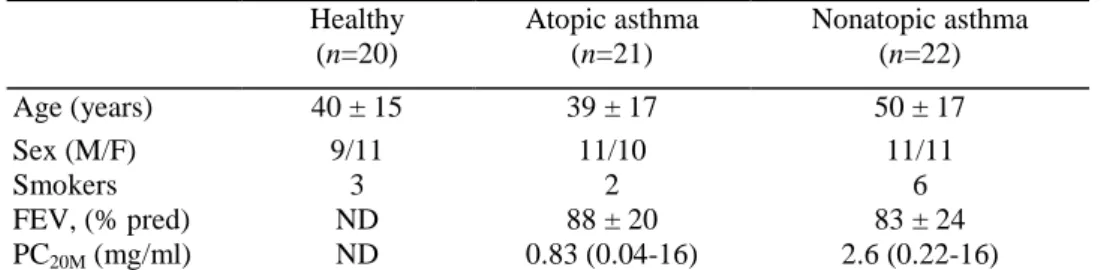
Table 1. Subjects' clinical characteristics
Healthy (n=20) Atopic asthma (n=21) Nonatopic asthma (n=22) Age (years) 40 ± 15 39 ± 17 50 ± 17 Sex (M/F) 9/11 11/10 11/11 Smokers 3 2 6 FEV, (% pred) ND 88 ± 20 83 ± 24 PC20M (mg/ml) ND 0.83 (0.04-16) 2.6 (0.22-16)
Results of age and FEV, are expressed as mean + SD, and those of PC20M are expressed as geometric mean (range).
PC20M was measured only when FEV, was >70% pred.
Sputum induction and processing
Sputum was induced by inhalation of hypertonic saline aerosols delivered by an ultrasonic nebulizer (Ultra-Neb 2000, De Vilbiss) with an output set at 1.5 ml/min. After a premedication with 400 µg salbutamol, the subjects inhaled the aerosol for three consecutive periods of 5 min for a total inhalation time of 15 min. Peak expiratory flow rate was measured after each 5-min inhalation period (Mini-Wright). If the asthmatic patients had a baseline PEF of < 250 l/min, they inhaled isotonic saline (NaCl 0.9%) instead.
The whole sputum was collected in a plastic container, weighed, and homogenized by adding an equal weight of 7 mM dithitreitol (DTT) (Sigma, St Louis, MO, USA) for 30 min at room temperature. The sample was then further processed as previously described (16), and the differential calculated from cytospins stained with Diff-Quick.
Peripheral blood cell counts and serum IgE
Peripheral blood samples were collected in apyrogenic, heparinized tubes (Vacutainer; Becton Dickinson, Mountain View, CA, USA). The total and differential blood cell counts were obtained for each blood sample with a Technicon Al automatic counter (Bayer Diagnostics, Wemmel, Belgium). Counting and cell typing were based on flow cytometry, with bidimensional volume distribution, peroxidase concentration, and lobularity of leukocytes as parameters.
Commercial assays were used for measurement of serum total IgE antibody by fluorometric enzyme immunoassay (FEIA) (UniCAP System, Pharmacia).
Cytokine assays
Cytokines were measured by a modified one-step culture immunoassay procedure, as previously described (17). Briefly, 25 µl of whole blood or 25 µl of cytokine standards (IL-4, IL-6, IFN-γ, or TNF-α) was put in sterile and pyrogen-free microwells coated with mAbs against the cytokines (Biosource Europe, Fleurus, Belgium) and containing 200 µl of RPMI (Biowittaker, Verviers, Belgium), LPS (Salmonella entendis, Sigma, St Louis, MO, USA) (100 ng/ml for IL-4 and IFN-γ, 100 pg/ml for IL-6 and 1 ng/ml for TNF-α), or phyto-hemagglutinin (PHA HA16, Wellcome Diagnostic, Dartford, UK) (10 µg/ml for IL-4 and IFN-γ, 1 µg/ml for IL-6 and TNF-α). The microwells were capped and incubated at 37°C for 24 h to allow the immunocapture of the produced cytokines. The caps were then removed and the wells washed intensively to remove unbound cytokines. Horseradish peroxidase (HRP) anticytokine conjugate mAb (Biosource Europe) was then added to the wells for a determined time (according to the cytokine studied) at room temperature with continuous shaking. After washing, 100 µl chromogen solution (TMP) was added to each well, and the plates were incubated at room temperature with continuous shaking. A volume of 200 µl stop solution (H2SO4) was added to each well. The color intensity determined by the absorbency at 450 nm being proportional to the cytokine concentration in the sample, the exact cytokine concentration in each sample was then calculated by interpolation from the standard curve.
The results of cytokine production were normalized by dividing the actual values by the number of leukocytes present in the whole blood samples, and expressed as a concentration of 2.5 × 10⁴ leukocytes. Stimulated cytokine production was calculated by substracting the spontaneous production from that measured with LPS or PHA.
Statistical analysis
Blood and sputum cell counts as well as IgE and cytokine levels were expressed as median (range) and compared between nonatopic and atopic asthmatics and healthy subjects by the Kruskal-Wallis test. In case of significance, pairwise comparisons were made by Dunn's test. As far as spontaneous release of IL-4 is concerned, we used Fisher's exact test to compare the frequency of detectable IL-4 between the groups. The correlations between cytokine production and sputum or blood cell counts and serum IgE were assessed by Spearman rank correlation.
P values <0.05 were taken as statistically significant.
RESULTS
Serum IgE, blood, and sputum cell counts
Serum IgE levels in atopic and nonatopic asthmatics were higher than those found in healthy subjects (P<0.05), without any significant difference between the two types of asthma. Similarly, atopic and nonatopic asthmatics had higher blood eosinophil counts than healthy subjects (P<0.05) without difference between the two groups of asthmatics (Table 2).
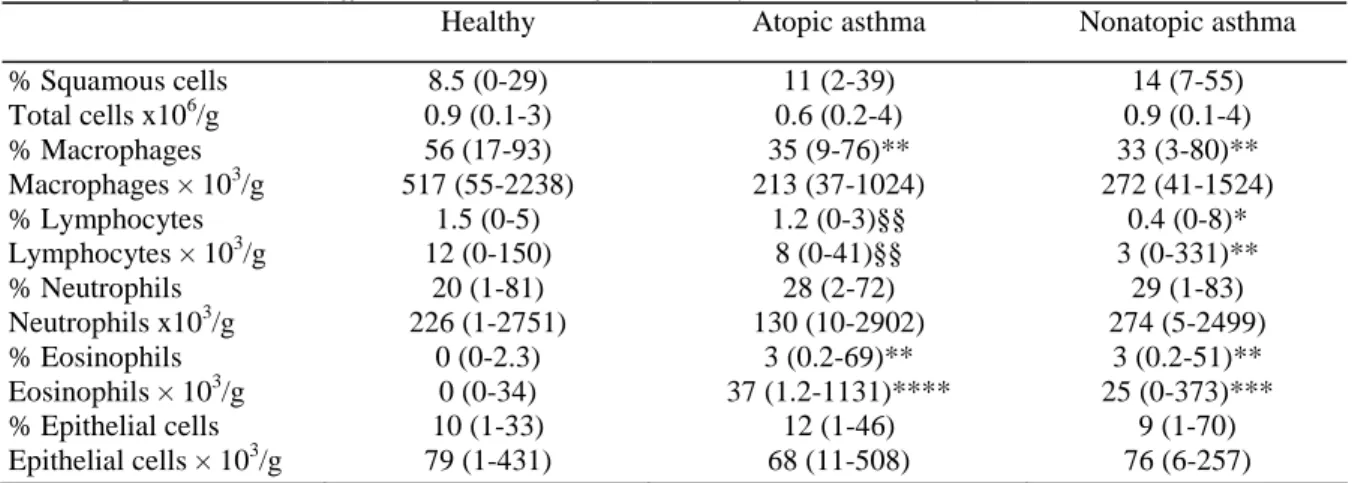
When compared to healthy subjects, both intrinsic and atopic asthma patients had increased sputum absolute and relative eosinophil counts (P<0.01) but a reduced sputum relative macrophage count (P < 0.01). The relative and absolute number of sputum lymphocytes were lower in nonatopic asthma than in atopic asthma (P<0.01) and healthy subjects (P<0.05) (Table 3).
Table 2. Blood total and differential cell counts and serum IgE from healthy and asthmatic subjects
Healthy Atopic asthma Nonatopic asthma
WBC(103/µl) 6.58 ± 2.1 7.11 ± 1.45 7.08 ± 1.84 Monocytes (103/µl) 0.45 ± 0.39 0.51 ± 0.22 0.43 ± 0.24 Lymphocytes (103/µl) 2.31 ± 0.48 2.10 ± 0.45 2.14 ± 0.53 Neutrophils (103/µl) 3.70 ± 1.40 4.10 ± 1.15 4.19 ± 1.68 Eosinophils (103/µl) 0.06 ± 0.04 0.31 ± 0.21* 0.27 ± 0.34* Basophils (103/µl) 0.06 ± 0.09 0.07 ± 0.2 0.05 ± 0.08 IgE (kU/l) 8 (<3.5-34) 78 (< 3.5-1514)* 35 (< 3.5-900)*
Results are expressed as mean ± SD except those of IgE, which are expressed as geometric mean (range). Asterisk indicates significant difference vs healthy: P <0.05.
Table 3. Sputum total and differential cell counts from healthy and asthmatic subjects
Healthy Atopic asthma Nonatopic asthma
% Squamous cells 8.5 (0-29) 11 (2-39) 14 (7-55) Total cells x106/g 0.9 (0.1-3) 0.6 (0.2-4) 0.9 (0.1-4) % Macrophages 56 (17-93) 35 (9-76)** 33 (3-80)** Macrophages × 103/g 517 (55-2238) 213 (37-1024) 272 (41-1524) % Lymphocytes 1.5 (0-5) 1.2 (0-3)§§ 0.4 (0-8)* Lymphocytes × 103/g 12 (0-150) 8 (0-41)§§ 3 (0-331)** % Neutrophils 20 (1-81) 28 (2-72) 29 (1-83) Neutrophils x103/g 226 (1-2751) 130 (10-2902) 274 (5-2499) % Eosinophils 0 (0-2.3) 3 (0.2-69)** 3 (0.2-51)** Eosinophils × 103/g 0 (0-34) 37 (1.2-1131)**** 25 (0-373)*** % Epithelial cells 10 (1-33) 12 (1-46) 9 (1-70) Epithelial cells × 103/g 79 (1-431) 68 (11-508) 76 (6-257)
Results are expressed as median (range).
* Significant difference vs healthy; * P<0.05, ** P<0.01, *** P<0.001, and **** P<0.0001. § Significant difference vs intrinsic asthma; §§ P<0.01.
IL-4, IL-6, IFN-γ, and TNF-α production from whole blood
The detailed results are given in Table 4. Spontaneous release of IL-4 was detectable in 8/21 atopic asthmatics vs 0/20 healthy subjects (P<0.01) and 2/22 nonatopic asthmatics. When blood cells were stimulated by LPS, IL-4 release was increased in atopic asthmatics when compared to both nonatopic asthmatics (P<0.05) and healthy subjects (P<0.01) (Fig. 1). The differences between the groups failed to reach statistical significance when the cells were stimulated with PHA.
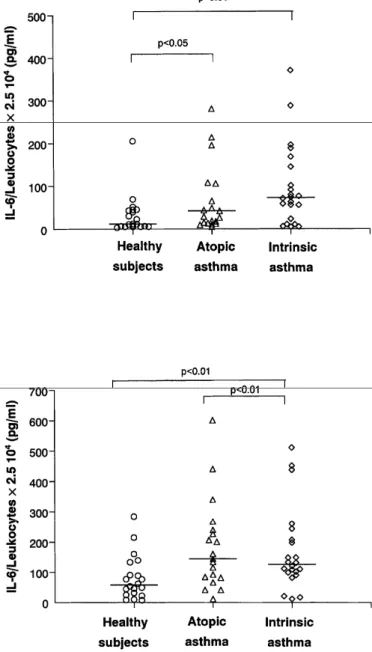
There was an increased spontaneous production of IL-6 in both atopic and nonatopic asthmatics when compared to healthy subjects (P<0.05 and P<0.01 respectively) (Fig. 2). Similar differences between the three groups were also found when the cells were stimulated with LPS (P<0.01), but not with PHA.
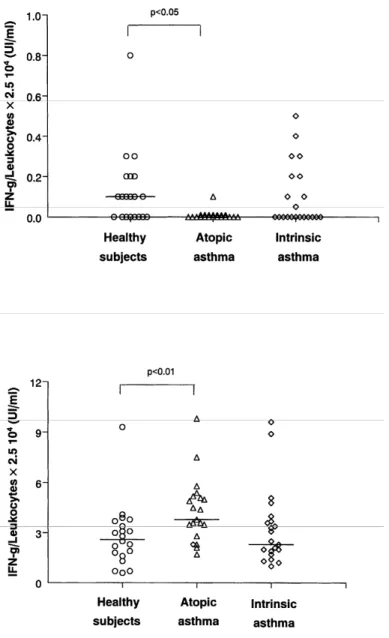
Spontaneous production of IFN-γ was reduced only in atopic asthmatics when compared to healthy subjects (P<0.05), but this impaired production was no longer observed when the cells were stimulated by LPS or PHA, a circumstance under which atopic asthmatics released more IFN-γ than healthy subjects (P<0.01) (Fig. 3).
There was no significant difference between the three groups with respect to the amount of TNF-α produced either spontaneously or after blood-cell stimulation (Table 4).
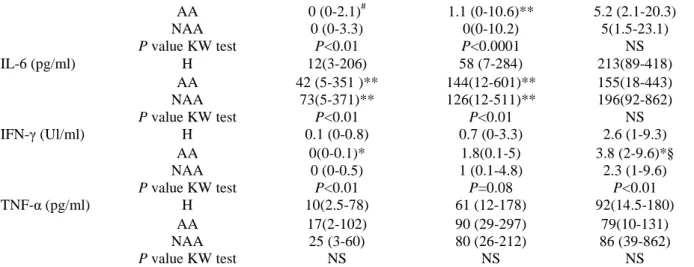
Table 4. Release of cytokines from peripheral whole blood of healthy and asthmatic subjects
Stimulus
Cytokines Groups Spontaneous LPS PHA
AA 0 (0-2.1)# 1.1 (0-10.6)** 5.2 (2.1-20.3) NAA 0 (0-3.3) 0(0-10.2) 5(1.5-23.1) P value KW test P<0.01 P<0.0001 NS IL-6 (pg/ml) H 12(3-206) 58 (7-284) 213(89-418) AA 42 (5-351 )** 144(12-601)** 155(18-443) NAA 73(5-371)** 126(12-511)** 196(92-862) P value KW test P<0.01 P<0.01 NS IFN-γ (Ul/ml) H 0.1 (0-0.8) 0.7 (0-3.3) 2.6 (1-9.3) AA 0(0-0.1)* 1.8(0.1-5) 3.8 (2-9.6)*§ NAA 0 (0-0.5) 1 (0.1-4.8) 2.3 (1-9.6) P value KW test P<0.01 P=0.08 P<0.01 TNF-α (pg/ml) H 10(2.5-78) 61 (12-178) 92(14.5-180) AA 17(2-102) 90 (29-297) 79(10-131) NAA 25 (3-60) 80 (26-212) 86 (39-862) P value KW test NS NS NS
Results are expressed as median (range).
H: healthy subjects; AA: atopic asthmatics; IA: intrinsic asthmatics. KW test: Kruskal-Wallis test.
# Significance vs healthy; # P<0.01 (Fisher's exact test).
* Significance vs healthy; * P<0.05, ** P<0.01. § Significance between atopic and intrinsic asthma; § P<0.01.
Figure 1. Spontaneous (top) and LPS 100 ng/ml (bottom)-induced production of IL-4 by peripheral whole blood
Figure 2. Spontaneous (top) and LPS 100 pg/ml (bottom)-induced production of IL-6 by peripheral whole blood
Figure 3. Spontaneous (top) and PHA 10 µg/ml (bottom)-induced production of IFN-γ by peripheral whole
blood in healthy nonatopic subjects, and atopic and intrinsic asthmatics.
Relationship between cytokine production and blood and sputum eosinophil counts, serum IgE, and functional parameters
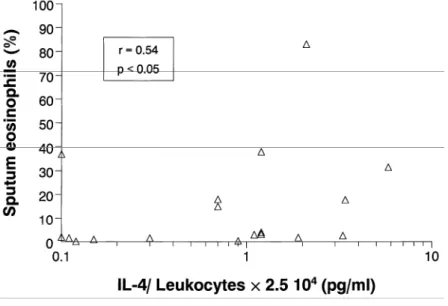
In atopic asthmatics, LPS-induced IL-4 release was significantly correlated with blood and sputum (Fig. 4) eosinophil counts (r = 0.62, P<0.01 and r = 0.54, P< 0.05, respectively), but not with serum IgE (r = 0.06,
P>0.05). In nonatopic asthmatics, blood and sputum eosinophil counts failed to correlate with any cytokine.
However, in these patients, serum IgE was inversely correlated with the magnitude of IFN-γ produced after stimulation with LPS (r = -0.57, P< 0.01) (Fig. 5) or PHA (r = -0.50, P<0.05).
As far as lung-function parameters are concerned, LPS-induced release of IL-4 was inversely related to PC20 methacholine in atopic asthma (r = -0.51, P< 0.05) while LPS-induced IFN-γ was proportional to FEV1 in nonatopic asthma (r = 0.56, P<0.01).
Figure 4. Relationship between LPS-induced IL-4 production from peripheral whole blood and sputum
eosinophil counts in atopic asthmatics.
Figure 5. Relationship between LPS-induced IFN-γ from peripheral whole blood and serum IgE in intrinsic
asthmatics.
DISCUSSION
An increase in blood and sputum eosinophils as well as in serum IgE is a feature of both atopic and nonatopic asthmatics. Both groups are also characterized by an increased production of IL-6 from peripheral whole blood. However, atopic asthmatics display an overproduction of IL-4 associated with impaired baseline release of IFN-γ not found in nonatopic asthma. In addition, the release of IL-4 in atopic asthma is proportional to the extent of eosinophilic inflammation, while the production of IFN-γ in nonatopic asthma is inversely related to serum IgE levels.
Our finding of increased blood and sputum eosinophilia in nonatopic asthma illustrates the established fact that eosinophilic inflammation is a feature of asthma irrespective of the presence of atopy (6). Similarly, in
agreement with previous reports (17-19), we found raised total serum IgE in both atopic and nonatopic
asthmatics, although the latter had no sign of IgE-mediated sensitization to common aeroallergens, as shown by negative skin prick tests. In this study, we reported for the first time that both "intrinsic" and atopic asthmatics exhibited an increased production of IL-6 either spontaneously or after stimulation with LPS. This reinforces
previous data showing that the PBMC from sensitized atopic subjects released more IL-6 than nonatopic control subjects when challenged in vitro with a specific allergen (20). IL-6 acts as a potent stimulus of lymphocyte proliferation, which is likely to be an essential event in the development and maintenance of an immune
disorder. Therefore, it is worth noting that circulating levels of IL-6 were shown to correlate with disease activity in asthma (21) and also to predict relapse in quiescent Crohn's disease, another mucosal inflammatory disease (22). In addition to favoring a sustained lymphocyte-derived inflammatory process, overproduction of IL-6 may also specifically contribute to the increased IgE synthesis, as has been demonstrated in vitro (19, 23). Thus, the enhanced production of IL-6 might be one indicator of the raised total serum IgE seen in intrinsic asthmatics.
In stark contrast to 6, 4 overproduction appears to be restricted to the atopic group, since the amount of IL-4 produced in the nonatopic asthma group was not different from that found in control subjects, although two out of the 22 nonatopic asthmatics were clearly outliers and displayed levels of IL-4 production close to those observed in atopic patients. Due to its rapid breakdown and consumption by other cells, measuring the
spontaneous production of IL-4 from whole blood (personal data) or PBMC (24, 25) has proved to be difficult by conventional ELISA.
Thanks to our model allowing detection of the cytokine as soon as it is produced, we have been able to show that blood leukocytes from atopic asthmatics released more IL-4 than those from control subjects, either
spontaneously or after stimulation with endotoxin. Obviously, our model does not allow us to determine precisely which cell type is involved, as not only lymphocytes, but also basophils (26) and even eosinophils (27) were found to be able to release IL-4 in vitro. However, we believe that the global cytokine production obtained in a complex and natural milieu is an important parameter to be taken into account in elucidation of the events occurring in vivo. The raised IL-4 production in atopic asthma confirms the Th2 profile supposed to be crucial in regulating airway inflammation in asthma. The role of IL-4 in asthma has been classically devoted to IgE production. However, we did not find any relationship between total serum IgE and IL-4 production in our atopic subjects. In contrast, we found here a strong correlation between either spontaneous or endotoxin-induced IL-4 production and the extent of blood and sputum eosinophilic inflammation. The correlation between blood eosinophil counts and IL-4 production from leukocytes of atopic asthmatics might indicate that eosinophils are a potent source of IL-4 in these patients. Alternatively, this relationship might reflect an enhanced eosinophil transendothelial migration as a result of IL-4-induced VCAM-1 endothelial expression (28). Our observation fits the animal data showing the inability to mount an allergen-induced airway eosinophilia in IL-4 knockout mice (29). It is also in line with the recent data demonstrating that IL-4 antisense oligonucleotide prevents the occurrence of a CD4 T-cell-driven late asthmatic reaction associated with BAL eosinophilia in an animal model (30). Whatever the underlying mechanisms, our data point to an association between the extent of eosinophilic inflammation and the magnitude of IL-4 production in atopic asthmatics.
It is striking that spontaneous production of IFN-γ was reduced in atopic, but not in intrinsic, asthmatics when compared to control subjects. This is perfectly in line with previous data indicating that a deficient production of IFN-γ is a crucial event in moving the cytokine network toward the Th2 profile in atopy (2, 12). However, the deficiency in IFN-γ release from blood leukocytes of atopic asthmatics was no longer observed when the cells were stimulated with endotoxin or PHA, circumstances under which blood leukocytes from atopic asthmatics release greater amounts of IFN-γ than those of healthy subjects. If we assume that airway leukocytes can be exposed to environmental endotoxin, this might explain why some studies reported raised expression (31) or secretion of IFN-γ (32) within the airways of atopic asthma. Thus, leukocyte behavior in terms of IFN-γ release in atopic asthma might be critically dependent on the cell microenvironment. As whole blood is a relatively protected milieu when compared to mucosa, we believe that looking at cytokine production from peripheral blood leukocytes rather than from airways might better indicate the basic and probably genetically derived dysregulation in cytokine production.
It is also worth noting that, although not decreased when compared to control subjects, the magnitude of IFN-γ secretion in nonatopic asthma was inversely correlated to the serum levels of IgE. Thus, it seems that, in the context of an increased production of IL-6, those intrinsic asthmatics with a poor IFN-γ production are prone to synthesize a large amount of IgE, which is, however, not directed toward the classical aeroallergens such as mite, cat, or pollens.
Finally, no difference could be found between the groups with respect to TNF-α production irrespective of the type of leukocyte stimulation. This indicates that altered release of TNF-α is not a basic abnormality in asthma. This obviously does not mean that once recruited within the airways, leukocytes from asthmatics may not generate larger amounts of TNF-α, as was shown by Cembrzynska-Novack et al. (32).
nonatopic asthma, while the overproduction of IL-4 and, under certain circumstances, the deficiency in IFN-γ are found in the atopic group. Our results also reveal the link between eosinophilic inflammation and IL-4
production. Overall, if they confirm the existence of a Th2 pattern in atopic asthma, our data also support the concept of an immunologic heterogeneity among asthmatics according to their propensity to mount an IgE response to common aeroallergens.
Acknowledgment
This work was supported by grant No. 3453697 from the Fond de Recherche Scientifique Médicale (FRSM).
References
1. BOUSQUET J, CHANEZ P, LACOSTE J, et al. Eosinophilic inflammation in asthma. N Engl J Med 1990;323:1033-1039. 2. KAY AB. Th2-type cytokines in asthma. Ann N Y Acad Sci 1996;796:1-8.
3. RACKEMAN FM. A working classification of asthma. Am J Med 1947;3:601-606.
4. GODARD D, BOUSQUET J, MICHEL FB. Extrinsic and intrinsic asthma: still a matter of debate? Clin Asthma Rev 1997;1:19-22. 5. WÜTHRICH B, SCHINDLER C, LEUENBER P, ACKERMAN-LIEBRICH U. Prevalence of atopy and pollinosis in the adult population of Swizerland (SAPALDIA Study). Swiss Study on Air Pollution and Lung Diseases in Adults. Int Arch Allergy Immunol 1995;106:149-146. 6. MENZ G, YING S, DURHAM SR, et al. Molecular concepts of IgE-initiated inflammation in atopic and nonatopic asthma. Allergy 1998;53:15-21.
7. WALKER C, BODE E, BOER L, HANSEL TT, BLASER K, VIRCHOW JC. Allergic and nonallergic asthmatics have distinct pattern of T cell activation and cytokine production in peripheral blood and BAL. Am Rev Respir Dis 1992;146:109-115.
8. TANG C, ROLLAND JM, WARD C, QUAN B, WALTERS EH. IL-5 production by bronchoalveolar lavage and peripheral blood mononuclear cells in asthma and atopy. Eur Respir J 1997;10:624-632.
9. HUMBERT M, DURHAM S, YING S, et al. IL-4 and IL-5 mRNA and protein in bronchial biopsies from patients with atopic and nonatopic asthma: evidence against "intrinsic" asthma being a distinct immunopathologic entity. Am J Respir Crit Care Med 1996;154:1497-1504. 10. HUMBERT M, GRANT A, TABORDA-BARATA L, et al. High-affinity IgE receptor (FcεRI)-bearing cells in bronchial biopsies from atopic and nonatopic asthma. Am J Respir Crit Care Med 1996;153:1931-1937.
11. DE GROOTE D, GEVAERTS Y, LOPEZ M, et al. Novel method for the measurement of cytokine production by a one-stage procedure. J Immunol Methods 1993;163:259-267.
12. MOSMAN TR, COFFMAN RL. Thl and Th2 cells: different patterns of lymphokine secretion lead to different functional properties. Ann Rev Immunol 1989;7:145-173.
13. KISHIMOTO T. The biology of IL-6. Blood 1989;74:1-10.
14. KIPS JC, TAVERNIER JH, JOOS GF, PELEMAN RA, PAUWELS RA. The potential rôle of tumor necrosis factor α in asthma. Clin Exp Allergy 1993;23:247-250.
15. Louis R, BURY T, CORHAY JL, RADERMECKER M. NO increase in plasma histamine during PAF induced bronchoconstriction in allergic asthmatics. Chest 1993;104:806-810.
16. Louis R, SHUTE J, BIAGI S, et al. Cell infiltration, ICAM-1 expression and eosinophil chemotactic activity in asthmatic sputum. Am J Respir Crit Care Med 1997;155:466-472.
17. BURROWS B, MARTINEZ FD, HALONEN M, BARBEE RA, CLINE MG. Association of asthma with serum IgE levels and skin-test reactivity to allergens. N Engl J Med 1989;320:271-277.
18. SUNYER J, ANTO JM, CASTELLSAGUE JB, SORIANO JB, ROCA J and the Spanish Group of the European Study of Asthma. Eur Respir J 1996;9:1880-1884.
19. SANCHEZ-GUERRERO IM,HERRERO N, MURO M, et al. Co-stimulation of cultured peripheral blood mononuclear cells from intrinsic asthmatics with exogenous recombinant IL-6 produce high levels of IL-4 dependent IgE. Eur Respir J 1997;10:2091-2096.
20. MCHUGH SM, WILSON AB, DEIGHTON J, LACHMAN PJ, EWAN PW. The profiles of interleukin (IL)-2, IL-6 and interferon-gamma production by peripheral blood mononuclear cells from house dust mite allergic patients: a role for IL-6 in allergic disease. Allergy 1994;49:751-759.
21. YOKOYAMA A, KOHNO N, FUJINO S, et al. Circulating interleukin-6 levels in patient with bronchial asthma. Am J Respir Crit Care Med 1995;151:1354-1358.
22. Louis E, BELAICHE J, VAN KEMSEKE C, et al. A high serum concentration of interleukin-6 is predictive of relapse in quiescent Crohn's disease. Eur J Gastroenterol Hepatol 1997;9:939-944.
23. VERCELLI D, JABARA HH, ARAI K-I, YOKOTA T, GEHA RS. Endogenous interleukin-6 plays an obligatory role in interleukin-4 dependent human IgE synthesis. Eur J Immunol 1989;19:1419-1424.
24. GAGNON R, AKOUM A, HEBERT J. Loi p I-induced IL-4 and IFN-γ production by peripheral blood mononuclear cells of atopic and nonatopic subjects during and out of the pollen season. J Allergy Clin Immunol 1993;91:950-956.
25. TANG C, ROLLAND J, WARD C, BISCH R, THIEN F, WALTERS EH. Seasonal comparison of cytokine profiles in atopic asthmatics and atopic nonasthmatics. Am J Respir Crit Care Med 1996;154:1615-1622.
26. BRUNNER T, HEUSSER CH, DAHINDEN CA. Human peripheral blood basophils primed by interleukin 3 produce IL-4 in response to immunoglobulin E receptor stimulation. J Exp Med 1993;177:605-611.
27. NONAKA M, NONAKA R, WOOLEY K, et al. Distinct immunohistochemical localization of IL-4 in human inflamed airway tissues. IL-4 is localized to eosinophils in vivo and released by peripheral blood eosinophils. J Immunol 1995;155:3234-3244.
28. THORNHILL MH, WELLICOME SM, MAHIOUZ DL, LANCHBURY JS, KYAN-AUNG U, HASKARD DO. Tumor necrosis factor combines with IL-4 or IFN-γ to selectively enhance endothelial cell adhesiveness for T cells. The contribution of vascular cell adhesion molecule-1-dependent and -inmolecule-1-dependent mechanisms. J Immunol 1991;146:592-598.
29. BRUSELLE G, KIPS J, Joos G, BLUETHMANN H, PAUWELS R. Allergen-induced airway inflammation and bronchial responsiveness in wild type and interleukin-4-deficient mice. Am J Respir Cell Mol Biol 1995;12:254-259.
30. MOLET S, RAMOS-BARBON D, MARTIN JG, HAMID Q. Adoptively transferred late allergic response is inhibited by IL-4, but not IL-5, antisense oligonucleotide. J Allergy Clin Immunol 1999;104:205-214.
31. KRUG N, MADDEN J, REDINGTON A, et al. T-cell cytokine profile evaluated at the single cell level in BAL and blood in allergic asthma. Am J Respir Cell Mol Biol 1996;14:319-326.
32. CEMBRZYNSKA-NOWACK M, SZKLARK E, INGLOT AD, TEODORCZYK-INJEYAN JA. Elevated release of tumor necrosis factor-alpha and interferon-gamma by bronchoalveolar leukocytes from patients with bronchial asthma. Am Rev Respir Dis 1993;147:291-295.
![Astrocyte IP3R2-dependent Ca[superscript 2+] signaling is not a major modulator of neuronal pathways governing behavior](data:image/gif;base64,R0lGODlhAQABAIAAAP///wAAACH5BAEAAAAALAAAAAABAAEAAAICRAEAOw==)