HAL Id: hal-03004159
https://hal.archives-ouvertes.fr/hal-03004159
Submitted on 13 Nov 2020
HAL is a multi-disciplinary open access
archive for the deposit and dissemination of
sci-entific research documents, whether they are
pub-lished or not. The documents may come from
teaching and research institutions in France or
abroad, or from public or private research centers.
L’archive ouverte pluridisciplinaire HAL, est
destinée au dépôt et à la diffusion de documents
scientifiques de niveau recherche, publiés ou non,
émanant des établissements d’enseignement et de
recherche français ou étrangers, des laboratoires
publics ou privés.
Distributed under a Creative Commons Attribution| 4.0 International License
Mechanical and molecular parameters that influence the
tendon differentiation potential of C3H10T1/2 cells in
2D- and 3D-culture systems
Delphine Duprez, Ludovic Gaut, Marie-Ange Bonnin, Cédrine Blavet, Isabelle
Cacciapuoti, Monika Orpel, Mathias Mericskay
To cite this version:
Delphine Duprez, Ludovic Gaut, Marie-Ange Bonnin, Cédrine Blavet, Isabelle Cacciapuoti, et al..
Mechanical and molecular parameters that influence the tendon differentiation potential of C3H10T1/2
cells in 2D- and 3D-culture systems. Biology Open, Royal Society, 2020, 9, �10.1242/bio.047928�.
�hal-03004159�
RESEARCH ARTICLE
Mechanical and molecular parameters that influence the tendon
differentiation potential of C3H10T1/2 cells in 2D- and 3D-culture
systems
Ludovic Gaut1, Marie-Ange Bonnin1, Cédrine Blavet1, Isabelle Cacciapuoti2, Monika Orpel1, Mathias Mericskay3
and Delphine Duprez1,*
ABSTRACT
One of the main challenges relating to tendons is to understand the regulators of the tendon differentiation program. The optimum culture conditions that favor tendon cell differentiation have not been identified. Mesenchymal stem cells present the ability to differentiate into multiple lineages in cultures under different cues ranging from chemical treatment to physical constraints. We analyzed the tendon differentiation potential of C3H10T1/2 cells, a murine cell line of mesenchymal stem cells, upon different 2D- and 3D-culture conditions. We observed that C3H10T1/2 cells cultured in 2D conditions on silicone substrate were more prone to tendon differentiation, assessed with the expression of the tendon markers Scx, Col1a1 and Tnmd as compared to cells cultured on plastic substrate. The 3D-fibrin environment was more favorable for Scx and Col1a1 expression compared to 2D cultures. We also identified TGFβ2 as a negative regulator of Tnmd expression in C3H10T1/2 cells in 2D and 3D cultures. Altogether, our results provide us with a better understanding of the culture conditions that promote tendon gene expression and identify mechanical and molecular parameters upon which we could act to define the optimum culture conditions that favor tenogenic differentiation in mesenchymal stem cells.
KEY WORDS: Mesenchymal stem cells, Cell confluence, cell cultures, Plastic substrate, Silicone substrate, Tendon differentiation, TGFβ2, Scleraxis, Tenomodulin
INTRODUCTION
Mesenchymal stem cells (MSCs) are multipotent cells that can be induced to differentiate in various tissue lineages upon specific molecular or mechanical cues. Based on specific lineage markers and identified master genes, established protocols are now recognized to drive differentiation towards osteocytes, chondrocytes and adipocytes (Caplan, 1991; Pittenger et al., 1999; Prockop, 1997). Although studies identify tendon cell
differentiation upon molecular and mechanical cues from MSCs (reviewed in Nourissat et al., 2015; Zhang et al., 2018), tendon lineage is less studied than other tissue-specific lineages. There is no recognized/established protocol with external inducers to differentiate MSCs towards a tendon phenotype. In addition, there is no identified master gene that initiates the tenogenic program in cell cultures as for the cartilage (Sox9), bone (Runx2) and muscle (muscle regulatory factors) programs (Buckingham, 2017; Karsenty et al., 2009; Liu et al., 2017).
Another difficulty in studying tendon differentiation is the limited number of specific tendon markers. The main structural and functional component of the tendon, type I collagen, is not specific to the tendon and is expressed in many other connective tissues (reviewed in Gaut and Duprez, 2016). To date, the bHLH transcription factor Scleraxis (Scx) is the best marker for tendons and ligaments during development (Schweitzer et al., 2001, 2010) and in the adult (Mendias et al., 2012). Although it is a powerful tendon marker, the exact function of Scx in tendon development, homeostasis and repair is still not fully understood (Huang et al., 2015; Murchison et al., 2007). The type II transmembrane glycoprotein tenomodulin, encoded by the Tnmd gene, is recognized to be a tendon differentiation marker with potential roles in tenocyte proliferation and differentiation in addition to type I collagen fibril adaptation to mechanical loads (Alberton et al., 2015; Dex et al., 2016, 2017; Docheva et al., 2005). Scx is required for Tnmd expression in mouse tendons during development (Murchison et al., 2007; Yoshimoto et al., 2017). Scx gain- and loss-of-function experiments combined with electrophoresis mobility shift assay (EMSA) in cell cultures indicate a direct regulation of Scx on Tnmd promoter (Shukunami et al., 2018; Yoshimoto et al., 2017). In addition to the well-studied tendon markers, Scx and Tnmd, a list of 100 tendon markers has been identified in limb tendon cells during mouse development via transcriptomic analysis (Havis et al., 2014).
The main extracellular signal known to promote tendon development is the TGFβ ligand (Havis et al., 2014, 2016; Maeda et al., 2011; Pryce et al., 2009). TGFβ ligands are recognized to have a generic tenogenic effect based on the increase of Scx transcription in cell cultures (Guerquin et al., 2013; Havis et al., 2014, 2016; Lorda-Diez et al., 2009; Pryce et al., 2009). The increase of Scx expression upon TGFβ2 exposure is abolished in the presence of TGFβ inhibitors, which block TGFβ signal transduction at the level of the receptors or at the level of the SMAD2/3 intracellular pathways in C3H10T1/2 cells (Guerquin et al., 2013; Havis et al., 2014).
In addition to chemical signals, mechanical signals are important parameters to consider when studying tendon cell differentiation. Because tendons transmit forces from muscle to bone in the
Received 15 September 2019; Accepted 6 January 2020
1
Sorbonne Université, Institut Biologie Paris Seine, CNRS, IBPS-UMR7622, Laboratoire de Biologie du Développement, Inserm U1156, F75005 Paris, France.
2
Inovarion, 251 Rue St Jacques, F75005 Paris, France.3
Inserm UMR-S 1180, Faculté de Pharmacie, Univ. Paris-SUD, Université Paris-Saclay, F-92296 Châ tenay-Malabry, France.
*Author for correspondence (delphine.duprez@sorbonne-universite.fr)
L.G., 0000-0003-3987-3389; M.-A.B., 0000-0002-6521-3387; C.B., 0001-8584-973X; I.C., 0001-9290-4661; M.O., 0003-2183-8550; D.D., 0000-0003-0248-7417
This is an Open Access article distributed under the terms of the Creative Commons Attribution License (https://creativecommons.org/licenses/by/4.0), which permits unrestricted use, distribution and reproduction in any medium provided that the original work is properly attributed.
Biology
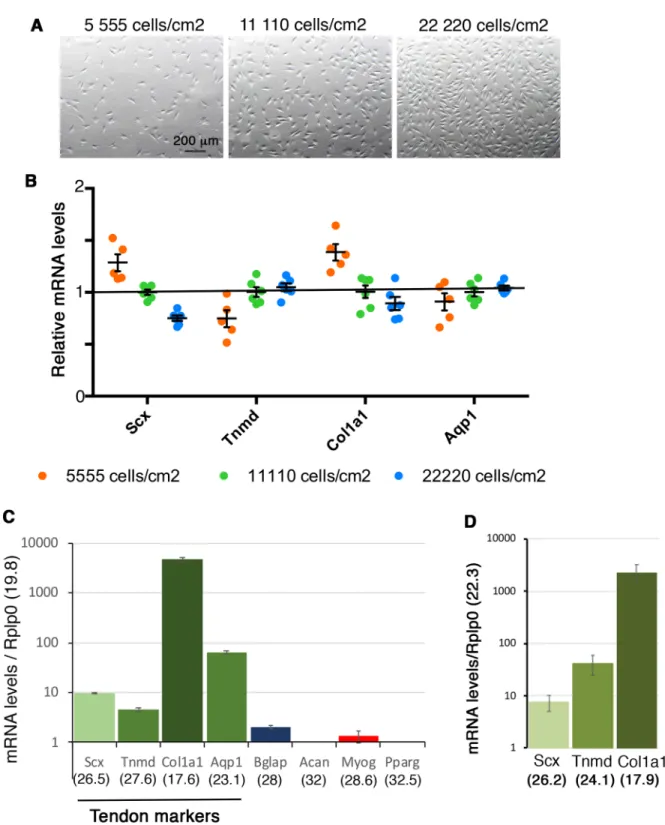
Fig. 1. Tendon gene expression is not related to cell density in non-confluent conditions. (A) Representative pictures of cell density 16 h after plating 0.5×10⁵(5555 cells/cm2), 105(11,111 cells/cm2) and 2×10⁵(22,222 cells/cm2) C3H10T1/2 cells on 9 cm2plastic culture plates. (B) RT-qPCR analyses of
the expression levels of tendon markers Scx, Tnmd, Col1a1 and Aqp1 in C3H101/2 cells 16 h after initial plating of 5555 cells/cm2, 11,110 cells/cm2and
22,220 cells/cm2. The relative mRNA levels were calculated using the 2^−ΔΔCtmethod using the 11,110 cells/cm2plating condition as control. For each gene,
the mRNA levels of the 11,110 cells/cm2plating condition were normalized to 1 (green spots). Graph shows means±sd. of six biological samples. (C)
RT-qPCR analyses of the expression levels for the tendon markers Scx, Tnmd, Col1a1, Aqp1 and for lineage markers, Bglap (bone), Acan (cartilage), Myog (muscle) and Pparg (fat) in C3H101/2 cells 16 h after initial plating 11,110 cells/cm2on plastic culture plates. mRNA levels on the Y-axis are reported to the
Rplp0 (36b4) gene (2^−ΔCt×103). Graph shows means±s.d. of six biological samples. The means of the initial Cts (obtained from 250 ng of mRNAs) are
indicated in brackets for each gene. Rplp0 (Cts=19.6 s.d.±0.17); Col1a1 (Cts=17.6 s.d.±0.2); Aqp1 (Cts=23.1 s.d.±0.44); Scx (Cts=26.5 s.d.±0.22); Tnmd (Cts=27.6 s.d.±0.28); Bglap (bone, Cts=28±0.38); Myog (muscle, Cts=28.6±0.16). Acan (cartilage) and Pparg (fat) displayed Cts above 32. (D) RT-qPCR analyses of tendon gene expression levels in adult mouse tendons. For each gene, theΔCt was calculated using Rplp0 as a reference gene, ΔCt=Ct gene– Ct Rplp0. mRNA levels on the Y-axis are reported to the Rplp0 (Cts=22.3 s.d.±1) gene (2^−ΔCt×102). Graph shows means±s.d. of five biological samples.
The means of the initial Cts (obtained from 150 ng of mRNA) are indicated in brackets for each gene. Scx (26.2 s.d.±0.63) Tnmd (24.1 s.d.±0.62) and Col1a1 (17.9 s.d.±0.57).
RESEARCH ARTICLE Biology Open (2020) 9, bio047928. doi:10.1242/bio.047928
Biology
musculoskeletal system, tendon cells are continuously subjected to variations in their mechanical environment (Schiele et al., 2013). Physical constraints subjected to the cells have been shown to be important for developmental processes and during the adult life (Mammoto et al., 2013). It is recognized that substrate stiffness controls many cellular processes such as cell fate, migration, proliferation and differentiation in culture systems of stem cells or progenitor cells (Bellas and Chen, 2014; Ivanovska et al., 2015; Kilian et al., 2010). MSCs are particularly responsive to matrix stiffness in terms of lineage commitment, ranging from neurogenic phenotype for soft substrates to osteogenic when cultured on rigid
substrates (Discher et al., 2009; Engler et al., 2006; Humphrey et al., 2014). The forces transmitted through cell contacts upon confluence is another parameter that mechanically constrains cells in culture dishes and influences cell differentiation (Abo-Aziza and Zaki, 2017; Ren et al., 2015).
The tendon phenotype is not maintained in 2D-cultures of tendon cells over passages (Hsieh et al., 2018; Shukunami et al., 2018; Yao et al., 2006). 3D-culture systems in which tendon cells are embedded in hydrogels are recognized to provide an environment closer to that experienced by tendon cells in vivo (Kapacee et al., 2010; Kuo et al., 2010; Marturano et al., 2016; Yeung et al., 2015).
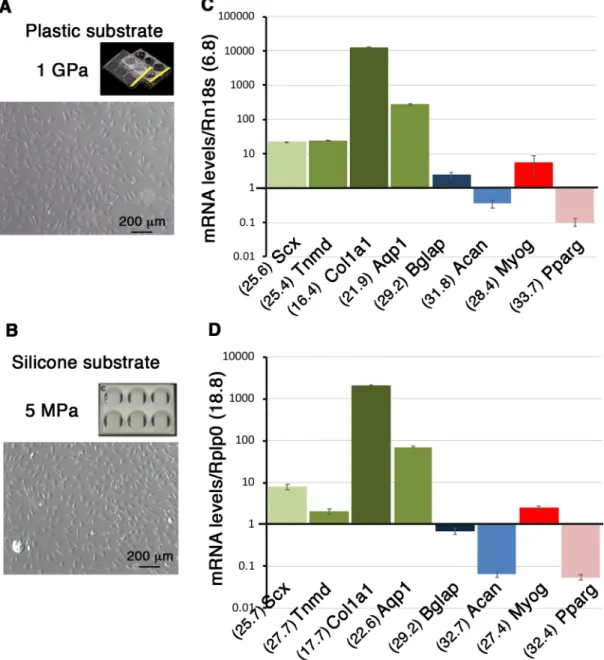
Fig. 2. The nature of the substrate does not modify gene expression profiles in C3H10T1/2 cells in non-confluent conditions. (A,B) Photographs of C3H10T1/2 cells cultured on plastic plates displaying a stiffness of 1 GPa (A) and on Uniflex culture plates made of silicon coated with type I collagen displaying a stiffness of 5 Mpa (B) in non-confluent conditions. (C,D) RT-qPCR analyses of gene expression levels in C3H10T1/2 cells. Scx, Tnmd, Col1a1, Aqp1 and representative genes for the bone (Bglap), cartilage (Acan), muscle, (Myog) and fat (Pparg) lineages in C3H101/2 cells in non-confluent conditions on plastic (C) and silicone (D) substrates. The means of the Cts (obtained from 500 ng of mRNAs) are indicated in brackets for each gene. (C) Plastic substrate: for each gene, theΔCt was calculated using Rn18S as a reference gene. ΔCt=Ct gene–Ct Rn18S. The mRNA levels were reported using the 2^−ΔCtmethod. In order to obtain values above 1, each 2^−ΔCtwere multiplied per 106. Graph shows means±s.d. of four biological samples. (D) Silicone
substrate: for each gene, theΔCt was calculated using Rplp0 as a reference gene. ΔCt=Ct gene–Ct Rplp0. The mRNA levels were calculated using the
2^−ΔCtmethod. For each gene, 2^−ΔCtwere multiplied per 103. Graph shows means±s.d. of six biological samples.
Biology
Fig. 3. See next page for legend.
RESEARCH ARTICLE Biology Open (2020) 9, bio047928. doi:10.1242/bio.047928
Biology
The mechanical environment provided to tendon cells homogeneously embedded within hydrogel in 3D-culture systems is recognized to act on tendon gene expression (Hsieh et al., 2018; Marturano et al., 2016). Most of the analyses of the effects of 2D and 3D environments have been performed with tendon stem/ progenitor cells; however, the optimum culture conditions that drive tendon cell differentiation from MSCs have not been yet identified. In the present study, we analyzed the tendon differentiation potential of C3H10T1/2 cells under different mechanical and molecular signals in 2D- and 3D-culture conditions.
RESULTS
In order to investigate tendon differentiation potential, we used C3H10T1/2 cells, a multipotent cell line established from mouse embryos (Reznikoff et al., 1973). C3H10T1/2 cells are known to differentiate into chondrocytes, osteocytes and adipocytes when cultured under appropriate cues (Guerquin et al., 2013). These cells have the ability to display a tendon phenotype under inductive molecular cues, such as the transcription factors EGR1 and MKX (Guerquin et al., 2013; Liu et al., 2015). The ability to differentiate into cell lineages related to the musculoskeletal system makes the C3H10T1/2 cells an ideal tool to study tendon commitment and differentiation under different mechanical and molecular cues in 2D- and 3D-culture conditions. To assess tendon differentiation, we used the mRNA levels of key tendon markers, Scx and Tnmd, in addition to Col1a1, the main structural and functional tendon component. We also used tendon genes identified in the transcriptomic analysis of mouse tendon cells during development (Havis et al., 2014), such as aquaporin1 (Aqp1) gene coding for a water channel protein and thrombospondin 2 (Thsb2) coding for an adhesive glycoprotein with antiangiogenic properties, both expressed in developing limb tendons.
Seeding density does not affect tendon gene expression in non-confluent conditions after 16 h of culture
We first determined whether the initial cell number interfered with the expression of tendon genes in non-confluent conditions. Different amounts of cells (0.5×10⁵, 105 and 2×10⁵) were seeded in 9 cm2
culture plates ( plastic substrate), corresponding to 5555 cells/cm2,
11,110 cells/cm2 and 22,220 cells/cm2, respectively. After 16 h of
culture, the expression of tendon genes, Scx, Tnmd, Col1a1 and Aqp1 did not display any change more than 20% upon different cell density seeding conditions (Fig. 1A,B). This shows that the initial cell number at seeding time does not have a major influence on tendon gene expression in expansion and non-confluent conditions.
We next compared the relative mRNA expression levels between tendon genes in C3H10T1/2 cells in non-confluent conditions on plastic substrate in the 11,110 cells/cm2seeding condition (Fig. 1C).
The expression levels of each tendon gene were reported to the Rplp0 gene (Ct=19.8 for 250 ng of RNAs). We found that the Col1a1 gene displayed high expression levels (Ct=17.6) compared to those of Aqp1 (Ct=23.1), Scx (Ct=26.5) and Tnmd (Ct=27.6) genes in C3H10T1/2 cells in the non-confluent condition (Fig. 1C). Comparison with tendon gene expression in native adult mouse tendons indicated a similar tendency of high expression levels of Col1a1 gene compared to Scx and Tnmd (Fig. 1D). Tnmd was also more expressed than Scx in adult mouse tendons (Fig. 1D), highlighting Tnmd as a potent tendon marker as already reported (Takimoto et al., 2012). Analysis of the mRNA expression levels for other lineage markers showed that Acan (cartilage) and Pparg (fat) genes were not expressed (Ct above 32), while Bglap (bone, Ct=28) and Myog (muscle, Ct=28.6) genes displayed low levels of expression in C3H10T1/2 cells in non-confluent conditions on plastic substrate (Fig. 1C). This shows that tendon genes are expressed in C3H10T1/2 cells seeded in non-confluent conditions on plastic substrate after 16 h of culture, with an expression level superior to that of other differentiation markers such as bone, cartilage, muscle and fat. We conclude that C3H10T1/2 cells display a fibroblastic phenotype.
Gene expression profiles are similar in C3H10T1/2 cells seeded on two different substrates on the rigid scale in non-confluent conditions after 16 h of culture
The same density of C3H10T1/2 cells (11,110 cells/cm2) was plated
on classic culture plastic plates and Uniflex Flexcell plates made of silicone substrate coated with type I collagen (Fig. 2A,B). Plastic substrate displays a Young Modulus of 1 GPa magnitude and is considered as extremely rigid. Uniflex Flexcell plates display a stiffness estimated at 5 MPa by the company (Flexcell International Corporation). The silicon substrate is 200-fold less rigid (5 MPa) compared to the plastic substrate (1 GPa) but is still considered as rigid on the micro-stiffness scale for substrates (Discher et al., 2009). C3H10T1/2 cells were harvested 16 h after plating at a non-confluent state (Fig. 2A,B) and a similar amount of mRNA was analyzed for gene expression. Tendon and other lineage marker expression profiles were similar in both substrate culture conditions (Fig. 2C,D). This shows that two substrates with different levels of stiffness on the rigid scale do not affect gene expression profiles in C3H10T1/2 cells seeded in non-confluent conditions for 16 h.
Differentiation potential of C3H10T1/2 cells cultured on plastic substrate over time
We investigated the tendon differentiation potential of C3H10T1/2 cells cultured on plastic substrate over time. Cells were plated on plastic culture plates at 11,110 cells/cm2density and left for 16 h,
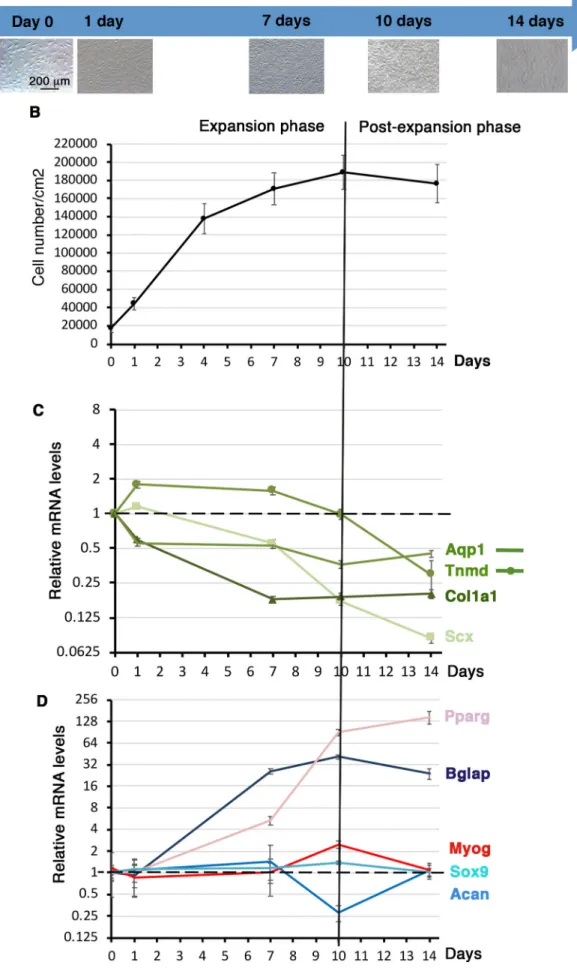
defined as day 0. C3H10T1/2 cells were let to grow for 14 days with no passage. C3H10T1/2 cells were harvested at 1 day, 7 days, 10 days and 14 days of culture. The cell density of C3H10T1/2 cells was measured (Fig. 3A,B) at each time point. At day 0 we obtained 17,100 cells/cm2(s.d.±4885, N=12). Cells expanded until day 10
and reached a plateau from day 10 to day 14, defining two phases, one expansion phase until day 10 and a post-expansion phase after day 10 (Fig. 3B).
Lineage-specific gene expression analysis was conducted in order to assess the differentiation behavior of C3H10T1/2 cells cultured on plastic substrate over time. During the expansion phase (before day 10), Scx, Col1a1 and Aqp1 genes displayed a continuous decrease of mRNA levels, while Tnmd mRNA levels displayed a bell shape with a maximum of twofold increase between day 1 and day 7 (Fig. 3C). During the post-expansion phase, Scx and
Fig. 3. Gene expression in C3H10T1/2 cells cultured on plastic substrate over time. (A) Photographs of C3H101/2 cells cultured on plastic culture plates at different time points. 105C3H101/2 cells were plated on
plastic culture plates and left for 16 h to define the T=0 time point. Cells were then fixed at 1 day, 7 days, 10 days and 14 days for RT-qPCR analyses. (B) Cell density or cell number/cm2was measured at each time point.
(C,D) RT-qPCR analyses of the expression levels for tendon genes, Scx, Tnmd, Col1a1, Aqp1 (C) and other cell lineage markers, Bglap (bone), Sox9 and Acan (cartilage), Myog (muscle) and Pparg (fat) in C3HT101/2 cells cultured on plastic culture plates at different time points. Gene mRNA levels were normalized to Rplp0. The relative mRNA levels were calculated using the 2^−ΔΔCtmethod using the day 0 condition as control. For each gene, the mRNA levels of the T=0 condition were normalized to 1. Graphs show means±s.d. of four biological samples for T=0, 1 day, 7 days and 14 days and of five biological samples for 10 days.
Biology
Fig. 4. See next page for legend.
RESEARCH ARTICLE Biology Open (2020) 9, bio047928. doi:10.1242/bio.047928
Biology
Tnmd expression decreased, while that of Col1a1 and Aqp1 was stable (Fig. 3C). We also analyzed the expression of differentiation markers for other components of the musculoskeletal system, ranging from high to soft intrinsic tissue stiffness: bone (Bglap, Pparg), cartilage (Sox9, Acan), muscle (Myog) and fat (Pparg) (Fig. 3D). Sox9, Acan and Myog genes did not show any massive changes of expression over time (Fig. 3D), while the bone differentiation marker Bglap and the early fat differentiation marker Pparg displayed a striking increase of expression levels during the time of the culture (Fig. 3D). It has to be noted that these results were reported at the day 0 time point, when Bglap and Pparg were hardly expressed (Fig. 2C). These results show that confluence increased the expression of bone and fat differentiation markers in C3H10T1/2 cells cultured on plastic substrate over time.
We conclude that cell expansion to confluence has a global negative effect on the expression of Scx, Col1a1 and Aqp1 tendon lineage markers, while promoting that of bone and fat markers in C3H10T1/2 cells cultured on plastic substrate.
Differentiation potential of C3H10T1/2 cells culture on silicon substrate over time
We next investigated the tendon differentiation potential of C3H10T1/2 cells cultured on silicon substrate over time. Similarly to cultures on plastic substrate, 105cells were plated on
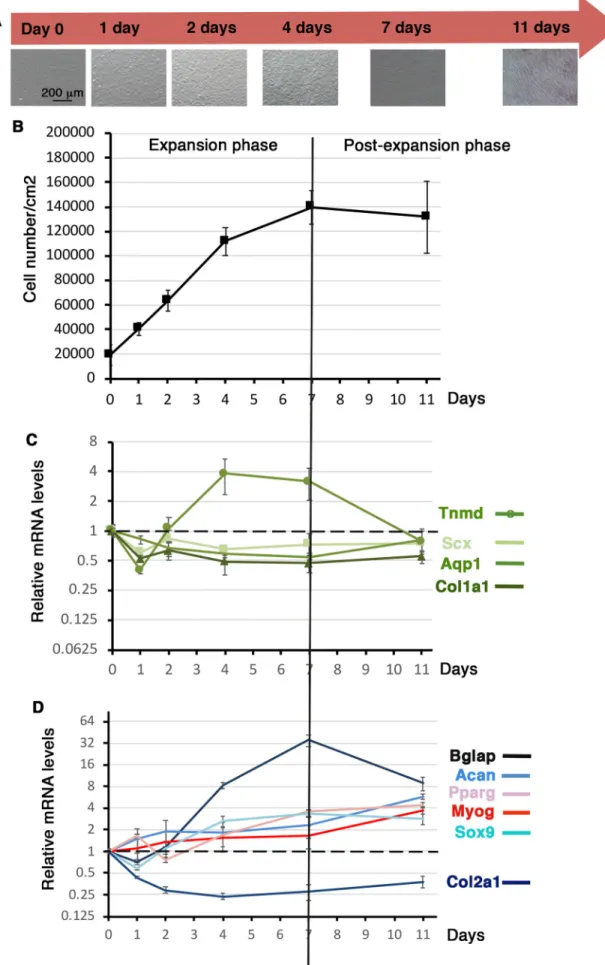
the Uniflex Flexcell plates and left for 16 h, which was defined as day 0. Cells were then cultured for 1 day, 2 days, 4 days, 7 days and 11 days with no passage. The cell density of C3H10T1/2 cells was measured at each time point (Fig. 4A,B). At day 0 we obtained 19,298 cells/cm2(s.d.±8 568, N=12) (Fig. 4B). C3H10T1/2 cells
expanded until 7 days of culture on silicone substrate and then stopped growing to reach a plateau, defining the expansion and post-expansion phases (Fig. 4B).
Tendon gene expression analysis of C3H10T1/2 cells cultured on silicon substrate showed that the relative expression levels of all analyzed tendon genes, Scx, Col1a1, Tnmd and Aqp1 decreased (up to twofold) during the first day of culture compared to day 0 that was arbitrary normalized at 1 (Fig. 4C). The Scx, Col1a1 and Aqp1 expression levels remained stable during of the rest of the culture but below the day 0 expression levels (Fig. 4C). The relative mRNA levels of the differentiation tendon gene Tnmd increased again after day 1 and displayed a bell shape with a maximum of fourfold increase between 4 and 7 days during the expansion phase and a decrease during the post-expansion phase (7 days to 11 days) (Fig. 4C). This showed that the growing phase of C3H10T1/2 cells on silicone substrate was beneficial for Tnmd expression. As for plastic substrate, the bone marker Bglap displayed an increase of relative mRNA levels in C3H10T1/2 cells cultured on silicone
substrate during the expansion phase (35-fold increase at 7 days relative to T=0) and decreased during the post-expansion phase (Fig. 4D). The expression of the representative markers of differentiation for muscle (Myog) and fat (Pparg) displayed a progressive increase over time to reach fourfold at 11 days of culture (Fig. 4D). Sox9 and Acan cartilage genes followed a similar pattern, while Col2a1 displayed a decreased expression overtime (Fig. 4D), indicating an absence of cartilage differentiation.
We conclude that the expansion phase has a positive effect on Tnmd gene expression in C3H10T1/2 cells cultured on silicone substrate over time.
Tendon differentiation potential of C3H10T1/2 cells in a 3D-culture system
We next investigated the differentiation potential of C3H10T1/2 cells in a 3D-culture system.
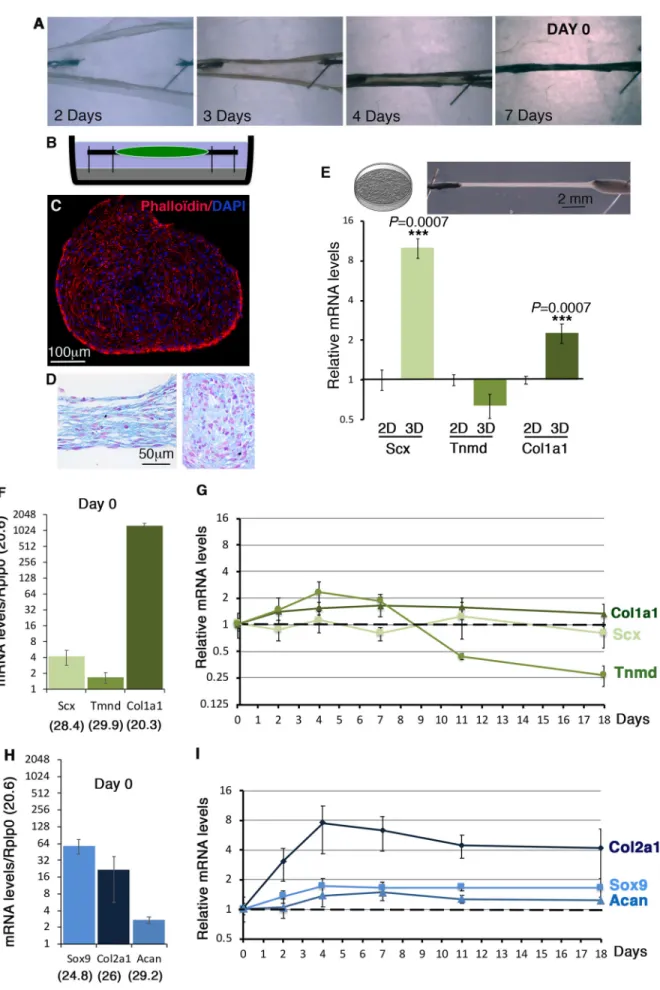
We used the 3D-fibrin gel method to produce in vitro-engineered tendons (Gaut et al., 2016; Guerquin et al., 2013; Kapacee et al., 2010). This 3D-culture system is based on tension (Bayer et al., 2010) and has been extensively characterized for matrix production by tendon progenitor cells (Yeung et al., 2015). We engineered 3D-fibrin constructs with C3H10T1/2 cells (Fig. 5A–C). 3D-fibrin constructs took 5–7 days to fully form depending on the cultures (Fig. 5A). Day 0 was defined as when constructs were formed (Fig. 5A,B). Transverse sections to a 24-h construct show a homogeneous cell organization within the constructs (Fig. 5C). Longitudinal and transverse sections of 2-week-old constructs highlighted sustained homogeneous cell organization overtime (Fig. 5D). We compared tendon gene expression in C3H10T1/2 cells cultured in a 3D environment versus 2D plastic condition. The relative mRNA levels of Scx and Col1a1 were significantly increased in C3H10T1/2 cells cultured in 3D versus 2D conditions, while those of Tnmd were not after 10 days of cultures (Fig. 5E).
Tendon and cartilage gene expression was analyzed at different time points (day 0, day 2, day 4, day 7, day 11 and day 18). The day 0 time point corresponds to the day when the constructs were formed (Fig. 5A) and was the reference time point. The expression profile of tendon genes at day 0 in 3D-fibrin constructs (Fig. 5F) was similar to that in 2D-cultures (Figs 1C and 2C,D), i.e. relatively high levels of Col1a1 mRNAs compared to Scx and Tnmd. In contrast to a decrease in 2D-cultures (Figs 3 and 4), Scx and Col1a1 displayed an unchanged expression in 3D-fibrin constructs over time following that observed in day 0 (Fig. 5G). Similarly to 2D cultures (Figs 3C and 4C), Tnmd expression displayed a bell shape with a maximum of twofold increase between day 0 and day 7 in 3D-fibrin constructs (Fig. 5G). The cartilage genes, Sox9 ( progenitors), Acan and Col2a1 (differentiated cells) were expressed at day 0 (Fig. 5H) and increased over time in 3D-fibrin constructs, indicating that the potential of C3H10T1/2 cells to differentiate into cartilage is maintained in 3D-fibrin constructs (Fig. 5I). The expression of Pparg (early fat differentiation marker) was above 32 cycles at day 7, indicating an absence of adipocyte differentiation of C3H10T1/2 cells in 3D-fibrin constructs.
We conclude that the 3D-environment in fibrin gel maintains tendon gene expression in C3H10T1/2 cells over time.
TGFβ effect on tendon gene expression in C3H10T1/2 cells in 2D- and 3D-culture systems
The canonical TGFβ/SMAD2/3 pathway is recognized to have a pro-tenogenic effect in cell cultures based on Scx expression (Guerquin et al., 2013; Havis et al., 2014, 2016; Lorda-Diez et al.,
Fig. 4. Gene expression in C3H10T1/2 cells cultured on silicone substrate over time. (A) C3H101/2 cells cultured on silicone substrate at different time points. 105C3H101/2 cells were plated on Uniflex Flexcell
plates made of silicone and coated with type I collagen, and left for 16 h to define the day 0 time point. Cells were then fixed at 1 day, 2 days, 4 days, 7 days and 11 days for RT-qPCR analyses. (B) Cell density or cell number/cm2was measured at each time point. (C,D) RT-qPCR analyses of
the expression levels of tendon markers, Scx, Tnmd, Col1a1, Aqp1 (C) and other cell lineage markers, Bglap (bone), Sox9, Acan and Col2a1 (cartilage), Myog (muscle) and Pparg (fat) (D) in C3HT101/2 cells cultured on silicone substrate at different time points. Gene mRNA levels were normalized to Rplp0. The relative mRNA levels were calculated using the 2^−ΔΔCtmethod using the T=0 condition as control. For each gene, the mRNA levels of the T=0 condition were normalized to 1. Graph shows means±s.d. of five biological samples for day 0 and of six biological samples for 1 day, 2 days, 4 days, 7 days and 11 days.
Biology
Fig. 5. See next page for legend.
RESEARCH ARTICLE Biology Open (2020) 9, bio047928. doi:10.1242/bio.047928
Biology
2009; Pryce et al., 2009). There are not many recognized transcriptional readout of TGFβ activity, but Smad7 is a negative-feedback regulator that is considered to be a general SMAD2/3 transcriptional target gene (Massagué, 2012). We assessed the activity of TGFβ/SMAD2/3 signaling pathway with Smad7 expression in C3H10T1/2 cells cultured with plastic and silicon substrates over time. The initial cycle threshold number for the Smad7 gene (Ct=23.9 for plastic and Ct=24.7 for silicone) indicated that Smad7 was expressed in C3H10T1/2 cells, in both substrate culture conditions at day 0. The Smad7 expression profile displayed a mirror image to that of Tnmd, while Smad7 expression followed that of Scx in C3H10T1/2 cells cultured in plastic and silicon substrate 2D-conditions (Figs 6A,B, 4C and 3C). The Smad7 expression profile also mapped that of Scx and differed from that of Tnmd in 3D-fibrin constructs (Figs 6C and 5E). The expression profiles of Tnmd and Scx genes in Figs 3C, 4C and 5E have been added in Fig. 6A–C to facilitate comparison with Smad7 expression levels. The fact that the activity of the TGFβ/SMAD2/3 signaling pathway followed that of Scx expression in C3H10T1/2 cells whatever the culture system was consistent with the recognized positive regulation of Scx expression by the TGFβ/SMAD2/3 signaling pathway in C3H10T1/2 cultures (Guerquin et al., 2013; Havis et al., 2014, 2016). The opposite direction of Tnmd and Smad7 expression profiles in C3H10T1/2 cells (Fig. 6A–C) suggested that active TGFβ/SMAD2/3 signaling pathway downregulated Tnmd expression.
In order to test this, we analyzed the effect of TGFβ2 on Tnmd expression in C3H10T1/2 cells seeded at two different cell densities, 11,110 cells/cm2 (Fig. 6D) and 1110 cells/cm2
(Fig. 6E). TGFβ2 treatment drastically decreased Tnmd mRNA levels, while increasing those of Scx in C3H10T1/2 cells compared to no treatment, in both seeding cell densities (Fig. 6D,E). Other tendon markers such as Col1a1, Aqp1 and Thbs2 did not display any significant variations upon TGFβ2 exposure, indicating a differential effect of TGFβ on Scx and Tnmd expression in C3H10T1/2 cells in 2D-culture conditions. In similar culture
conditions, we already showed that Sox9 expression was drastically decreased in TGFβ2-treated C3H10T1/2 cells (Havis et al., 2014). In order to test if the negative effect of TGFβ2 on Tnmd expression was inherent to the 2D-culture system, we also applied TGFβ2 in C3H10T1/2 cells cultured in 3D-fibrin gel. TGFβ2 was added in the culture medium of tendon constructs for 24 h and compared to non-treated constructs harvested at the same time. No apparent differences could be observed in the morphology of the TGF β2-treated constructs when compared to controls (Fig. 6F). Consistent with the results obtained in 2D-cultures (Fig. 6D,E), we found an increase in the expression of Scx and a concomitant decrease in Tnmd expression in TGFβ2-treated 3D-tendon constructs compared to control constructs (Fig. 6G). Col1a1 expression was increased, as was that of Scx, while Aqp1 and Thsb2 expression was decreased, as was that of Tnmd upon TGFβ2 exposure (Fig. 6G). The expression of cartilage genes was decreased (Sox9 and Acan) or not changed (Col2a1) upon TGFβ2 exposure (Fig. 6G), indicating an absence of cartilage differentiation upon TGFβ2 exposure. This shows that TGFβ2 has a negative effect on Tnmd expression, while having a positive effect on Scx expression in C3H10T1/2 cells cultured in 3D-culture conditions.
We conclude that TGFβ2 is a negative regulator of Tnmd expression in C3H10T1/2 cells in 2D- and 3D-culture systems.
DISCUSSION
In the present study, we analyzed the tendon differentiation potential of C3H10T1/2 cells cultured in different conditions. Our results show that C3H10T1/2 cells behave differently for tendon gene expression depending on the substrate on which they were seeded in 2D cultures and 3D environment. We also identified TGFβ2 as a potent negative regulator of the tendon differentiation marker Tnmd in C3H10T1/2 cells in 2D- and 3D-culture systems.
Tendon differentiation potential for C3HT101/2 cells cultured on plastic and silicon substrates
C3H10T1/2 cells, although they express tendon genes in 2D-cultures (Fig. 1), are not preferentially committed to the tendon lineage as compared to primary tendon or ligament cells originating from native tissues. We found that the initial tendon gene profile was similar in C3H10T1/2 cells seeded on silicone and plastic substrate in non-confluent 2D conditions (Fig. 2). However, the silicone substrate was more prone to maintain the tendon phenotype of C3H10T1/2 cell cultures during the expansion and post-expansion phases over time compared to plastic substrate (Figs 3 and 4). A way to compare substrates of different chemical composition is to look at their stiffness. The design of our study allowed us to compare two substrates, plastic (1 GPa magnitude) and silicone (5 MPa) with a 200-fold difference in stiffness on the rigid scale. The extreme rigidity of plastic substrate (1 GPa) progressively decreases the expression of Scx, while a relatively less rigid substrate (5 MPa) decreases Scx and Col1a1 by twofold in 1 day but then maintains their expression over time. The silicon substrate favors the expression of the tendon differentiation marker, Tnmd during the expansion phase. Based on Scx and Tnmd expression, we conclude that a substrate of 5 MPa rigidity favors the tendon phenotype in C3H10T1/2 cells over time. Although the stiffness values of both substrates display a 200-fold difference, these two substrates are still in the rigid scale favorable for bone differentiation (Discher et al., 2009). Consistently, C3H10T1/2 mesenchymal stem cells cultured on these two substrates ( plastic and silicone) display a significant and drastic increase in the expression of the bone differentiation marker (bglap) over time. Because there was no addition of bone
Fig. 5. Tendon and cartilage gene expression in C3H10T1/2 cells in 3D-fibrin gel condition. (A) 3D-constructs were made by mixing C3H10T1/2 cells with a fibrin gel. 3–7 days were required to form a construct. Day 0 was considered when constructs were formed (shown here at 7 days).
(B) Schematic representation of a 3D-fibrin construct. (C) Transverse section of a construct 24 h after formation labelled with DAPI and Phaloïdin. (D) Hematoxylin and Eosin staining on longitudinal and transverse sections of constructs 2 weeks after formation. (E) Illustrations of 2D cultures and 3D-fibrin constructs that were used for RT-qPCR. RT-qPCR analyses of the expression levels for the Scx, Tnmd and Col1a1 tendon genes in C3H10T1/2 cells cultured in 3D-fibrin constructs compared to 2D conditions on plastic for 10 days. The relative mRNA levels were calculated using the 2^−ΔΔCtmethod using the 2D conditions as controls. For each gene, the mRNA levels of 2D conditions were normalized to 1. The P-values were calculated using the Mann–Whitney test. (F–I) RT-qPCR analyses of the expression levels for Scx, Tnmd and Col1a1 tendon genes (F,G) and Sox9 and Col2a1 cartilage genes (H,I) in C3H101/2 cells cultured in 3D-fibrin gel conditions over time, at day 0 (N=4), 2 days (N=4), 4 days (N=4) 7 days (N=8), 11 days (N=4) and 18 days (N=4). (F,H) At day 0, the means of the Cts (obtained from 500 ng of mRNA) are indicated in brackets for each gene. For each gene, theΔCts were calculated using Rplp0 as a reference gene.ΔCt=Ct gene–Ct Rplp0. The mRNA levels were reported using the 2^−ΔCtmethod. For each gene, 2^−ΔCt
were multiplied per 103in order to obtain values above 1. Graphs show means
±s.d. of four biological samples. (G,I) RT-qPCR analyses of the relative expression levels of Scx, Col1a1 and Tnmd tendon genes (G) and Sox9, Col2a1 and Acan cartilage genes (I) in 3D-fibrin constructs over time. The relative mRNA levels were calculated using the 2^−ΔΔCtmethod using the day 0 condition as control. For each gene, the mRNA levels of day 0 condition were normalized to 1.
Biology
differentiation medium in the culture conditions, we believe that cell confluence favors bone differentiation of C3H10T1/2 cells cultured on these two rigid substrates. The dramatic increase in the expression of the early differentiation fat marker Pparg in plastic
substrate (high stiffness) is counterintuitive with the range of soft stiffness known to promote fat differentiation (Discher et al., 2009). We interpret the ability of C3H10T1/2 cells to differentiate towards the fat lineage under a stiff substrate by the fact that C3H10T1/2
Fig. 6. See next page for legend.
RESEARCH ARTICLE Biology Open (2020) 9, bio047928. doi:10.1242/bio.047928
Biology
cells make multilayers upon confluence. One obvious hypothesis is that cells expressing Pparg at 14 days of culture could be those in the superficial cell multilayer, not in contact with the plastic substrate and thus creating a soft environment.
TGFβ is a potent negative regulator of Tnmd expression in C3H10T1/2 cells in 2D- and 3D-culture systems
Our work identifies a striking inverse correlation between Tnmd expression and TGFβ activity (assessed with Smad7 expression) in C3H10T1/2 cells cultured in 2D conditions on both plastic and silicone substrates and in 3D-fibrin gel systems over time. Consistently, TGFβ2 drastically decreases Tnmd expression, while promoting that of Scx in C3H10T1/2 cells cultured in 2D- and 3D-culture systems. The opposite behavior of Scx and Tnmd expression in cell cultures over time and upon TGFβ application could reflect different steps of tenogenesis, with a progenitor step revealed by Scx and a differentiation one by Tnmd. During development, Scx is expressed before Tnmd and it has been shown that Scx is required and sufficient for Tnmd expression in developing tendons (Murchison et al., 2007; Shukunami et al., 2006). Scx and Tnmd also display opposite expression profiles in primary tendon cells over time (Shukunami et al., 2018). Moreover, Scx has been recently shown to directly regulate Tnmd transcription in primary tendon cells (Shukunami et al., 2018). The absence of Tnmd activation concomitant with Scx increase upon TGFβ application (Fig. 6D–F) is unexpected but indicates that TGFβ inhibits Tnmd expression in C3H10T1/2 cells in 2D- and 3D-culture conditions. It has to be noted that TGFβ2 increased the expression of both Scx and Tnmd genes in chick and mouse limb explants (Havis et al., 2014, 2016), in high-density cultures of chick limb cells (Lorda-Diez et al., 2009) or in 3D-culture systems made of human tendon cells (Bayer et al., 2010). We cannot exclude that the negative regulation of TGFβ on Tnmd expression is cell-type specific and related to mesenchymal stem cells. The relevance to the in vivo situation of Tnmd inhibition by TGFβ2 in C3H10T1/2 cells requires further investigation.
Conclusion
This study shows that culture conditions such as expansion, confluence, substrates, and 2D and 3D environment affect the
tendon differentiation potential of a murine cell line of mesenchymal stem cells, C3H10T1/2 cells. We also identify TGFβ2 as a negative regulator of Tnmd expression in C3H10T1/2 cells in 2D- and 3D-culture systems. The identification of the optimum conditions that induce tendon cell differentiation in vitro is of particular interest for optimization of tendon cell culture protocols from stem cells that can be used for tendon repair.
MATERIALS AND METHODS
Tendon isolation from adult mice
C57BLj wild-type mice were purchased from Janvier (France). Achilles tendons were isolated from five wild-type mice at 5 months of age. The two Achilles tendons of the same mice were pooled to form one biological sample and processed for RT-qPCR analysis.
Cell cultures
The multipotent mouse mesenchymal stem cells, C3H10T1/2 cells (Reznikoff et al., 1973), were cultured on six-well TPP plastic culture plates (Merck) or six-well Uniflex Flexcell plates (FlexCell Int) made of silicone substrate coated with type I collagen, in Dulbecco’s Modified Eagles Medium (DMEM, Invitrogen) supplemented with 10% fetal bovine serum (FBS, Sigma-Aldrich) 1% penicillin-sreptomycin (Sigma-Aldrich), 1% glutamin (Sigma-Aldrich) and incubated at 37°C in humidified atmosphere with 5% of CO2. The culture medium was changed every 48 h.
To study the effect of cell number on tendon gene expression, 0.5×10⁵
(5555 cells/cm2), 105 (11,110 cells/cm2) and 2×10⁵ (22,220 cells/cm2)
C3H10T1/2 cells were seeded in 9 cm2six-well TPP tissue culture plates
( plastic substrate), left for 16 h in culture and analyzed for tendon gene expression by RT-qPCR. 250 ng of RNA were extracted from each sample before proceeding with RT-qPCR. To study of the effect of the initial cell number, six samples (N=6) were analyzed in each cell density condition. The Rplp0 gene was used as the reference gene.
For the analysis of the differentiation potential of C3H10T1/2 cells seeded on plastic substrate, 105cells were seeded in six-well TPP culture
plates (11,110 cells/cm2) and left for 16 h in culture. This defined day 0
(N=4) and then cells were cultured for another 24 h (1 day) (N=4), 7 days (N=4), 10 days (N=5) and 14 days (N=4). 500 ng of RNA were extracted from each sample before proceeding with RT-qPCR.
For analysis of the differentiation potential of C3H10T1/2 cells seeded on silicon substrate coated with type I collagen, 105cells were seeded in
six-well Uniflex Flexcell plates and left for 16 h in culture. This defined day 0 (N=5), then cells were cultured for another 24 h (1 day) (N=6), 48 h (2 days) (N=6), 7 days (N=6) and 11 days (N=6). 500 ng of RNA were extracted from each sample before proceeding with RT-qPCR.
3D-engineered tendon constructs in fibrin gels
3D fibrin-based tendon-like constructs made of mouse C3H10T1/2 cells were performed as previously described (Kapacee et al., 2008). Briefly, for each construct, 400μl of cell suspension (7.5×10⁵cells) were mixed with
20 mg/ml fibrinogen Aldrich) and 200 U/ml thrombin (Sigma-Aldrich). The fibrin gels containing cells were seeded in prepared SYLGARD-covered wells (DowChemical, Midland, MI, USA), in which two 8 mm sutures (Ethican, Sommerville, NJ, USA) were pinned 10 mm apart. Culture medium containing 200μM of L-ascorbic acid 2-phosphate was added to the wells and gels were scored every day for a proper contraction into a linear construct. After 5–7 days, the C3H10T1/2 cells formed continuous tendon-like constructs between the two anchors. This was considered day 0. Each tendon construct was considered as a biological sample. The mRNA levels of each construct were analyzed by q-RT-PCR at 2 days, 4 days, 7 days, 11 days and 18 days after day 0.
TGF-β treatment on 2D and 3D cultures
105 or 104C3H10T1/2 cells were plated on six-well TPP culture plates
( plastic) and grown for 40 h. Then, human recombinant TGFβ2 (RD System) was applied at 20 ng/ml to C3H10T1/2 cells for 24 h. Cells were grown for another 24 h without TGFβ2 supplementation in the medium. Control cells were treated with Bovin Serum Albumin and HCl (BSA-HCl) in the same
Fig. 6. Antagonistic effect of TGFβ2 on Tnmd and Scx expression in C3H10T1/2 cells in 2D- and 3D-culture systems. (A–C) RT-qPCR analyses of the expression levels of Smad7 gene in C3H10T1/2 cells cultured upon plastic (A) and silicone (B) substrates during the expansion phase or cultured in 3D-fibrin gel condition (C). The relative mRNA levels were calculated using the 2^−ΔΔCtmethod. For each gene, the mRNA levels of the day 0 condition were normalized to 1. (A,C) Graphs show means±s.d. of four biological samples. (B) Graph shows means±s.d. of five biological samples. The expression profiles of Scx and Tnmd shown in Figs 3C, 4C and 5F have been plotted on panels A–C to facilitate comparison with Smad7. (D,E) RT-qPCR analyses of the expression levels of tendon gene expression in C3H10T1/2 cells cultured in control or TGFβ2-supplemented media and seeded at 105cells (11,110 cells/cm2) (D) and 104cells (1110
cells/cm2) (E). Graphs show mean±s.d. of six biological samples. The
relative mRNA levels were calculated using the 2^−ΔΔCtmethod. For each gene, the mRNA levels of control conditions were normalized to 1. (F,G) 3D-fibrin constructs in control or TGFβ2-supplemented media. (F) Images showing no significant variations in the morphology of the TGF β2-treated 3D constructs (bottom) compared to control (top). (G) RT-qPCR analysis of the relative expression of the tendon-associated genes and cartilage-associated genes (Sox9, Acan, Col2a1) in 3D constructs treated or not treated with TGFβ2. Graph shows mean±s.d. of six biological samples. The relative mRNA levels were calculated using the 2^−ΔΔCtmethod. For each gene, the mRNA levels of control conditions were normalized to 1. P-values were calculated using the Mann–Whitney test.
Biology
volume applied for TGFβ2 treatment. TGF-β2-treated and non-treated C3H10T1/2 cells were then fixed and processed for qPCR assays to analyze gene expression. In each condition, four biological samples (N=4) were used. 3D tendon constructs were treated with TGFβ2 or with BSA-HCl (controls) at day 7 of culture for 24 h. In each condition, five biological samples (N=5) were used for qPCR analysis.
RNA isolation, reverse transcription and RT-qPCR
Total RNAs were extracted from 2D and 3D cell cultures: C3H10T1/2 cells were cultured on classic culture dishes at day 0, 1 day, 7 days, 10 days and 14 days; C3H10T1/2 cells were cultured on silicone substrate at day 0, 1 day, 2 days, 4 days, 7 days and 11 days; C3H10T1/2 cells were cultured in 3D fibrin gel conditions at day 0, 2 days, 4 days, 7 days, 11 days and 18 days; and TGFβ2-treated C3H10T1/2 cells were cultured in 2D and 3D conditions. Total RNA was isolated using the RNeasy mini kit (Qiagen) with 15 min of DNase I (Qiagen) treatment according to the manufacturer’s protocol. For RT-qPCR analyses, 250 ng or 500 ng RNA was reverse-transcribed using the High Capacity Retrotranscription kit (Applied Biosystems). RT-qPCR PCR was performed using SYBR Green PCR Master Mix (Applied Biosystems) using the primers listed in Table 1. We used rn18s (also named 18S) and Rplp0 (also named 36b4) as housekeeping genes. The rn18s and Rplp0 genes did not show any variation in the different experimental conditions. The Rplp0 gene is detected around a Ct (threshold cycle) of 19.5 for 250 ng of RNAs and around a Ct of 18.5 for 500 ng of RNAs. This result is consistent with the log2-linear plot of the PCR signal. A decrease of one cycle corresponds to a twofold increase of RNA (Livak and Schmittgen, 2001). The rn18s gene was detected at around 7.5 Ct for 500 ng of RNA. The relative mRNA levels were calculated using the 2^-ΔΔCt method (Livak and Schmittgen, 2001; Schmittgen and Livak, 2008). TheΔCt values were obtained by calculating the differences: Ct(gene of interest)– Ct(housekeeping gene) in each sample. ΔΔCt values were obtained by calculating the differences between ΔCt (experimental condition) and the average of controlΔCt values. For the analysis of the relative mRNA levels of cells cultured over time in classic culture plates ( plastic substrate), Uniflex Flexcell plates (silicone substrate) or 3D-fibrin condition, the values of the day 0 time points were considered as controls and were normalized to 1. For the relative mRNA level analysis in TGFβ2-treated cells in 2D or 3D conditions, the cells in the absence of TGFβ2 supplementation were considered as controls and were normalized to 1.
For the absolute quantification of gene expression, 16 h after plating 105
cells, Y-axes correspond to 2^-ΔCtx103against the Rplp0 house keeping
gene from 250 ng of RNA (Fig. 1C), to 2^-ΔCtx103against the Rn18S house
keeping gene from 500 ng of RNA (Fig. 2C) and 2^-ΔCtx104against the
Rplp0 house keeping gene from 500 ng of RNA (Fig. 2D).
Statistical analyses
Results are shown as means±s.d. The exact number of independent biological samples (4–6) is reported for each experiment. RT-qPCR data
were analyzed with the non-parametric Mann-Whitney test with Graphpad Prism V6. The asterisks in histograms indicate P-values that was considered significant, *P<0.05, **P<0.01, ***P<0.001.
Acknowledgements
We thank Sophie Gournet for illustrations. We are grateful to lab members for reading the manuscript.
Competing interests
The authors declare no competing or financial interests.
Funding
This work was funded by the Fondation pour la Recherche Médicale (FRM; grant DEQ20140329500), the Institut National de la Santé et de la Recherche Médicale (INSERM) and the Centre National de la Recherche Scientifique (CNRS). L.G. received financial support from the FRM (grant FDT20170436814)
Author contributions
Conceptualization: M.M., D.D.; Methodology: L.G., M.-A.B., C.B., I.C., M.O.; Validation: M.-A.B., C.B., D.D.; Formal analysis: L.G., D.D.; Investigation: L.G.; Data curation: D.D.; Writing - original draft: D.D.; Writing - review & editing: M.M., D.D.; Supervision: M.M., D.D.; Project administration: D.D.; Funding acquisition: D.D.
References
Abo-Aziza, F. A. M. and Zaki, A. A. (2017). The impact of confluence on bone marrow mesenchymal stem (BMMSC) proliferation and osteogenic differentiation. Int. J. Hematol. Stem Cell Res. 11, 121-132.
Alberton, P., Dex, S., Popov, C., Shukunami, C., Schieker, M. and Docheva, D. (2015). Loss of tenomodulin results in reduced self-renewal and augmented senescence of tendon stem/progenitor cells. Stem Cells Dev. 24, 597-609. doi:10. 1089/scd.2014.0314
Bayer, M. L., Yeung, C.-Y. C., Kadler, K. E., Qvortrup, K., Baar, K., Svensson, R. B., Peter Magnusson, S., Krogsgaard, M., Koch, M. and Kjaer, M. (2010). The initiation of embryonic-like collagen fibrillogenesis by adult human tendon fibroblasts when cultured under tension. Biomaterials 31, 4889-4897. doi:10. 1016/j.biomaterials.2010.02.062
Bellas, E. and Chen, C. S. (2014). Forms, forces, and stem cell fate. Curr. Opin. Cell Biol. 31, 92-97. doi:10.1016/j.ceb.2014.09.006
Buckingham, M. (2017). Gene regulatory networks and cell lineages that underlie the formation of skeletal muscle. Proc. Natl. Acad. Sci. USA 114, 5830-5837. doi:10.1073/pnas.1610605114
Caplan, A. I. (1991). Mesenchymal stem cells. J. Orthop. Res. 9, 641-650. doi:10. 1002/jor.1100090504
Dex, S., Lin, D., Shukunami, C. and Docheva, D. (2016). TENOgenic MODULating INsider factor: systematic assessment on the functions of tenomodulin gene. Gene 587, 1-17. doi:10.1016/j.gene.2016.04.051
Dex, S., Alberton, P., Willkomm, L., Sö llradl, T., Bago, S., Milz, S., Shakibaei, M., Ignatius, A., Bloch, W., Clausen-Schaumann, H. et al. (2017). Tenomodulin is required for tendon endurance running and collagen I fibril adaptation to mechanical load. EBioMedicine 20, 240-254. doi:10.1016/j.ebiom.2017.05.003 Discher, D. E., Mooney, D. J. and Zandstra, P. W. (2009). Growth factors, matrices,
and forces combine and control stem cells. Science 324, 1673-1677. doi:10.1126/ science.1171643
Table 1. Primers used for RT-qPCR
Gene Forward primers Reverse primers Accession no.
Acan 5′-CGCTGCAGTGATCTCAGAAGAAGT-3′ 5′-TCACGCTCAGTAGTTGTCATGGT-3′ NM_001361500.1 Aqp1 5′-CAATTCACTTGGCCGCAATGACC-3′ 5′-TACCAGCTGCAGATGCCAATGA-3′ NM_007472.2 Bglap 5′-GCCTTCATGTCCAAGCAGGA-3′ 5′-GCGCCGGAGTCTGTTCACTA-3′ NM_007541.2 Cebpb 5′-CGCCTTTAGACCCATGGAAG-3′ 5′-AGGCAGTCGGGCTCGTAGTAG-3′ NM_009883 Col1a1 5′-TGGAGAGAGCATGACCGATG-3′ 5′-GAGCCCTCGCTTCCGTACT-3′ NM_007742 Col2a1 5′-GGGCAACAGCAGGTTCACAT-3′ 5′-TGTTTCGTGCAGCCATCCT-3′ NM_001113515.2 Myog 5′-CACTGGAGTTCGGTCCCAAC-3′ 5′-TGGGCGTCTGTAGGGTCAG-3′ NM_031189.2 Pparg 5′-TCGCTGATGCACTGCCTATG-3′ 5′-GAGAGGTCCACAGAGCTGATT-3′ NM_011146 Rn18s 5′-GGCGACGACCCATTCG-3′ 5′-ACCCGTGGTCACCATGGTA-3′ NR_003278.3 Rplp0 5′-ACCTCCTTCTTCCAGGCTTT-3′ 5′-CTCCCACCTTGTCTCCAGTC-3′ NM_007475.5 Runx2 5′-GGTCCCCGGGAACCAA-3′ 5′-GGCGATCAGAGAACAAACTAGGTTT-3′ NM_001145920 Scx 5′-CCTTCTGCCTCAGCAACCAG-3′ 5′-GGTCCAAAGTGGGGCTCTCCGTGACT-3′ NM_198885.3 Smad7 5′-CAGCACTGCCAAGCATGGT-3′ 5′-ACCGAAACGCTGATCCAAAG-3′ NM_001042660.1 Sox9 5′-AGTACCCGCATCTGCACAAC-3′ 5′-CCTCCACGAAGGGTCTCTTCT-3′ NM_011448.4 Thbs2 5′-AGGTGCATCTCGAGAGAGTCACTTCA-3′ 5′-CTGCAAACACGAGATGGACATTCTGC-3′ NM_011581.3 Tnmd 5′-AACACTTCTGGCCCGAGGTAT-3′ 5′-AAGTGTGCTCCATGTCATAGGTTTT-3′ NM_022322.2 RESEARCH ARTICLE Biology Open (2020) 9, bio047928. doi:10.1242/bio.047928
Biology
Docheva, D., Hunziker, E. B., Fä ssler, R. and Brandau, O. (2005). Tenomodulin is necessary for tenocyte proliferation and tendon maturation. Mol. Cell. Biol. 25, 699-705. doi:10.1128/MCB.25.2.699-705.2005
Engler, A. J., Sen, S., Sweeney, H. L. and Discher, D. E. (2006). Matrix elasticity directs stem cell lineage specification. Cell 126, 677-689. doi:10.1016/j.cell.2006. 06.044
Gaut, L. and Duprez, D. (2016). Tendon development and diseases. Wiley Interdiscip. Rev. Dev. Biol. 5, 5-23. doi:10.1002/wdev.201
Gaut, L., Robert, N., Delalande, A., Bonnin, M.-A., Pichon, C. and Duprez, D. (2016). EGR1 regulates transcription downstream of mechanical signals during tendon formation and healing. PLoS ONE 11, e0166237. doi:10.1371/journal. pone.0166237
Guerquin, M.-J., Charvet, B., Nourissat, G., Havis, E., Ronsin, O., Bonnin, M.-A., Ruggiu, M., Olivera-Martinez, I., Robert, N., Lu, Y. et al. (2013). Transcription factor EGR1 directs tendon differentiation and promotes tendon repair. J. Clin. Invest. 123, 3564-3576. doi:10.1172/JCI67521
Havis, E., Bonnin, M.-A., Olivera-Martinez, I., Nazaret, N., Ruggiu, M., Weibel, J., Durand, C., Guerquin, M.-J., Bonod-Bidaud, C., Ruggiero, F. et al. (2014). Transcriptomic analysis of mouse limb tendon cells during development. Development 141, 3683-3696. doi:10.1242/dev.108654
Havis, E., Bonnin, M. M.-A., De Lima, J. J. E., Charvet, B., Milet, C. and Duprez, D. (2016). TGFβ and FGF promote tendon progenitor fate and act downstream of muscle contraction to regulate tendon differentiation during chick limb development. Development 143, 3839-3851. doi:10.1242/dev.136242 Hsieh, C.-F., Yan, Z., Schumann, R., Milz, S., Pfeifer, C., Schieker, M. and
Docheva, D. (2018). In Vitro comparison of 2D-cell culture and 3D-cell sheets of scleraxis-programmed bone marrow derived mesenchymal stem cells to primary tendon stem/progenitor cells for tendon repair. Int. J. Mol. Sci. 19, 2272. doi:10. 3390/ijms19082272
Huang, A. H., Lu, H. H. and Schweitzer, R. (2015). Molecular regulation of tendon cell fate during development. J. Orthop. Res. 33, 800-812. doi:10.1002/jor.22834 Humphrey, J. D., Dufresne, E. R. and Schwartz, M. A. (2014). Mechanotransduction and extracellular matrix homeostasis. Nat. Rev. Mol. Cell Biol. 15, 802-812. doi:10.1038/nrm3896
Ivanovska, I. L., Shin, J.-W., Swift, J. and Discher, D. E. (2015). Stem cell mechanobiology: diverse lessons from bone marrow. Trends Cell Biol. 25, 523-532. doi:10.1016/j.tcb.2015.04.003
Kapacee, Z., Richardson, S. H., Lu, Y., Starborg, T., Holmes, D. F., Baar, K. and Kadler, K. E. (2008). Tension is required for fibripositor formation. Matrix Biol. 27, 371-375. doi:10.1016/j.matbio.2007.11.006
Kapacee, Z., Yeung, C.-Y. C., Lu, Y., Crabtree, D., Holmes, D. F. and Kadler, K. E. (2010). Synthesis of embryonic tendon-like tissue by human marrow stromal/ mesenchymal stem cells requires a three-dimensional environment and transforming growth factorβ3. Matrix Biol. 29, 668-677. doi:10.1016/j.matbio. 2010.08.005
Karsenty, G., Kronenberg, H. M. and Settembre, C. (2009). Genetic control of bone formation. Annu. Rev. Cell Dev. Biol. 25, 629-648. doi:10.1146/annurev. cellbio.042308.113308
Kilian, K. A., Bugarija, B., Lahn, B. T. and Mrksich, M. (2010). Geometric cues for directing the differentiation of mesenchymal stem cells. Proc. Natl. Acad. Sci. USA 107, 4872-4877. doi:10.1073/pnas.0903269107
Kuo, C. K., Marturano, J. E. and Tuan, R. S. (2010). Novel strategies in tendon and ligament tissue engineering: advanced biomaterials and regeneration motifs. BMC Sports Sci. Med. Rehabil. 2, 20. doi:10.1186/1758-2555-2-20
Liu, H., Zhang, C., Zhu, S., Lu, P., Zhu, T., Gong, X., Zhang, Z., Hu, J., Yin, Z., Heng, B. C. et al. (2015). Mohawk promotes the tenogenesis of mesenchymal stem cells through activation of the TGFβ signaling pathway. Stem Cells 33, 443-455. doi:10.1002/stem.1866
Liu, C.-F., Samsa, W. E., Zhou, G. and Lefebvre, V. (2017). Transcriptional control of chondrocyte specification and differentiation. Semin. Cell Dev. Biol. 62, 34-49. doi:10.1016/j.semcdb.2016.10.004
Livak, K. J. and Schmittgen, T. D. (2001). Analysis of relative gene expression data using real-time quantitative PCR and the 2−ΔΔCT method. Methods 25, 402-408. doi:10.1006/meth.2001.1262
Lorda-Diez, C. I., Montero, J. A., Martinez-Cue, C., Garcia-Porrero, J. A. and Hurle, J. M. (2009). Transforming growth factors β coordinate cartilage and tendon differentiation in the developing limb mesenchyme. J. Biol. Chem. 284, 29988-29996. doi:10.1074/jbc.M109.014811
Maeda, T., Sakabe, T., Sunaga, A., Sakai, K., Rivera, A. L., Keene, D. R., Sasaki, T., Stavnezer, E., Iannotti, J., Schweitzer, R. et al. (2011). Conversion of mechanical force into TGF-β-mediated biochemical signals. Curr. Biol. 21, 933-941. doi:10. 1016/j.cub.2011.04.007
Mammoto, T., Mammoto, A. and Ingber, D. E. (2013). Mechanobiology and developmental control. Annu. Rev. Cell Dev. Biol. 29, 27-61. doi:10.1146/ annurev-cellbio-101512-122340
Marturano, J. E., Schiele, N. R., Schiller, Z. A., Galassi, T. V., Stoppato, M. and Kuo, C. K. (2016). Embryonically inspired scaffolds regulate tenogenically differentiating cells. J. Biomech. 49, 3281-3288. doi:10.1016/j.jbiomech.2016. 08.011
Massagué, J. (2012). TGFβ signalling in context. Nat. Rev. Mol. Cell Biol. 13, 616-630. doi:10.1038/nrm3434
Mendias, C. L., Gumucio, J. P., Bakhurin, K. I., Lynch, E. B. and Brooks, S. V. (2012). Physiological loading of tendons induces scleraxis expression in epitenon fibroblasts. J. Orthop. Res. 30, 606-612. doi:10.1002/jor.21550
Murchison, N. D., Price, B. A., Conner, D. A., Keene, D. R., Olson, E. N., Tabin, C. J. and Schweitzer, R. (2007). Regulation of tendon differentiation by scleraxis distinguishes force-transmitting tendons from muscle-anchoring tendons. Development 134, 2697-2708. doi:10.1242/dev.001933
Nourissat, G., Berenbaum, F. and Duprez, D. (2015). Tendon injury: from biology to tendon repair. Nat. Rev. Rheumatol. 11, 223-233. doi:10.1038/nrrheum. 2015.26
Pittenger, M. F., Mackay, A. M., Beck, S. C., Jaiswal, R. K., Douglas, R., Mosca, J. D., Moorman, M. A., Simonetti, D. W., Craig, S. and Marshak, D. R. (1999). Multilineage potential of adult human mesenchymal stem cells. Science 284, 143-147. doi:10.1126/science.284.5411.143
Prockop, D. J. (1997). Marrow stromal cells as stem cells for nonhematopoietic tissues. Science 276, 71-74. doi:10.1126/science.276.5309.71
Pryce, B. A., Watson, S. S., Murchison, N. D., Staverosky, J. A., Dunker, N. and Schweitzer, R. (2009). Recruitment and maintenance of tendon progenitors by TGF signaling are essential for tendon formation. Development 136, 1351-1361. doi:10.1242/dev.027342
Ren, J., Wang, H., Tran, K., Civini, S., Jin, P., Castiello, L., Feng, J., Kuznetsov, S. A., Robey, P. G., Sabatino, M. et al. (2015). Human bone marrow stromal cell confluence: effects on cell characteristics and methods of assessment. Cytotherapy 17, 897-911. doi:10.1016/j.jcyt.2015.03.607
Reznikoff, C. A., Brankow, D. W. and Heidelberger, C. (1973). Establishment and characterization of a cloned line of C3H mouse embryo cells sensitive to postconfluence inhibition of division. Cancer Res. 33, 3231-3238.
Schiele, N. R., Marturano, J. E. and Kuo, C. K. (2013). Mechanical factors in embryonic tendon development: potential cues for stem cell tenogenesis. Curr. Opin. Biotechnol. 24, 834-840. doi:10.1016/j.copbio.2013.07.003
Schmittgen, T. D. and Livak, K. J. (2008). Analyzing real-time PCR data by the comparative CTmethod. Nat. Protoc. 3, 1101-1108. doi:10.1038/nprot.2008.73
Schweitzer, R., Chyung, J. H., Murtaugh, L. C., Brent, A. E., Rosen, V., Olson, E. N., Lassar, A. and Tabin, C. J. (2001). Analysis of the tendon cell fate using Scleraxis, a specific marker for tendons and ligaments. Development 128, 3855-3866.
Schweitzer, R., Zelzer, E. and Volk, T. (2010). Connecting muscles to tendons: tendons and musculoskeletal development in flies and vertebrates. Development 137, 2807-2817. doi:10.1242/dev.047498
Shukunami, C., Takimoto, A., Oro, M. and Hiraki, Y. (2006). Scleraxis positively regulates the expression of tenomodulin, a differentiation marker of tenocytes. Dev. Biol. 298, 234-247. doi:10.1016/j.ydbio.2006.06.036
Shukunami, C., Takimoto, A., Nishizaki, Y., Yoshimoto, Y., Tanaka, S., Miura, S., Watanabe, H., Sakuma, T., Yamamoto, T., Kondoh, G. et al. (2018). Scleraxis is a transcriptional activator that regulates the expression of Tenomodulin, a marker of mature tenocytes and ligamentocytes. Sci. Rep. 8, 3155. doi:10.1038/s41598-018-21194-3
Takimoto, A., Oro, M., Hiraki, Y. and Shukunami, C. (2012). Direct conversion of tenocytes into chondrocytes by Sox9. Exp. Cell Res. 318, 1492-1507. doi:10. 1016/j.yexcr.2012.04.002
Yao, L., Bestwick, C. S., Bestwick, L. A., Maffulli, N. and Aspden, R. M. (2006). Phenotypic drift in human tenocyte culture. Tissue Eng. 12, 1843-1849. doi:10. 1089/ten.2006.12.1843
Yeung, C.-Y. C., Zeef, L. A. H., Lallyett, C., Lu, Y., Canty-Laird, E. G. and Kadler, K. E. (2015). Chick tendon fibroblast transcriptome and shape depend on whether the cell has made its own collagen matrix. Sci. Rep. 5, 13555. doi:10.1038/ srep13555
Yoshimoto, Y., Takimoto, A., Watanabe, H., Hiraki, Y., Kondoh, G. and Shukunami, C. (2017). Scleraxis is required for maturation of tissue domains for proper integration of the musculoskeletal system. Sci. Rep. 7, 45010. doi:10.1038/srep45010 Zhang, Y.-J., Chen, X., Li, G., Chan, K.-M., Heng, B. C., Yin, Z. and Ouyang, H.-W.
(2018). Concise review: stem cell fate guided by bioactive molecules for tendon regeneration. Stem Cells Transl. Med. 7, 404-414. doi:10.1002/sctm.17-0206