Publisher’s version / Version de l'éditeur:
Vous avez des questions? Nous pouvons vous aider. Pour communiquer directement avec un auteur, consultez la première page de la revue dans laquelle son article a été publié afin de trouver ses coordonnées. Si vous n’arrivez pas à les repérer, communiquez avec nous à PublicationsArchive-ArchivesPublications@nrc-cnrc.gc.ca.
Questions? Contact the NRC Publications Archive team at
PublicationsArchive-ArchivesPublications@nrc-cnrc.gc.ca. If you wish to email the authors directly, please see the first page of the publication for their contact information.
https://publications-cnrc.canada.ca/fra/droits
L’accès à ce site Web et l’utilisation de son contenu sont assujettis aux conditions présentées dans le site LISEZ CES CONDITIONS ATTENTIVEMENT AVANT D’UTILISER CE SITE WEB.
CIB 2004 Conference: [Proceedings], pp. 1-11, 2004-05-01
READ THESE TERMS AND CONDITIONS CAREFULLY BEFORE USING THIS WEBSITE. https://nrc-publications.canada.ca/eng/copyright
NRC Publications Archive Record / Notice des Archives des publications du CNRC :
https://nrc-publications.canada.ca/eng/view/object/?id=7f3ca222-ae1d-4635-9751-fd975ed8e24a https://publications-cnrc.canada.ca/fra/voir/objet/?id=7f3ca222-ae1d-4635-9751-fd975ed8e24a
NRC Publications Archive
Archives des publications du CNRC
This publication could be one of several versions: author’s original, accepted manuscript or the publisher’s version. / La version de cette publication peut être l’une des suivantes : la version prépublication de l’auteur, la version acceptée du manuscrit ou la version de l’éditeur.
Access and use of this website and the material on it are subject to the Terms and Conditions set forth at
Large-scale laboratory measurements and benchmarking of an
advanced hygrothermal model
Large-scale laboratory measurements and benchmarking of an
advanced hygrothermal model
Maref, W.; Lacasse, M.A.; Booth, D.
NRCC-46784
A version of this document is published in / Une version de ce document se trouve dans :
CIB 2004 Conference, Toronto, Ontario, May 2-7, 2004, pp. 1-10
LARGE-SCALE LABORATORY MEASUREMENTS AND
BENCHMARKING OF AN ADVANCED HYGROTHERMAL MODEL
SESSION NUMBER
CIB T1S1
W. Maref
1, Ph.D., M. A. Lacasse
2, Ph. D, P. Eng. and D. Booth
3Abstract
The hygrothermal performance of a building envelope system is dictated by the response of the system to combined heat, air and moisture fluctuations produced by exterior and interior conditions that exist on either side of the envelope. Recent research in the field of assessment of hygrothermal response has focused either on laboratory experimentation or on modelling, but less work has been reported in which both aspects are combined. Indeed, it is generally acknowledged that assessing the hygrothermal performance of building envelope systems is both expensive and time consuming. Such type of studies can potentially offer useful information regarding the benchmarking of models and related methods to assess hygrothermal performance of wall assemblies. This paper reports on the use of an advanced hygrothermal computer model hygIRC to assess the hygrothermal response of various components in wood-frame wall assemblies when subjected to nominally steady-state environmental conditions. The model uses hygrothermal properties of materials derived from tests on small-scale specimens undertaken in the laboratory. A comparison is made of results obtained from computer model simulation to those derived from tests on large-scale specimens in controlled laboratory measurements. The experimental results were subsequently used to help benchmark the model. Specifically, this model was implemented, in this series of simulations, to assess the drying rate of various combinations of sheathing membranes in close contact with wood-based sheathing. Details of the experiments and of the results obtained from comparison of experiment and simulation are reported.
1
Wahid Maref is an Associate Research Officer, Institute for Research in Construction, National Research Council Canada; 1200 Montreal Road, Building M-24, K1A 0R6, Ottawa, Ontario, Canada
2
Michael A. Lacasse is a Senior Research Officer, Institute for Research in Construction, National Research Council Canada; 1200 Montreal Road, Building M-20, K1A 0R6, Ottawa, Ontario, Canada
3
Dan Booth is a Technical Officer, Institute for Research in Construction, National Research Council Canada; 1200 Montreal Road, Building M-24, K1A 0R6, Ottawa, Ontario, Canada
INTRODUCTION
The advanced hygrothermal computer model used to assess the hygrothermal response of various components in wood-frame wall assemblies is hygIRC (Maref & al 2002a, 2002b, 2002c, 2002d, and Kumaran, 2002). The governing equations implemented in hygIRC are given below. The moisture transport potentials used in the model are moisture content (MC) and vapour pressure (VP); for energy transfer, temperature is the driving force.
Moisture balance equation
MCs in the building envelope components are obtained by solving the vapour diffusion and capillary liquid moisture mass balance
• + • −∇ = ∂ ∂ v m l m t u o ρ
3
( )
2
1
r
43
42
1
Vapor diffusion VaporV
v
ρ
v
P
T
u
p
δ
m
v-,
∇
+
−
=
• airflowa
43
r
floww
ρ
g
( )
42
1
4
4 3
4
4 2
1
gravity Liquid diffusion LiquidT)
(u,
w
k
u
T
u
w
D
o
ρ
m
l=
−
,
∇
+
•(
)
u S T u D ρ w k w o ∂ ∂ = , WithEnergy balance equation
Temperature as well as heat fluxes through the envelope components are derived from the energy balance equation
( )
( )
(
)
4 4 3 4 4 2 1 4 4 4 4 3 4 4 4 4 2 1 4 43 4 42 1 4 4 4 4 3 4 4 4 4 2 1 r heat / heat on condensati n / Evaporatio . . thaw Freeze conduction Heat heat convected Airflow t f u o ρ ice L v P T) (u, p o ρ v L T T) (u, T a V (T) a p C T a t T T) (u, p C T u, T ρ l ∂ ∂ − ∇ ∇ + ∇ ∇ + ∇ − = ∂ ∂ δ λ ρPREVIOUS WORK ON BENCHMARKING SIMULATION MODELS
There have been some known attempts at providing validation of simulation models, notably from the combined efforts of the IEA Annex 24 (Hens 1996) and more recently, from work carried out in Norway at the Norwegian University of Science and Technology (Geving and Uvsløkk 2000).
The work carried out during the IEA Annex 24 focused on using inter-model comparison as one of three possible means identified to provide validation of simulation models; the other two being analytical and empirical verifications, respectively. Analytical verification, recognised as being useful for testing algorithms, but was not attempted and empirical verification was only tried for limited applications. Because of the difficulties in obtaining detailed results from experiments,
verifications were restricted to summing up mass quantities such as total moisture content and amounts of condensed moisture, and thermal values such as fluxes and total energy flow. Although these comparisons provided insight into the applicability of the different models, no straightforward validation through experimentation was completed. It was however suggested that more rigorous validation through well-controlled experimentation should form the basis for future work in this area.
Geving and Thue (1996) took actual measurements and performed computer simulations of lightweight roofs from which a comparison was made between experimental results and simulations undertaken on a number of different models. Comparison was made between the moisture content at a specific location in a given wood component derived from the experiment and that obtained from the simulation. In none of the cases was there complete agreement between results for moisture content of the components obtained from either method and no explanations were provided as to why the discrepancies occurred.
Geving and Karagiozis (1996) reported on field measurements and computer simulations of the hygrothermal performance of wood frame walls in which temperature and moisture content were measured at various locations in the wall assembly. It was conjectured that the ‘overall trend’ was in good agreement between measurements and model predictions of moisture contents in wooden components although the most significant lack of agreement was the higher values obtained from simulation in the early winter period. It was noted, however, that there existed many difficulties related to simulating field experiments in particular, modeling an adequate representation of the imperfections inherent in the real structure as well as uncertainties in the input data.
The task of validating simulation models is both difficult and time-consuming without appropriate tools from which, at least, an overall assessment of the degree to which the model reproduces the experimental results can rapidly be ascertained. It was to this end that a weighing system was conceived that would measure changes in the total weight of any given specimen over a test period. This unique system allowed us to continuously monitor the drying of the various samples (Maref & al 2001).
This paper reports all experimental results derived from a precision weighing system for full-scale wall assemblies. The system is capable of weighing 2.43-m x 2.43-m walls having nominal weights of up to 250 kg roughly to the nearest gram continuously over a test period. The weight data has been used to determine weight loss over time in wood sheathing affixed to a wood-frame wall assembly when exposed to controlled laboratory conditions. The data was used as a basis to benchmark hygIRC.
OBJECTIVES
A series of experiments have been conducted to gather data on the drying rate of full-scale wood-frame wall assemblies as well as wall components subjected to controlled steady and transient state conditions. The experimental work was designed to achieve two main objectives:
1. Measure the overall hygrothermal behaviour of based components in wood-frame construction when subjected to steady and transient state hygrothermal conditions in a controlled laboratory environment; and
EXPERIMENTAL DESIGN Approach
To achieve the objectives, the experimental work consisted of testing both mid-scale [mid-scale experiment results were reported in Maref & al. 2002a, 2002b and 2002d] and full-[mid-scale experiments reported here. As well, in order to verify experimental results and develop a basis for validation of the hygIRC, extensive use of the model was made. The hygIRC model was used to develop the experimental details by simulating conditions to which materials components and assemblies were subjected prior to testing, and thereafter, provided information as to measured response of the various proposed test assemblies.
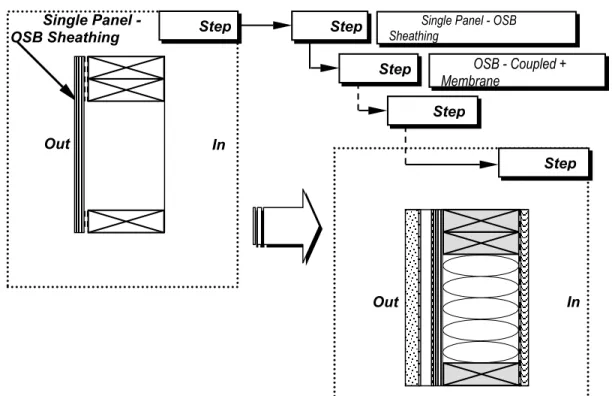
An overview of the different stages being proposed in the evaluation program is provided in Figure 1.
Figure 1 – Step-wise approach for experimental stages to evaluate the Hygrothermal Model OSB - Coupled +
Membrane
Single Panel - OSB Sheathing Step Step Out In Step Single Panel - OSB Sheathing In Out Step Step
The full-scale series were made as wall assemblies having dimensions of 2.43 x 2.43-m. The test was carried out in controlled laboratory conditions over a period of time sufficiently long as to permit quantifying gravimetrically, the change, and rate of change, in the total moisture content (drying) of critical wall assembly components. The full-scale tests were executed in a series of steps, each step comprised of evaluating the hygrothermal response of a full-scale specimen to specified laboratory controlled conditions. The initial step consisted of determining the response of a single sheet of OSB to specified conditions whereas each subsequent step had an increased level of complexity in regard to the number of assembly components being modelled.
This step-wise approach permitted gaining a better understanding of the relative contribution of each component to key hygrothermal effects. In this way, complex assemblies of components were analyzed and their hygrothermal response to steady or transient state climatic conditions characterized in relation to that simulated using hygIRC.
Wall Assemblies
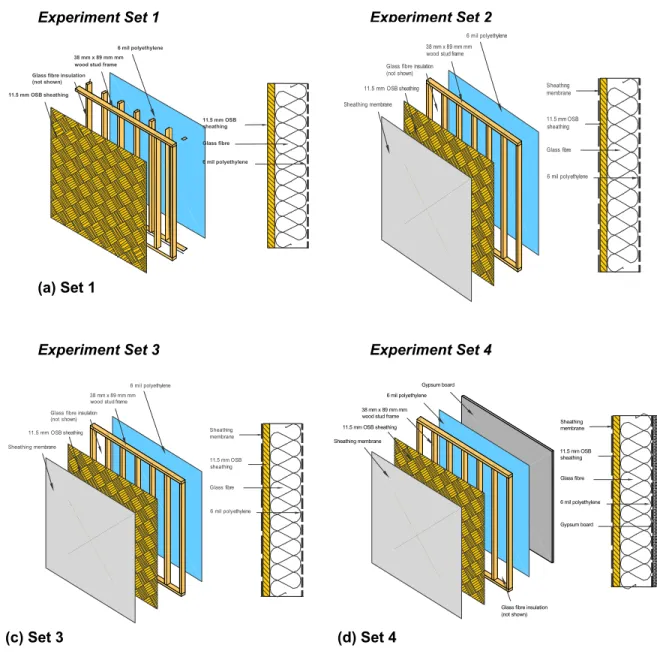
A schematic is provided in Figure 2 that depicts the various components of each of the 4 experimental sets evaluated in full-scale tests. A brief description of each is provided below a summary of which is given in Table 1.
Experiment Set 1. Experimental Set 1 consisted of evaluating the hygrothermal properties of a single sheet of OSB that was de-coupled from the wood frame assembly, this being achieved by coating the wood frame with a lacquer. Fiberglass insulation was added in the cavities between the studs of the assembly. A single sheet of polyethylene was installed on the exterior side of the assembly (laboratory conditions) (see Figure 2 (a)).
Experiment Set 2. Experimental Set 2 consisted of evaluating the hygrothermal properties of a single sheet of OSB that, again, was de-coupled from the wood frame assembly, this being achieved by coating the wood frame with a lacquer. A sheathing membrane (no. VII; polymer-based spun bounded polyolefin) was installed on the OSB sheathing board, fiberglass insulation was added in the cavities between the studs of the assembly and, as in Set 1, a single sheet of polyethylene was installed on the opposite side of the assembly (laboratory conditions) (see Figure 2 (b)).
Experiment Set 3. Experimental Set 3 consisted of evaluating the hygrothermal properties of a single sheet of OSB that was de-coupled from the wood frame assembly. A sheathing membrane (no. IV; asphalt impregnated building paper 60 min) was installed on the OSB sheathing board, fiberglass insulation was added in the cavities between the studs of the assembly and, as in Set 1, a single sheet of polyethylene was installed on the opposite side of the assembly (laboratory conditions) (Fig. 2(c)).
Experiment Set 4. Experimental Set 4 consisted of evaluating the hygrothermal properties of a single sheet of OSB that was de-coupled from the wood frame assembly. A sheathing membrane (no. IV; asphalt impregnated building paper 60 min) was installed on the OSB sheathing board. Insulation was added in the cavities between the studs of the assembly, a single sheet of polyethylene was installed on the opposite side of the assembly and drywall (see Figure 2 (d)).
Table 1 – Full-scale experimental sets, related test materials combinations conditions
Set No. Materials Conditions 1 Wet OSB + Insulation + Polyethylene
2 VII* + Wet OSB + Insulation + Polyethylene 3 IV + Wet OSB + Insulation + Polyethylene 4 IV + Wet OSB + Insulation + Polyethylene +
Drywall
Environmental Exposure Envelope Facility (EEEF)
Experiment Set 1 (a) Set 1 Experiment Set 2 (b) Set 2 Experiment Set 3 (c) Set 3 Experiment Set 4 (d) Set 4 6 mil polyethylene 38 mm x 89 mm mm wood stud frame
11.5 mm OSB sheathing Glass fibre insulation (not shown) Sheathing membrane 6 mil polyethylene Glass fibre 11.5 mm OSB sheathing Sheathing membrane 6 mil polyethylene 38 mm x 89 mm mm wood stud frame 11.5 mm OSB sheathing
Glass fibre insulation (not shown) 6 mil polyethylene Glass fibre 11.5 mm OSB sheathing 6 mil polyethylene 38 mm x 89 mm mm wood stud frame
11.5 mm OSB sheathing Glass fibre insulation (not shown) Sheathing membrane 6 mil polyethylene Glass fibre 11.5 mm OSB sheathing Sheathing membrane 6 mil polyethylene 38 mm x 89 mm mm wood stud frame 11.5 mm OSB sheathing
Glass fibre insulation (not shown) Sheathing membrane Gypsum board 6 mil polyethylene Glass fibre 11.5 mm OSB sheathing Sheathing membrane Gypsum board
Figure 2 – Configuration of full-scale wall assembly specimens: Sets 1 to 4. Specimen Pre-conditioning
Full-scale Specimens were also pre-conditioned to insure that the sheathing boards (OSB) were brought to elevated moisture contents. The pre-conditioning consisted of two phases, immersion and stabilisation. The immersion phase permitted the OSB to quickly reach an elevated level of moisture content. The stabilisation phase insured that the moisture content throughout the component reached equilibrium. The moisture content of the components was monitored on a continuous basis during the stabilisation phase such that the specimen reached the desired moisture content prior to initiating the test program.
The immersion phase took place in a large water tank that permitted the complete immersion of the face of the specimen. The stabilisation phase took place following three days of immersion. Water in the tank was drained and the specimens then remained for another two days to allow moisture to re-distribute itself evenly within the OSB. Care was taken to prevent the boards from drying out by sealing the tank lid with adhesive tape.
CLIMATIC CHAMBER CONDITIONS
Boundary conditions during the experiments were imposed by subjecting the “outdoor” portion of the wall to steady state temperature and relative humidity conditions as achieved using an environmental chamber (Environmental Exposure Envelope Facility - EEEF) (Maref & al 2002e). The facility was capable of maintaining temperature and relative humidity profiles to within ± 1°C and ± 2 % RH respectively over the test period (30-50 days). For “indoor” conditions, temperature and relative humidity on the wall assembly were obtained using combined sensors, data acquisition and recording devices.
RESULTS AND DISCUSSION
Simulations were performed using the Advanced Hygrothermal Model hygIRC to estimate the drying potential of the various mid-scale and full-scale specimens in several sets of experiments, results of which are provided below. The following assumptions were made in carrying out the simulations:
• Liquid transport through the building paper was not modeled; it was modeled as a vapour diffusion control element.
• The contact between the membranes and the OSB sheathing was assumed to be perfect. • The initial moisture content (MC) of the membrane was set to 0%.
The simulations were undertaken using the environmental conditions that existed within the test chamber in which the specimens were placed.
Results from Full-scale Experiments
Experimental Set 1. Since the specimens were immersed in water for 3 days and then allowed to stabilize in a sealed tank, it was assumed that for all specimens the initial MC at the start of the experiment was uniform through the thickness of the material. All results are presented as the total MC distribution over a 2.43-m width of wall as a function of time. Figure 3 shows the comparison between simulated and total measured MC of OSB. The total MC in the OSB sheathing board is initially 51 % and after 33 days it reaches a value of 16%. These results indicate a good agreement between the results obtained from simulation and those derived from experiment. In fact, the greatest difference between the simulated and the experimental results is only 1.4%, which is negligible for all practical purposes.
Experimental Set 2. Similarly for Set 1, Figure 3 shows the change in MC in the OSB derived from simulations and those from experimental results of Set 2. In Figure 4, the greatest difference between the results obtained from experiment and the simulation is 4% MC. It can also be observed from this Figure that an Equilibrium Moisture Content (EMC) is not reached after 16 days. To reach the EMC and complete the experiment, the test would need to be at least 40 days.
Experimental Set 3. Figure 5 shows results from experimental Set 3 in which is provided a comparison of total MC of OSB as obtained from simulated results and that from the experimental work. The total MC in the system is initially ca. 70 %; after 28 days it reaches a value of 24%. The test was stopped after 4 weeks for practical considerations, since the needed information was already obtained. Overall agreement between the experimental and simulated drying curves is good in terms of drying times as well as the shape of the drying curves derived from these experiments. The model didn’t respond to each change in the experiment. This was due to the time step used in the simulation, which is one hour, and in the experiment 2 minutes.
Experimental Set 4. Figure 6 shows results from experimental Set 4 in which is provided a comparison of total MC of OSB as obtained from simulated results and that from the experimental work. The total MC in the system is initially ca. 36 %; after 25 days it reaches a value of 28%. Again, these results indicate a good agreement between results of simulation and those derived from experiment given that the difference between results is no greater than 3 %.
In general, all simulations were able to adequately predict the time required for the OSB sheathing to reach EMC; essentially, hygIRC is clearly able to predict the drying process in these wall assemblies. In each of the experimental steps so far reported, simulation results have shown a good agreement with those derived from experiment in terms of drying times and shape of the drying curves. Indeed, the greatest difference evident when comparing the results derived from simulation and those obtained from experiment are 5%, which is negligible for practical purposes.
CONCLUSIONS
hygIRC has been used as the primarily analytical tool to conduct a parametric study to assess the hygrothermal performance of various wall assembly types subjected to different North American climatic conditions. The overall agreement between experimental and simulated results is very good in terms of the shape of the drying curve and the time taken to reach equilibrium moisture content. A mean set of material properties alone is used in this preliminary investigation. Other material property data on hand at the Institute suggests that the properties can vary within a range. This will be investigated further and reported at a later date. This will further enhance confidence towards the implementation of hygIRC to undertake broader parametric studies.
ACKNOWLEDGMENTS
The authors would like to thank Mr. M.C. Swinton for having provided many useful suggestions regarding both the experimental work and the simulation studies. Our gratitude is also extended to Dr. M.K. Kumaran for his numerous contributions towards completing this task. Thanks are also accorded to Mr. D. Richard of DOCO Microsystems and Dr. N. Krouglicof for having persevered with completing the installation, trouble shooting and commissioning of the precision weighing system. Finally, a word of acknowledgement to the many technical staff who helped in this endeavour and to which we owe sincere thanks for their combined efforts.
NOMENCLATURE
u
Moisture content (%)- (kg moisture/kg dry material) •l
mr Liquid moisture mass flow rate (kg/s m2) •
v
mr Vapour moisture mass flow rate (kg/s m2)
w
k
Liquid moisture permeability (kg/m s Pa)S
Capillary suction pressure (Pa)v
P
Vapour moisture pressure (Pa)T Temperature (K)
t
Time (s)a
V
r
Air velocity vector (m/s) oρ Density of the dry porous material (kg/m3)
v
ρ Vapour moisture partial density (kg/m3)
w
ρ Liquid moisture partial density (kg/m3)
a
ρ Density of air (kg/m3)
w D
Liquid moisture diffusivity (m2/s)
p
δ Water vapour permeability (kg/ m s Pa)
g
r
Gravitational vector (m/s2)p
C Effective specific heat capacity (J/kg K) a
p C
Dry-air specific heat capacity (J/kg K)
l
f Liquid fraction having a value from 0 to 1
λ
Effective thermal conductivity (W/m K)v
L
Enthalpy of evaporation/condensation (J/kg) ice L Enthalpy of freeze/thaw (J/kg) Tρ Actual total density of the material including moisture contribution (kg/m3)
REFERENCES
Hens, H. 1996. Final report Task 1. Modeling and Common Exercises. Summary reports. International Energy Agency, Energy Conservation in Buildings and Community Systems, Annex 24 Heat, Air and Moisture Transport in New and Retrofitted Building Envelope Parts (HAMTIE).
Geving, S. and S. Uvsløkk 2000. Moisture Conditions in Timber Frame Roof and Wall Structures, Test house measurements for verification of heat-, air and moisture transfer models. Project Report 273-2000, BYGGFORSK, and Norwegian Building Research Institute, Oslo, Norway, 50p.
Geving, S. and J.V. Thue 1996, Measurements and Computer Simulations of Hygrothermal Performance of Lightweight Roofs, in: Proceedings of the 4th Symposium of Building Physics in Nordic Countries, September 9-10, Espoo, Finland, pp. 541-548.
Geving, S. and A. Karagiozis 1996, Field Measurements and Computer Simulations of the Hygrothermal Performance of Wood Frame Walls. In: Geving, S. 1997. Moisture Design of Building Constructions, Hygrothermal Analysis Using Simulation Models, Part II: Collection of papers and reports, NTNU Trondheim, Norway, Ph.D. Thesis, June 1997. Faculty of Civil and Environmental Engineering, Department of Building and Construction Engineering, NTNU, Norway.
Kumaran, M. K., "Protecting the long-term performance of building envelope components", Construction Canada, V. 39 (March) 2002, pp. 24-30.
Maref, W. 2001, Lacasse, M.A. and Kourglicof, N., "A Precision weighing system for helping assess the hygrothermal response of full-scale wall assemblies," Performance of Exterior Envelopes of Whole Building VIII: Integration of Building Envelopes (Clearwater Beach, FL, 12/2/2001), pp. 1-7, December 12, 2001 (NRCC-45202)
Maref, W. 2002a, Kumaran, M.K., Lacasse, M.A., Swinton, M.C. and van Reenen, D., "Laboratory Measurements and Benchmarking of an Advanced Hygrothermal Model", proceeding of the 12th International Heat Transfer Conference, August 2002 - Grenoble (France).
Maref, W. 2002b, Lacasse, M.A., Kumaran, M.K. and Swinton, M.C., "Benchmarking of the advanced hygrothermal model-hygIRC with mid-scale experiments", proceeding of the eSim 2002-IBPSA-Canada Conference, Montreal (Canada) Sept 12-13, 2002.
Maref, W. 2002c, Lacasse, M.A., Booth, D.G., Executive Summary of Research Contributions Related to Moisture Management of Exterior Wall Systems (MEWS) - Modeling, Experiments, and Benchmarking, Research Report, Institute for Research in Construction, National Research Council Canada, 127, pp. 15, Dec, 2002 (RR-127)
Maref, W. 2002d, Lacasse, M.A., Booth, D.G., Benchmarking of IRC's Advanced Hygrothermal Model - hygIRC Using Mid- and Large-Scale Experiments, Research Report, Institute for Research in Construction, National Research Council Canada, 126, pp. 38, Dec, 2002 (RR-126)
Maref, W. 2002e, Booth, D.G., Lacasse, M.A., and Nicholls, M., Drying Experiment of Wood-Frame Wall Assemblies Performed in the Climatic Chamber EEEF: Specification of Equipment Used in EEEF-Environmental Exposure Envelope Facility, IRC Research Report, pp. 42, October 18, 2002 (RR-105)
0% 10% 20% 30% 40% 50% 60% 0 10 20 30 40 Time (Days) Tot al Moi s tu re Cont ent ( k gw / kgd) Experiment Simulation
Figure 3 – Set 1: Comparison of the simulated and
measured drying results of OSB layer Figure 4 – Set 2:Comparison of the simulated and measured drying results of OSB layer
0% 10% 20% 30% 40% 50% 60% 0.00 2.00 4.00 6.00 8.00 10.00 12.00 14.00 16.00 Time (Days) Tota l M o is tur e Conte n t (k gw / k gd) Experiment Simulation 0% 10% 20% 30% 40% 50% 60% 70% 80% 0 10 20 30 40 Time (Days) Experiment Simulation
Figure 5 – Set 3: Comparison of the simulated and measured drying results of OSB layer
Figure 6 – Set 4: Comparison of the simulated and measured drying results of OSB layer
0% 10% 20% 30% 40% 50% 60% 0 5 10 15 20 25 30 Time (Days) Tota l M o is tur e Conte n t (k gw / k gd) Experiment Simulation