Publisher’s version / Version de l'éditeur:
Journal of Testing and Evaluation, 27, July 4, pp. 249-265, 1999-07-01
READ THESE TERMS AND CONDITIONS CAREFULLY BEFORE USING THIS WEBSITE.
https://nrc-publications.canada.ca/eng/copyright
Vous avez des questions? Nous pouvons vous aider. Pour communiquer directement avec un auteur, consultez la première page de la revue dans laquelle son article a été publié afin de trouver ses coordonnées. Si vous n’arrivez pas à les repérer, communiquez avec nous à [email protected].
Questions? Contact the NRC Publications Archive team at
[email protected]. If you wish to email the authors directly, please see the first page of the publication for their contact information.
NRC Publications Archive
Archives des publications du CNRC
This publication could be one of several versions: author’s original, accepted manuscript or the publisher’s version. / La version de cette publication peut être l’une des suivantes : la version prépublication de l’auteur, la version acceptée du manuscrit ou la version de l’éditeur.
Access and use of this website and the material on it are subject to the Terms and Conditions set forth at
A new dynamic wind load cycle to evaluate flexible membrane roofs
Baskaran, B. A.; Chen, Y.; Vilaipornsawai, U.
https://publications-cnrc.canada.ca/fra/droits
L’accès à ce site Web et l’utilisation de son contenu sont assujettis aux conditions présentées dans le site
LISEZ CES CONDITIONS ATTENTIVEMENT AVANT D’UTILISER CE SITE WEB.
NRC Publications Record / Notice d'Archives des publications de CNRC:
https://nrc-publications.canada.ca/eng/view/object/?id=1f343409-6c5d-451f-ad49-0a65ea0ca48a
https://publications-cnrc.canada.ca/fra/voir/objet/?id=1f343409-6c5d-451f-ad49-0a65ea0ca48a
http://www.nrc-cnrc.gc.ca/irc
A ne w dyna m ic w ind loa d c yc le t o e va lua t e fle x ible m e m bra ne roofs
N R C C - 4 2 6 5 4
B a s k a r a n , B . A . ; C h e n , Y . ; V i l a i p o r n s a w a i , U .
J u l y 1 9 9 9
A version of this document is published in / Une version de ce document se trouve dans:
Journal of Testing and Evaluation, 27, (4), July, pp. 249-265, July 01, 1999
The material in this document is covered by the provisions of the Copyright Act, by Canadian laws, policies, regulations and international agreements. Such provisions serve to identify the information source and, in specific instances, to prohibit reproduction of materials without written permission. For more information visit http://laws.justice.gc.ca/en/showtdm/cs/C-42
Les renseignements dans ce document sont protégés par la Loi sur le droit d'auteur, par les lois, les politiques et les règlements du Canada et des accords internationaux. Ces dispositions permettent d'identifier la source de l'information et, dans certains cas, d'interdire la copie de documents sans permission écrite. Pour obtenir de plus amples renseignements : http://lois.justice.gc.ca/fr/showtdm/cs/C-42
Appupillai Baskaran,
IYin Chen,2 and Usa Vilaipornsawai
3A New Dynamic Wind Load Cycle to Evaluate
Mechanically Attached Flexible Membrane Roofs
REFERENCE: Baskaran,A., Chen, Y., and Vilaipornsawai. V" "A New Dy.namic Wind Load Cycle to Evaluate Mechanically Attached Flexible Membrane Roofs,"Journal of Testing and
Evaluation,JTEVA, Vol. 27, No.4, July 1999, pp. 249-265.
ABSTRACT: In North America. at present, no test procedure・クセ
ists for certifying roofing systems under dynamic wind loads. To develop such a dynamic test procedure, the National Research Council of Canada (NRC) formed an industry-based 」ッョウッイセ
tium during 1994. The consortium is known as the Special Interest Group for Dynamic Evaluation of Roofing Systems (SIGDERS). This paper reports SIGDERS' progress on、ケョ。ュゥ」セ
load cycle development. Wind tunnel investigations were carried out using two flexible roofing membranes: poly(vinyl chloride) (PVC) and ethylene propylene diene monomer (EPDM). Using the wind tunnel pressure records as source data and comparing the membrane responses of PVC with EPDM, SIGDERS developed a dynamic load cycle. With input from industries, building owners, and roofing associations, the developed load cycle has been gener· alized and extended to evaluate the ultimate strength of flexible membrane roofs. To validate the newly developed load cycle, sev-eral membrane roofing systems were investigated and then reported separately. The SIGDERS load cycle in a laboratory mimics failure modes similarto those observed in the field.
KEYWORDS: wind uplift, roofing membrane, static testing, dy-namic procedure, laboratory procedure, wind tunnel, design pres· sure, certification
Wind is one of the major causes for roofing system failure. To design a durable roofing system, wind perfonnance evaluation is critical. In North America, two types of roofing systems are mainly used: the protected membrane system and the conventional roofing system. In a protected membrane system (also know as upside-down or inverted roof), the membrane (the waterproofing compo-nent) is covered with insulation and thus protected from environ· mental forces. In a conventional roofing system, the membrane is
セエ the top, experiencing environmental forces such as wind, rain, and snow, and temperature changes. The conventional roof system is typically either a built-up roofing system (BUR) or a single-ply roofing system (SPR).
The advancement in roofing membranes offers many choices for SPR, but they also cause some level of discomfort. Whereas
peo-Manuscript received 09103198; accepted for publication 04/26/99.
IResearch officer, Institute for Research in Construction, National Research
Council of Canada, Ottawa. Ontario,KIAOR6 Canada.
2Fonner postdoctoral fellow, Institute for Research in Construction,
Na-tional Research Council of Canada, Ottawa, Ontario,KIAOR6 Canada. JWomen in Engineering and Science student, Institute for Research incッョセ
struction, National Research Council of Canada, Ottawa, Ontario, KIA OR6 Canada.
©1999 by the American Society for Testing and Materials
249
pie have had over 50 years of experience using BUR, they have only had about 20 years with the newer materials. As a result, knowledge acquired in the pasl (i.e., asphalt-based) is of little use for explaining the problems experienced with the new generation (Le., polymer-based) of roof systems. Each system has strengths and weaknesses that need to be taken into account when selecting a roof type (see Table 1).
This paper focuses on the mechanically attached SPR system, in which the membrane is attached to the deck with mechanical fas· teners. Wind effects on such a typical system are shown in Fig. I. When the SPR systems were introduced to the North American roofing market about 20 years ago, the industry used the wind up-lift test melhods that were originally developed for the BUR sys-tems, namely the Faclory MUlual, FM-4470 (1986) and the Under-writers Laboratory, UL-5800 (1991) procedures. These methods do not provide a satisfactory approach to the dynamic process of SPR system response for wind-induced pressure. This resulted in roof failure modes often not consistent with failures observed in the field.
To develop a test procedure for certifying membrane roof sys· terns under dynamic loads, the National Research Council of Canada (NRC) in 1994 fonned an industry-based consortium, Spe-cial Interest Group for Dynamic Evaluation of Roofing Systems (SIGDERS). During its first three years (1994-1997), SIGDERS has focused on the development of a load cycle for mechanically fastened membrane roof systems. Baskaran and Chen[1J outlined a detailed procedure based on the wind tunnel tests of a roofing sys· temゥョ」ャセ、ゥョァ a PVC membrane. In this paper, similar steps arefol-lowed for the wind tunnel data obtained from a roofing system in-cluding an EPDM membrane. Comparisons between these two sets of results are also presented both for the system response and the computed number of load-amplitude cycles. Based on these 」ッュセ
parisons, a new dynamic load cycle is presented here in the context of its use for evaluating the ultimate strength of the flexible mem-brane roofs. This new load cycle offers a variety of options for manufacturers, of which two are summarized.
Investigated Roofing Assemblies
For the present study, the load cycle was developed based on wind tunnel studies of full-scale roof assemblies. Under simulated windflow conditions, roofing systems were tested in the 9 by 9·m NRC wind tunnel. The roofing systems were 3 by 3 m in size and used full-scale roofing components (Fig. 2). The influences of all four roofing components (deck, underlayment, insulation, and membrane) were considered.
Two series of wind tunnel investigations, one in November 1994 and other in October 1995, were carried but using two different
250 JOURNAL OF TESTING AND EVALUATION
TABLE 1-SlImmQlY of .wllle pros and CO/1S ofイッッヲNセ with different
covering.I'.
PVC - THERMOPLASTICSPR
Res!stant to「ゥッャッァゥセ。ャ attack. • Migration of plasticizers Resistant to most aCids and OIls • Shrinkage and embrittlement Fire-resistant • Heat-sensitive
Easy to apply • UV-sensitive
Good on-site seaming • Choice of colors Multi-layers of protection Asphalt-based Track record Asphalt is self-healing Strengths Highlyelastic Resistant to ozone ResistanttoUV \ Durable Weaknesses BUR SYSTEMS • Bli:'itering • Slippage (ifャッキセウッヲエ・ョゥョァ point asphalt) • Labor-intensive (QA and QCj • Splitting(ifweak
reinforcement)
• UV-sensitive (usegranules)
epセM THERMOSETSPR
• Requires careful seaming
• Sensitive to oils, grease, and solvent
• Flammable • Shrinkage
roofing membranes. The first series dealt with a reinforced PVC membrane, the other with a nonreinforced EPDM membrane, Dif-ferences between the two sets of wind tunnel studies in the roofing assembly are given in Table 2.
The measurements were made in smooth wind (uniform) and in a simulated turbulent wind corresponding to an open-country exposure (open). The measurements were taken for two wind directions at different wind speeds. To simulate the effect of varying the internal pressure on the roofing system response, optional openings were made for the EPDM model. Further details of the wind simulation can be found in Savage et al. [21 and Baskaran et al. [3). The tested configurations are summarized in,lable 3.
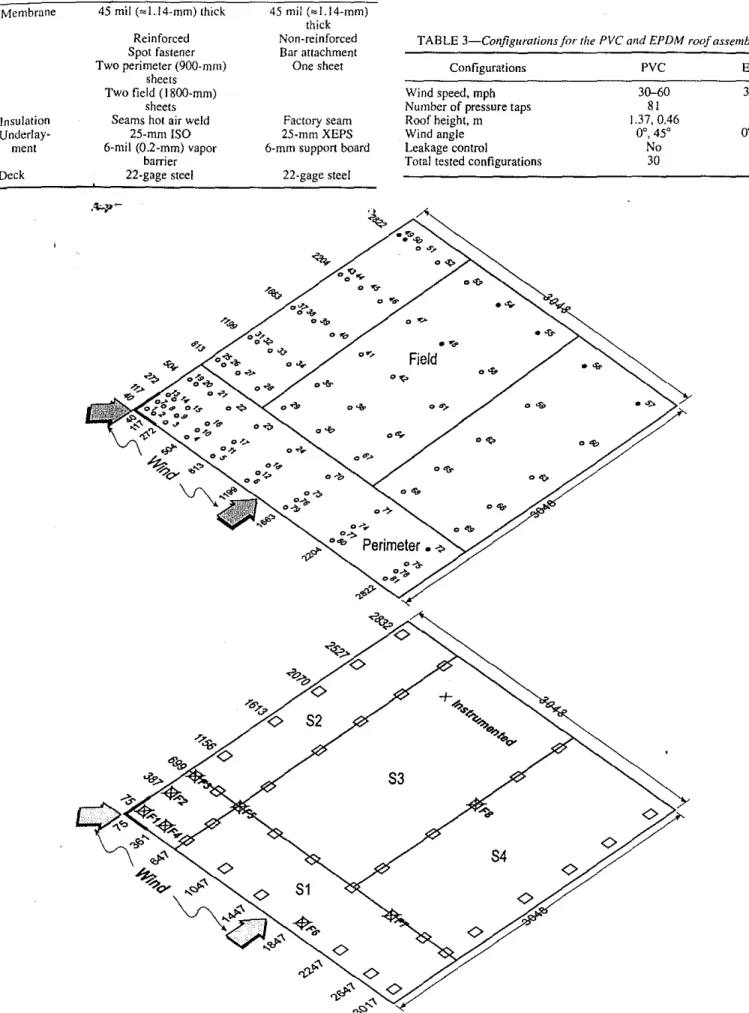
The poly(vinyl chloride) (PVC) membrane and fastener layouts are shown in Fig. 3. Pressure versus time histories were measured at
81
locations. For the load cycle computation, the roof region is divided into "perimeter" and "field." Only measured pressures from these regions are used for the load cycle calculation. As shown, the perimeter region, in particular the corner, has a higher number of pressure taps than does the field region. Ar-rangements for the EPDM assembly are shown in Fig. 4. Different configurations were tested to account for variations in building heights, wind speed, and wind direction for both PVC and EPDM membranes.セ
エエZセイ。ョ・m・ュ「セL。セョセ・セ⦅NN
t
Wtlnd 9\US'", '"
BalloonIng FastenerTension / - I 01
--.
セセセセZ[[ZZZ[Gヲ
セセセセscセ
Deck
FIG. I-Wind effecrs on membraneroofingsystems.
Vapour barrier Full Scale Roofing Section
NNL]M]]セセZ[ANN
12mm Ply..vood Skin Simulated Leakages セU
Wind (45°)
TAI3LE2-DiffereIlCl',\' befH'eell PVC((lidEPDM roo/assemblies,
System Component PVC EPDM
Membrane 45 milHBBiNjTセュュI thick
Insulation Underlay· ment Deck Reinforced Spot fastener Two perimeter (900-0101) sheets Two field (I800-mm)
sheets Seams hot air weld
25-mm ISO 6-mil (0.2·0101) vapor barrier RRセァ。ァ・ steel 45 mil H.14-mm) thick nッョセイ・ゥョヲッイ」・、 Bar attachment One sheet Factory seam 25-mm XEPS 6-01m support board 22-gage steel
TABLE 3-Configurarions for rite PVC and EPDM roof assemblies.
Configurations PVC EPDM
Wind speed,mph 3D-60 30-75
Number of pressure taps 81 100
Roof height,m 1.37, 0.46 1.37
Wind angle 0°,45° 0°,45°
Leakage control No Yes
Total tested configurations 30 48
Nセ
....
.
.......
.
." . " ,Field
....
.
セ.
セL....
.
...
....
.
... . " , Nセセ.
.". . " ,....
• ->-
.
...
NセN.
.,.
• '" Perimeter. ->
<V-b
<:>
+",
セMサ_52
BBセ
<:>
""..,.
.-...,.
53
セ<>
<>
54
<>
51
セ
<>
<>
セ<>
'l-'"
.p-
<>
'"
0><>"-"-FIG.3-Pressure taps arrangemellf {/ndjwfetlcr {/llachmentlayolIlJor the PVC roofassembly module.
rl
i
252 JOURNAL OF TESTING AND EVALUATION
.
"'s-NセNL^ ッセL ッ^セ ;'> ;>v セ
0'0
ro'"
...
..
.,'"
...<0"'"
..
10'"'"
:t.
..#
:t.
セ ..,.
セ"'''''''
0>, -"-"-> 9' "-"'->9' セ 9'FIG.4--Pressure raps arrangement andfastener attachment layout for the EPDM roofassembly module.
Measured System Response
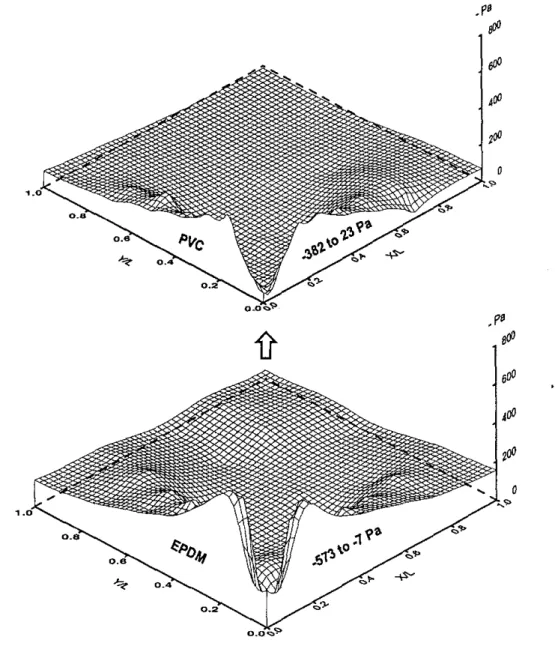
In Fig. 5, the PVC and EPDM system responses are compared as mean pressure surface plots. Plots of this nature provide an overall pressure distribution for the roof assembly. The presented distribu-tion is for the 45° wind angle. EPDM experiences a higher mean pressure for the same wind condition than PVc. This is also true for other test conditions (refer to Table 2 for component differences between the two systems). Measured mean pressures ranged from - 573 to -7 Pa in the case of the EPDM compared to - 383 to 23 Pa for the system with the PVC membrane. Positive pressure on the
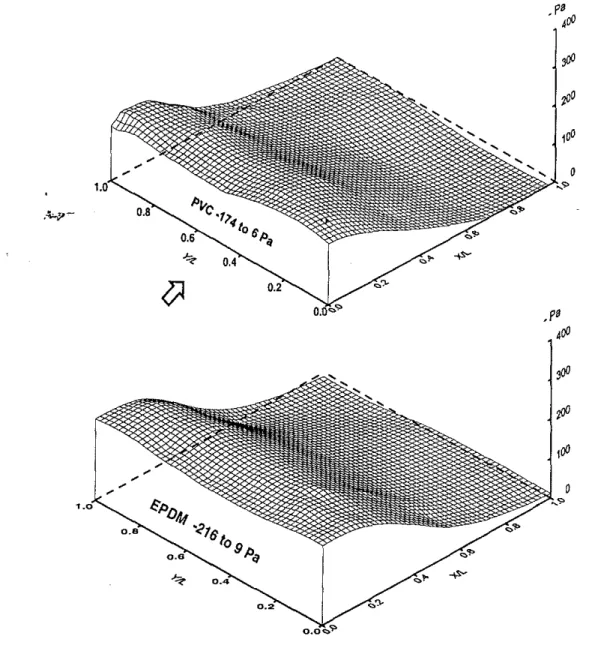
roof assembly indicates reattachment due to the incoming wind over the roof surface. Similar observations were made in the case of wind approaching normal to the roof surface. Surface plots of the mean pressure for normal wind conditions are shown in Fig. 6. Wind-induced pressures are negative and higher near the edges compared to the field of the roof due to flow separation. In this case, both roofs experience positive pressures (6 Pa for PVC and 9 Pa for EPDM).
Overall distribution features, such as high suction near corners and moderate pressure distribution at the roof field, are common to both systems. Also, when wind flows over these assemblies, the
membrane deflects between the attachment locations shown in Figs. 3 and 4.It is critical to note that the observed pressure、ゥウエイゥセ
bution pattern is totally different from that expected from the shape of the deflected membrane. This indicates that neither the number of sheets used nor the attachment patterns followed haveウゥァョゥヲゥセ
cant influence on the windMinduced pressure distributions. As will be discussed laUer, this phenomenon is a key factor in deciding upon a common dynamic test procedure for the two assemblies.
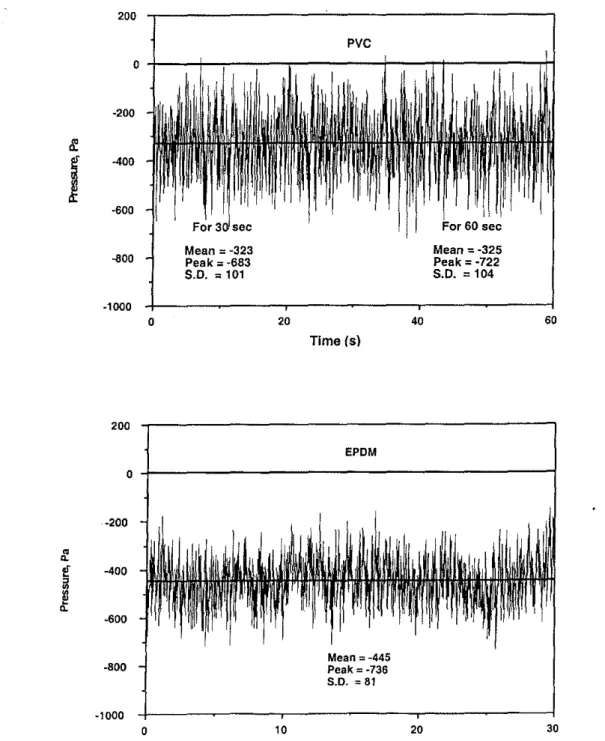
The individual time histories of the pressure fluctuations also were analyzed to identify the difference in the wind-induced pres-sure distribution between the two roof assemblies (Fig. 7 shows one such comparison). A sampling rate of 500 Hz was used to record theseエゥュセイゥ・ウN The duration of the time history キ。セI
60 s for the PVC and 30 s for the EPDM roof assembly. From Savage et al. [2], the simulated wind had a time scale of 51: 1. This means that 1 s'in the wind tunnel is equal to 51 s at full scale. For the first series of wind tunnel studies with the PVC roofing assem-bly, pressure records were of 60-s duration, which represented a full-scale windstonn of 3060-s duration. Such collected data pro-vide a total of 30000 (60 X 500) discrete samples in each time
his-BASKARAN ET AL. ON FLEXIBLE MEMBRANE ROOFS 253
tory. By dividing the data samples into SPセウ records of 15000 pieces of data, statistical parameters were computed as follows:
Parameters of a 30-s record Mean
=
-323 Peak=
-683 S.D.=
101 Parameters of a 60-s record Mean=
-325 Peak= -722 S.D. = 104Thus, 30-s and 60-5 records provide similar statistical parame-ters for the measured time history. Examination of different time histories for variation in the wind angle, wind speed, and building height revealed the same observation. Thus, it was decided for the wind tunnel tests on EPDM that 30-5 records were sufficient.
Nev-FIG.5-Measured system response jor PVC and EPDM roof assemblies (angle ==450
254 JOURNAL OF TESTING AND EVALUATION
FIG.6--Measured system reJponse for
pvc
and EPDM roofassemblies (angie= 0°).I
[
,
ertheless, as indicated in Fig. 5, the number of pressure taps was in-creased from 81 to 100 for the EPDM roof assembly,
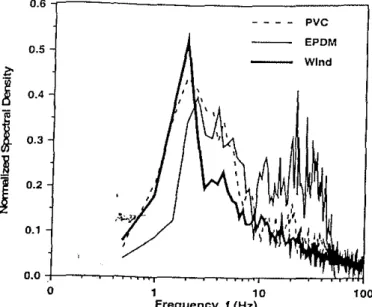
A comparison of the time histories of PVC and EPDM shows that PVC has many low-frequency peaks. whereas EPDM has many high-frequency peaks. To understand this more clearly, spec-tral analyses were performed on these time histories. Figure 8 shows the normalized spectral density of typical pressure records forPVCand EPDM (measured at the perimeter region on the roof). A low-pass filter with a cut-off frequency of 50 Hz was used to eliminate high-frequency noise recorded in the pressure-time his-tories. For comparison, the spectral density plot of the incoming wind was also included. Three distinct response regions were no-ticed at three different frequency bands:
I, Up to a frequency of about 2 Hz. the approaching wind and PVC record show similar energy distributions. In comparison, EPDM has lower energy.
2, For the frequency range of 2 to
to
Hz. both PVC and EPDM have similar energy distributions and higher than the energy of the approaching wind.3. For frequencies above 10 Hz, the energy content of EPDM ex-ceeds that of both the approaching wind and of PVc. This is due to the fact that a flexible EPDM membrane experiences a greater fluttering effect than the relatively rigid PVC mem-brane. The fluttering effect is caused by the approaching wind.
Comparison of the Computed Load Cycle
A computer program has been developed to count the number of cycles from the pressure-time histories of PVC and EPDM roof as-semblies. The rain flow counting (RFC) method was used since this method is more suitable for a random distribution process [4]. A four-step procedure (for details see Baskaran and Chen[1])is ap-plied for the computed number of cycles as follows:
Step I: Identify the pressure tap for each region (perimeter or field regions),
Step 2: Apply the RFC method,
Step 3: Count the number of cycles for each tap.
Applying these four steps to all the wind tunnel pressure records (twO materials: PVC and EPDM; five different approaching wind speeds: 30,40,50,55, and 60 mph; two different approaching wind angles: 0' and 45'), a load cycle database was obtained [5J. This database was used for further load cycle development.
From this database, a typical 10 by 10 matrix for the perimeter region is shown in Table 4. Data of PVC and EPDM are included for comparisons. M in the rows represents the mean normalized pressure values;
R
in the columns represents the range nonnalized pressure. BothMandRare tabulated from 0to I in increments of 0.1. By combining the load matrices of the individual pressure taps, the load matrix for each region was developed. Combining the in-dividual load ofセエNXセウウオイ・ taps developed the load matrix ofエィセNエBASKARAN ET AL. ON FLEXIBLE MEMBRANE ROOFS 255
PVC system for the perimeter region. Since the EPDM perimeter region has 40 pressure taps, the EPDM load matrix reflected the combined effect of the 40 pressure taps.
The data in Table4represent the45'approaching wind. In Table 4, 122 occurrences were counted for the PVC, where each Occur-rence has a mean value of 0.1 and ranges from 0 to 0.1. For the same mean and range pressures, 145 occurrences were counted for the EPDM, indicating that EPDM has a higher number of cycles than PVc. This has been generally so for mean values(M)for the RangesRI, R2,andR3.For other pressure ranges (R),PVC has a higher number of cycles than EPDM. Note, however, that most counts appear in the previous pressure range. Table 5 groups the number of cycles with the wind approaching normal to the surface.
200 PVC 0 -200 セ
I
-400 -600 I.For 30 sec For 60sec
Mean=M323 Mean=-325 -800 Peak _ -683 Peak - ·722 S.D. _ 101 S.D. - 104 -1000 0 20 40 60 Time(s) EPOM 200 0 ·200
•
..
セ -400,
0 セ..
·600 -800 -1000 0 10 Mean=-445 Peak=-736 S.D. =81 20 30 Timels\256 JOURNAL OF TESTING AND EVALUATION
0 . 6 , - - - ---,
By comparing Tables 4 and 5, two features become evident: (1) the number of cycles is greater for the 45° record than for the record obtained from the normal wind; (2) the differences between PVC and EPDM are not distinct with normal wind compared to the dif-ferences withthe 45° record.
To eliminate the effect of wind directionality from the load cy-cle development, the counted numbers of cycy-cles from the 0° and 45° pressure records were combined. A newM by R matrix was formulated by selecting the maximum value between the 0° and 45° data from each of these tables. This procedure is similar to the conventional approach used in wind standards to determine design pressure coefficients from wind tunnel data. Based on this, one can obtain the maximum number of cycles for e.ach region
correspond-'.1iog to the respective mean and range pressures. This completes
counting for one wind speed condition. The four-step procedure is also repeated for all other tested wind conditions listed in Table 3. The data of the all tested configurations were combined to cal-culate the maximum number of cycles for each roof assembly. For PVC, there are 30 different test configurations, whereas in the case ofEPDM, 48 configurations were tested. This process yielded the maximum number of cycles that one may encounter among the PVC EPDM 0.5 Z.
]
0.4!
0.3]
l
0.2 0.1 0.0ct.Mセセセセ . . . .MセセセセNL⦅セセ⦅Z⦅mo
1 10 100 Frequency.f(Hz)FIG.8-Comparison a!spectral density functionsfor the response a/the
PVC and EPDM roofassemblies.
TABLE 4-M by R computed matrix/or the perimeter region a/the PVC and EPDM roof assemblies (Angle = 45°).
Al A2 A3 A4 A5 A6 A7 AS A9 Al0
PVC EPOM PVC EPOM PVC EPOM PVC EPDM PVC EPOM PVC EPDM PVC EPDM PVC EPDM PVC EPDM PVC EPDM .. Ml 122 145 135 248 33 22 6 1 2 0 0 0 0 0 0 0 0 0 1 0 M2 224 129 251 231 59 36 26 6 15 3 3 0 2 0 1 0 0 0 0 0 M3 194 laa 294 336 61 64 26 35 26 9 25 1 10 0 3 0 0 0 0 0 M4 106 114 141 211 61 64 26 19 26 3 14 1 B 0 4 0 2 0 0 0 M5 a6 133 140 31a 52 96 21 29 10 7 11 3 7 0 3 0 1 0 2 0 M6 33 61 69 245 19 135 5 136 0 49 1 11 0 5 0 1 0 0 0 0 M7 7 48 10 132 2 56 0 25 0 11 0 7 0 3 0 1 0 0 0 0 M6 0 21 0 48 0 6 0 2 0 0 0 0 0 0 0 0 0 0 0 0 M9 0 1 0 0 0 0 0 0 0 0 0 0 0 0 0 0 0 0 0 0 Ml0 0 0 0 0 0 0 0 0 0 0 0 0 0 0 0 0 0 0 0 0
TABLE 5-M by R computed matrix/or the perimeter region a/the PVC and EPDM roo/assemblies (Angle = 0°).
Rl R2 Rl FlI R; III R7 III FIl RlO
p,c ER:M p,c ER:M p,c ER:M p,c ER:M p,c ER:M p,c ER:M p,c ER:M p,c ER:M p,c ER:M 1'.1:: ER:M
M1 33 0 7 0 0 0 0 0 0 0 0 0 0 0 0 0 0 0 0 0 M! 7J 31
ro
42 ;)I 2 4 0 1 0 0 0 0 0 0 0 0 0 1 0 Ml 22 61 2i 100 15 25 6 5 2 2 2 0 0 0 0 0 0 0 0 0 MI 2 2 1 2 15 25 0 1 0 1 1 0 1 0 1 0 0 0 0 0 M; 1 0 1 0 0 0 0 0 0 0 0 0 0 0 0 0 0 0 1 0 M; 0 0 0 0 0 0 0 0 0 0 0 0 0 0 0 0 0 0 0 0 M' 0 0 0 0 0 0 0 0 0 0 0 0 0 0 0 0 0 0 0 0 Ml 0 0 0 0 0 0 0 0 0 0 0 0 0 0 0 0 0 0 0 0 Ml 0 0 0 0 0 0 0 0 0 0 0 0 0 0 0 0 0 0 0 0 MlO 0 0 0 0 0 0 0 0 0 0 0 0 0 0 0 0 0 0 0 0BASKARAN ET AL. ON FLEXIBLE MEMBRANE ROOFS 257 the ord VC elif- cy-lIld vas Illd (he :gn an ld-;.es IS .1. :li-or se he Ie
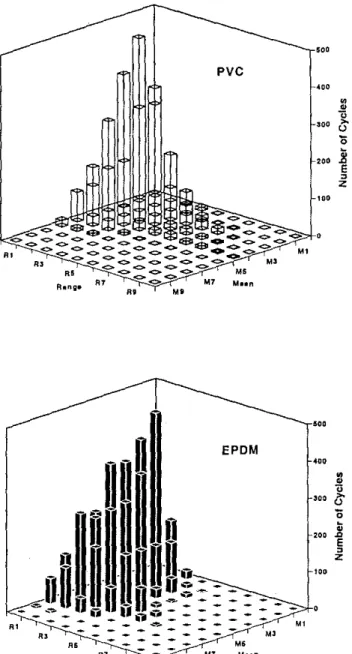
tested configurations. This calculated number of cycles is plotted in Figs. 9 and 10.
Figure 9 shows the counted number of cycles for the perimeter region, while Fig. 10 displays the field region. Horizontal axes in these figures provide mean(M)and range(R)pressures. Theカ・イエゥセ cal axis has the number of cycles for each combination of mean and range pressure(MandR).Several features are evident from these figures. and some of them are;
• The perimeter region has a higher number of cycles than the field region.
The EPDM'roofing assembly has a greater number of cycles than thepvNセ・ュ「ャケ under the same wind conditions. '.l Most cycles occur in the pressure ranges RI, R2. and R3 for the perimeter region.
Most'cycles occur in the combination ofRI,R2. and R3 and MI, M2, and M3 for the field region.
The number of cycles computed for any
M
byR
is always less than500.pvc
""
."
•
-1i'"
is
1; 20'Z
E,
Z 10',
."
pvc
'"'
•
•
"
'"
(),..
1;'"
Z
e
,
z'"
."
IOU
EPDM'"
•
{lャッセセエッ
'"
is
1; セ'"
セe
.
セセョmュAセセZZZZMM
z,
'"
-
MMGMMBセセMMMM
-
-.,
_ _ -e- _ _.,
R>.,
••
••
R.nge R7 M' M•• n••
M'FIG. 9-Comparisonfor the most critical M by R matrix computed for
Ihe PVC and EPDM roofing assemblies (perimeter region).
""
セoo
EPDM."
>!•
o
Mョャセャ
u >00is
1; 200セ
E,
Z 100..
- - -
セ-
-
-
Ml.,
- - - -
M''s
MS Renge.,
M' M. .n••
M.FIG. to-Comparison of the most critical M by R matrix compuledfor
the PVC and EPDM roof assemblies (field region),
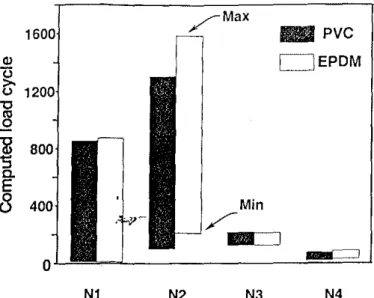
To develop a laboratory procedure for certifying full-scale roof-ing assemblies. data of the above M by R matrixes were reorga-nized into different pressure zones with their respective number of cycles. Eight pressure zones were selected in two groups:
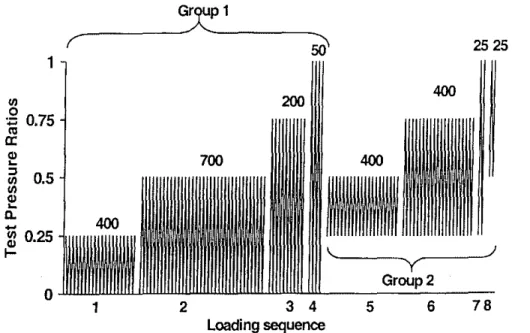
Group 1: NI (0.0 to 0.25), N, (0.0 to 0.5). N, (0.0 to 0.75), N, (0.0 to 1.0).
Group 2: N, (0.25 to 0.5), N6(0.25 to 0.75), N7(0.25 to 1.0)
and N, (0.5to 1.0).
The number of cycles for each zone was then gathered. This was achieved by examining each cell of theMbyRmatrix, If the」ッュセ bination of means and range pressure falls into a particular pressure zone, the cycles were counted for that pressure zone. Figures 11 and 12 show the computed number of cycles for PVC and EPDM, re-spectively. for Group I and Group 2, For each pressure zone,ュゥョゥセ mum and maximum values are shown, They are obtained by con-sidering data from different wind speeds <lnd <lpproaching <lngl es .
tern response energy is higher than that of the approaching wind. This means that the wind-induced loads are transmitted through the fasteners of the roof to the deck [6J. Extensive studies carried out in the past and comparison with field data indicate that a duration of 900 s is sufficient to cause about 75% of the damage [7J. With that in mind, the difference in the number of cycles in Group 2 be-tweenEPDM and PVC
will
have less impact in the development of a generic dynamic load cycle, as discussed below.To account for most of the above considerations, the computed number of cycles has been rationalized for various load sequences irrespective of wind speed. Figure 13 shows the proposed number of cycles for Groups I and 2. Typically forN" the computed num·
ber of cycles ranges from 100 (200) to 1300 (1600) based on the PVC (EPDM) wind tunnel time histories, whereas after rational-ization, N2has 700 cycles. In the case of N3,the rationalizedョオュセ ber of cycles is equal to 200, even though it ranges from J23 to 216. The rationale behind the selection process is based on the expected fatigue effects on the roof assembly. Note that N] and N) have dif-ferent pressure zones with increasing magnitude from N1 to N). Similar arguments are also valid for Group 2. The number of cycles of N, ranges from 0 to 375 for PVC and from 0 to 500 for EPDM, whereas 400 cycles are selected. Thus, the present load-cycle de-velopment procedure simplifies the wind speed dependability on the number of cycles. However, the wind speed effects are consid-ered in the test pressure calculation as discussed below.
The load cycle consists of eight load sequences with different pressure ranges (see Fig. 13). The maximum pressureHケセ。クゥウI for a test corresponds to the design pressure, in accordance with local building codes or wind standards. The pressures for each load se· quence are calculated as percentages of the design pressure for the test (Table 6). The eight load sequences can be divided into two groups. Group I represents wind-induced suction over a roof。ウセ
sembly. It consists of fOUf sequences, where the pressure level al-ternates between zero and a fixed pressure.
Recently, internal pressure variations were explicitly codified in the North American wind standards American Society of Civileョセ
gineers Standard 7·95 (ASCE, 1995) and the National Building Code of Canada 1995 (NBCC, 1995). Development of a test proto·
Development of a Dynamic Load Cycle
The development of a full-scale test procedure requires several levels of generalization of the true wind-induced effect over a roof ' Iassembly. Often, these generalizations warrant compromise from
the technically sound approach to the practically acceptable one. Thc present study had the luxury of receiving input from all parties con'cerned with roofing, including researchers, manufacturers, roofing associations representing the contractors, and building owners. (Refer to the acknowledgment section for the consortium participants.)
Six attributes for the development of a dynamic load cycle were selected from the concerns raised by the members and are listed, based on priority, as follows:
I. Mimic as much as possible real wind effects.
2. Simulate failure modes similar to those under real conditions. 3. Be easiertoapply in a common laboratory environment. 4. Allow for the variation in roofing components and materials. 5. Have a reasonable test-processing time of not more than a day,
including setup and testing.
6. Be compatible with local building codes and wind standards.
N8
_ PVC DEPDM N7N6
N5
o
800
1200
258 JOURNAL OF TESTING AND EVALUATION
1600
/MaxBpVC
Ql DEPDM<:i
>-
1200
u "0 III .Qal
800
S
CoE
8
400
Min 1-/
0
N1
N2
N3
N4
FIG. ll-Comparison oj/he computed load cycle for PVC and EPDM
roofassemblies (GroupJ).
FIG. 12-Comparison of/he computed load cycle PVC and EPDM roof
assemblies (Group 2).
Group I of the EPDM roofing assembly (N,
+
N,+
N)+
N4 )has 2711 cycles, compared with 24 J I for the PVC roofing assem· bly. For Group 2 (N,
+
N,+
N7+
N,), EPDM has 2574 cycles, compared with 862 cycles for the PVC. The difference in the num· ber of cycles between PVC and EPDM roofing assemblies is much larger for Group 2 than for Group 1. The reason is that the tested EPDM wasnonreinforced and therefore much more flexible than the reinforced PVC (see Table I). In addition, as grouped in Table 2, the PVC system had a vapor barrier, whereas a support board was used for the EPDM system. The flutter effect induced by wind on this typeofEPDM is more severe than for the PVc. Note that the wind tunnel records of the PVC represent a full*scale wind-storm lasting 3060 ss; for EPDM, the wind-storm lasted 1515 s. Multi· plying the EPDM cycles by 2 may provide direct comparison with the PVC if one is interested in the variation of the total number of cycles. However, as shown previously in Fig. 8, significant energy for the response of the EPDM system is contributed by high·fre· quency components. Moreover, at those high frequencies, thesys-BASKARAN ET AL. ON FLEXtBLE MEMBRANE ROOFS 259 Ind. the out ion 'ith be-lof raj Jof )111 Ie. es I"S, ng m Ie
d.
col must account for such variations (8). Group 2 represents the・ヲセ
feets of exterior wind fluctuations combined with a constantゥョエ・セ
rior pressure on a building. In Group2, a constant minimum static pressure is applied to the roof system, and the pressure level。ャエ・イセ nates between this minimum and the maximum pressure for each sequence. For example, in Load Sequence5,a constant suction of 25% of the maximum pressure is applied and the gusts arc applied above this constant static pressure. The roof membrane is lined by static pressure, and thus Group2 mimics membrane tension effects that are aimedtosimulate fatigue at the fastener locations.
By applying the above load cycle. NRC's dynamic roofing fa-cility has tested
a
wide range of systems with differentイッッヲM」ッカ・イセing materials. ゥセeAゥョァ PVC. thermoplastic polyolefins (TPO); modified bitumen (Mod Bit). and EPDM. The failure mechanism andヲ。ゥャオイセ load compare favorably with the UEAtc test procedure [9Jthat cails for a large number of low-intensity cycles. In addition. the failure modes produced by the SIGDERS load cycle are also similar to the failure modes observed during field investigations
[/o--13J. These findings and validation of the SIGDERS load cycle
have been documented for PVC[14],Mod Bit [/5J,and TPO [l6J systems. The SIGDERS load cycles have also been compared with existing dynamic standards available from the literature (Table 7). Static protocols(FMand UL) are excluded from the comparisons. Australian Standard Technical Report 440 (TR 440, 1978) was developed mainly for metal roofs after cyclone Tracy, as apartof the Darwin Area Building Manual (DABM, 1976)[/7J.With the in-clusion of recent research by Mahendran[18-19],this fonns part of the design requirements of the Australian Building Code (SAA.
1989). The Building Research Establishment (BRE) standard, the British Building Code, focuses on temperate regions, and theョオュセ
ber of cycles corresponds to a 50-return period [6J. The VEAtc Guide fora mechanically fastened waterproof covering should be regarded asasupplement to the VEAtc "Technical Guide [formerly called "Directive"J for the Assessment of Roof Waterproof Sys-tems" and relates to a roof connected to the load-bearing structure by point or linear fasteners. TheVEAte procedure is based on the research efforts of Gerhardt and Kramer in the 1980s[9,20].VEAtc features, how it compares with and how it differs from the proposed SIGDERS load cycle, are well documented by Baskaran et al.[2/J.
Development of the Southern Building Code Congress International Standard 12 (SBCCI-SSTD 12) is based on the work of Letchford and Norville [22].It is used mainly for determining the impact reM sistance of wind-borne debris. A systematic comparison of these load cycles (see Table 7) leads to the following observations:
I. Total number of cycles applied by such procedure varies, and the total number of cycles ranges from 14/5 to 10200. 2. lッ。、セ。ューャゥエオ、・ ratios with respect to Pmax also vary with each
procedure.
3. VEAtc and BRE have more low·intensity ャッ。、セ。ューャゥエオ、・ cy-cles. Both of them apply only one cycle for the load-amplitude ratio ranging from0to IofPmax'
4. All procedures. with the exception of VEAtc and BRE. apply the required number of cycles only once,
5. Only in the VEAtc is the ultimate strength of the system evaluM ated by testing the system to failure.
セ
GA'_P_l
_
セ
2525
200 400 セMMIy
Group 2
400 7B5
6
•
2 3 4
Loading sequence
FIG.13-Dynamic load cycle for the evaluation offlexible membrane roof systems.
Sequence Number of 400 gusts Pressure range 0-25 (percentage of max pressure)
TABLE6--Sequences of SIGDERS load cycle.
Group I Group 2
2 3 4 5 6 7 8
700 200 50 400 400 25 25
260 JOURNAL OF TESTING AND EVALUATION
TABLE7-Comparison of the SIGDERS dynamic load cycle with theexislingstandard
r
t
North America
Australia UK Europe
TR440 BRE UEAtc SBCClfSSTD S!GDERS
F'g" N p's N P's N P's N P's N セNVRU 8000 セNY I セNT 500 0.3-1.0 50 セNRU 400 セNWU 2000 セNT 960 セNV 200 0.5-D.8 1050 セNU 700 0-1.0 200 セNV 60 セNX 5 PNセNV 50 セNWU 200 セNU 240 セNY 2 0.2-D.5 3350 0-1.0 50 セNX 5 0-1.0 I 0.25-D.5 400 セNW 14 セNY 2 0.25-D.75 400 0-1.0 I セNX 5 .0.25-1.0 25 Lセセ セNV
.,
200 0.5-1.0 25 セNT 500Apply Apply 1281 Apply 1415 Apply 4500 Apply 2200
10 200cycles cycles five times cycles several cycles once cycles once
once times,tillfailure
Qp's = proportiontoPmi...; N=: number of cycles.
NGI = the total number for cycles for Group I, and
P
=
the maximum test pressure in psf (47.8 Pa).Equation I is plotted as a solid line in the graph, covering the pressures ranging from 15 to 120 psf (717 to 5736 Pal· The
mea-Proposal for a Generalized Dynamic Load Cycle
Evaluating for ultimate strength of the roofing system is of ma-jor importance to the manufacturer. As was presented in Fig. 13,
the current SIGDERS load cycle may not provide this information. Let us consider a particular situation of a manufacturer who ウ・セ
lee ted a system and tested
it
with Pmax as 60pSf(2868 Pa)accord-ing to Fig. 13. If the system successfully passes all the 2200 cycles, itcan be certified asP60.However,P60is not the ultimate strength of the system. For the manufacturer, this information is vital to dis-tinguish the design of one-system components from other designs.
Consequently, jfthe manufacturer decided 1O test the above system
withPm" equal to 90 psf(4302 Pal and it failed before passing all the 2200 cycles, the manufacturer is required to redesign the sys-tem components. Thus, the SIGDERS load cycle as presented is useful for those who have a clear understanding of their system strength or for those that have tested similar systems in the past. Based on past experience, they can select the appropriatePmaxfor which the system can pass all the required cycles at a maximum pressure level.It is not a viable solution when new products and in-stallation procedures are constantly evolving. To address this con-cern, the SIGDERS load cycle has been extended. The extension of the SIGDERS load cycle covers design pressure ratios ranging from 1 to 2 with increments of 0.25 or pressures ranging from 60to 120 psf (2868 to 5736 Pal with increments of 15 psf (717 Pal. The process involved is explained in the following text.
Toforecast the number of cycles at pressure levels that are not tested in the wind tunnel, a plot arrived by comparing the total number of cycles at different pressure levels for Group I is required (Fig. 14). Both PVC and EPDM dala are included at various mea-sured wind-tunnel pressures. These ten meamea-sured data points are used to derive a logarithmic equation.
sured data points for PVC are similar to those for EPDM. This ex-ercise is also repeated for Group 2 (see Fig. 15). The dotted line shown in Fig. 15 has the following イ・ーイ・ウ・ョエ。エゥッョセ
(2) 20 120 15 Pressure Ratio 1a a5 30 NG2
=
885 log (P) - 2304 ... a/EP
M1/
セNiiN
Proposed'\
a,f
""-, pvcセngャ
'" 154 log(P).417 ; P In Pst NG1 .. 154 log(P).101 1; P In pa 1Pst=47.8 Pa 100a
a 1000ーイ・ウウセセ・L
P {pstfOFIG. 1セtッエ。O number of cycles computed at different measured
pres-su}es (Group1).
where
NG2 = the total number fur cycles for Group 2, and
P
=
the maximum test pressure in psf.Equations I and 2 can be used to forecast the required number of cycles for pressure levels 60, 75, 90, lO5, and 120 psf (2868,3585, 4303,5019, and 5736 Pal (hereafter abbreviated as P60 ,P", P90 ,
P105 , and P120 ). In Figures 14 and 15, the proposed numbers of
cycles are also indicated as A symbols. The proposed numbers of cycles are less lhan those derived from the equations forP60and
P75 ratings. Typically for a P75 rating, the proposed numbers of
cycles for Group I and Group 2 are 2050 and 1250, respectively. However, based on Eqs I and 2, respectively, the requiredョオュセ
(I) NGI
=
1544 log (P) - 4178.,.BASKARAN ET AL. ON FLEXIBLE MEMBRANE ROOFS 261
Ratio Group I Group 2
1.00 1350 850
1.25 2050 1250
1.50 2500 1600
1.75 2900 1700
2.00 3250 1750
TABLE8-Proposed number of cycles for each group.
Rating
Pressure
iments carried out at the Dynamic Roofing Facility (DRF) using 'he VEAtc load cycles and the SIGDERS load cycles clearly sup-ported elimination of the low-intensity gusts. In addition, this elim-ination is beneficial if one considers the reduction in the testing time. Reasonable test-processing time (not more than a day includ-ing setup and testinclud-ing) is one of the six attributes identified by the SIGDERS members. Based on the above discussion, the required numbers of cycles at various pressure ratings are shownin Table 8. One question remains to be answered how should the total num-ber of cycles be distributed to each load sequence of the two groups? ForP60,the distribution was made according to the wind tunnel pressure record. In other words, the number of cycles is the same as that of Fig. 13.The Y-axis no{malized pressure ratios are multiplied by 60. Both Group 1 and Group 2 maintain 'he same dis-tribution. To identify the number of cycles for other ratings, the fol-lowing procedure has been adopted.
First assume that the roofing system has been tested forP60and
the system passed all the 2200 cycles. To increase 'he system rat-ing from
P
60 toP
7S , what is the additional number of cycles towhich the system should be subjected? Here the intent is to add only the necessary pressure amplitude cycles that the system has not experienced. The system accumulated fatigue stress because of various pressure amplitude cycles by P60 . It is assumed that the
stress on the system is introduced linearly as pressure increases
P
w P" P90 PlO5 Pl20 120 20 15 10 Pressure Ratio 0.5 30 o 0 EP M/
a
a
I- --A- - ,
-f
--0 0 Proposed('
0 セ'"
PVCNG2 .. 885 log(P) • 2 04; P In PsI NG2=885 log(P) • 5728jPlnPal'
1Pst=47,8 Pa 100 o 1000Are based on the most critical data, Le., the 0° and 45° wind angle (see Figs. 9 and 10).
Consider all pressure taps of the perimeter or field region (see Tables 3 and 4).
bers of cycles are 2490 and 1520. A reduction of 440 (17%) for Group I and 270 (17%) for Group 2 has been made
'0
accelera'e the testing time. Similar reductions also have been applied to P60' Nevertheless, for the roofing system response, these reductions may not be significant when one recalls that Eqs I and 2:Moreover, as
it
will be shown in Fig. 16, these reductions are achieved byelimiMtffig only the low-intensity gusts, High-ioteD;.1 sity gusts are maintained the same for all pressures. Severalexper-press6uOre, P (Psf}90
FIG.15-Total number of cycles computed at different measured
pres-sures (Group 2),
f-'-"-'''-'416
セ
.
1...
.1 ... i ....I !....t ..,....ヲサgイッセ|
Iセセセセ
400セ
\2V '\iiJ
... >,
セMK⦅IセヲG」ZNYNNZMSBGXT
\1V
0 400-400...!
0-57 150 200-50 セ , !1 j...
" '"T'" ...l 0-19o
400-700ヲサgイッセ|
lヲAs|セセセ
セ|wWセ
,
P'5
P
60p,.
(::3)
Hセセ HセMZZI
fffj__
IセHRZセ
セセ[I
6
400-500700- (200+501 200-50 400-[25+25)400- (25+25) U50+5oJ 350 [75+25セ
'\ii7
262 JOURNAL OF TESTING AND EVALUATION
Si\
セ
セ
セ
セ
セ
セ]cスMセ⦅IN
セUNSセ
400
G
セ
セUNVG
25
セPNVG
25
セ
セ
セ
セM[BMMMGINセ
セ
セ
セ
セセセセ
セセセセ
P
IOS}
セV
6
)66
o
250 50 400.700 700-アZoKsセ
200-{セセ
U
S + 2J
b
300J
400- 300 400- 5+2 50+5 25+25FIG. 17-DistriburiorJof numberofcycles foreach load sequence (105 rating).
セ
\iiJ
セセ
セ
\ijJ
セセ
\iiJ \iiJ
セセ
'CV
\iiJ
セ
セ
C
"O
セ
400· 25+25 25+25セセセ
\ii7 :
\ I l
: u'"
1 400- 25+25J
I 25+25,
RPPG{セセ}
セHイッB|
\
,
ョgイッセ
\
セセセサBBAセMTセセセセセ
セセセ
:
,
セセセセ
,,
ヲゥᆪ|Mlセ
\1V :
\ I l
セLNNウ:
,
,
セセセ
\ii7 : \ I l
=--r--=:I'j,
:,
,,
,
}
セ
o
セ
400.500WPPG{QセoKUセ
150+50 SOP
oo PUGP"
PIOSBASKARAN ET AL. ON FLEXIBLE MEMBRANE ROOFS 263
taセle 9-Differenr pressure zones forP75.
1. Identity the pressure zones for P75. Table 9 presents the tcst pressure ratios and pressure zones forP75.
2. Eliminate the cycles that were already accounted for byP6(). from one level to the nex!. This ''fatigue acculllu/arirJII" assumption is valid for increases in pressure (force) while the system response is elastic; beyond the elastic range, nonlinearity develops [23]. With this in mind, here is an example for P7S:
3. Distribute the remaining cycles into the new pressure zonesfor each group. A flowchart of the distribution process is shown in
the Fig. 16.NI of the P75has already been covered by Ihe N, of theP60'Hence, N1is eliminated forP 75 •Similarly,N 2ofP75has
only 500 cycles due to the fact thatN, of P60accounted for 200
cycles. Nevertheless, forN, (pressu!e range 0 to 75), all 50
cy-cles should be applied. Similarly in Group 2, Ns is eliminated whereasN, and N, have all (he 25 cycles. In the distribution of
the number of cycles forPlO5 ,similar procedures are followed
as shown in the Fig. 17. Figure 18 displays the Pl2Gscenario.
For example, the number of cycles required by NI ,N5 , and N6 are already covered. Nevertheless, high· intensity gusts of N4 ,
N7 ,and Ngare maintained, as before, at 50 and 25. Required number of Group 1 cycles forP75 = 2050. Number of Group I cycles accounled for byP60
=
1350. Remaining number of Group I cycles for P75 = 2050 -1350=
700.• Similarly, number of Group 2 cycles forP75 = 1250 - 850
= 400.
The extended new dynamic load cycle is shown in Fig.19.It has five rating levels (A to E). This load cycle can be used to evaluate
o
to 19 (0 to 896)o
to 38 (0 (01793)o
(0 56 (0 (0 2689) 0(075 (0 to 3585) 19 to 38 (896to 1793) 19 (0 56 (896to2689) 19 (0 75 (896 (0 3585) 38to75 (1793to3585) Psf (Pa) Pressureo
to 25o
to 50o
to 75o
to 100 25 to 50 25 to 75 25 to 100 50to100 Ratio. % of Pmax Loads・アオセョ」・t
t
t
t
1100 cycles for 1.25P 2525I'
7 8 P=
Design Pressureo
6 25 25id'
Group 2o
E
o
o
o
B
A
2525..iill'
50 50 100 100 50 150 200 250 2 3 4 5 Loading sequence GrQUp 1o
o
o
Number 01 gustsf
2.00 1.50 1.00 0.50o
1.75 1.31 0.88 0.44 0.63 0.31o
1 0.75 0.5 0.25o
o
50 2525fセ
1_';;'-0
MMMMjゥjjMMMZセ
__
._OO_II....J1
0::
_ 1.25セ
'"" 0.94264 JOURNAL OF TESTING AND EVALUATION
the ultimate strength of the membrane roof systems ortoevaluate
the system response for dynamic pressures ranging from 60to 120
psf(2868 to 5736 Pa). This extended procedure provides various
options for the roofing community. Two of them are presented be-low:
Option I: Design System Wilh Safety Factors
This is similar to the generalized lab procedure developed
by Baskaran and Chen[1]. This procedure is designed to
sat-isfy the regulatory requirements. Here design pressures are
used to convert the ratios on the Y-axis of Fig. 19. Design
pressures are bastedOn the local wind standards or building
code minimumイ・セアセゥ{セュ・ョ{ recommendations. Systems that pass Level A can'l)etested with the design pressure increased incrementally by 0.25. These levels provide manufacturers' systems with safety factors, while the building codes or wind standards prescribe only "minimum design values." The
pro-ーッウセ、 load cycle distribution is presented for doubling the design pressures, giving a safety factor of2.Other features
of the load cycle, such as the need for Group I and Group 2,
remalO the same as explained in Fig. 13.
Option2:Certification of System Rating
This option is used mainly for system rating identification. This process can start with an initial pressure of
60
psf(2868Pal· If the system passes all 2200 cycles, the assembly with
the respective components gets the approval rating ofP6Q.
By continuing the test with the same assembly, the manufac-turer can increase the system rating with QUセーウヲ increments.
As shown in Fig. 19, a system that passes an additional 1100 cycles (or in total 2200
+
1100= 3300) gets P" approvals.Similarly, for thePI20approval, the system will be subjected
to another 1200 cycles from the 90-psf (2868-Pa) rating or a total of 2200
+
1100+
800+
500+
400=
5000 cycles.Concluding Remarks
A unique wind-tunnel investigation has been carried out to iden-tity the response of the membrane roofing system to wind effects.
Both thennoset (EPDM) systems and thennoplastic (PVC) systems
were investigated and had similar response trends. Wind-induced fluctuations were higher for the nonreinforced, thermoset system compared to the reinforced, thermoplastic assembly. This 、ゥヲヲ・イセ
ence in response was observed at high frequencies where the ap-proaching wind has minimum energy. Using an extensiveーイ・ウウオイ・セ
time history database, a new dynamic load cycle was developed. Applicationof thedynamic load cycle on roofing systems with var-ious flexible membranes confirmed that it could produce failure modes similar to those observed in roof failures in the field.
Correlation curves between the required number of cycles and measured pressures have been developed. These curves were used to forecast the required number of cycles for four pressure levels (75,
90, 105, and 120 psf) that are not observed in the wind tunnel.
Com-bining these with the previously developed load cycle, procedures :vere formulated to evaluate the ultimate strength of membrane roof-mg systems. Investigations are in progress to validate the use of the extended dynamic load cycle for different membrane roof systems.
Acknowledgments
The SIGDERS consortium carried out the presented research. It consists of:manufacturers(Canadian General Tower Ltd., Carlisle
SynTec Inc, GAF Materials Cooperation, Firestone Building Prod· ucts Co., IKG Industries Canada, JPS Elastomerics Corp. Con-struction Products Group, Soprema Canada, Vicwest Steel);build· ing owners (Canada Post Corporation, Department of National Defense, Public Works and Government Services Canada); and;
associations(Canadian Roofing Contractors' Association, Indus-trial Risk Insurers, National Roofing Contractors' Association and Roof Consultants Institute).
References
[1] Baskaran, A. and Chen,
Y.,
"Wind Load Cycle Development for Mechanically Attached Single Ply Roofs," Journal ofWind Engineering and Industrial Aerodynamics, Vol. 77, 1998, pp. 83-96.
[2J Savage, M. G., Baskaran, A., Cooper, K. R., and Lei, W.,
"Pressure Distribution Data Measured During the November
1994 Wind Tunnel Tests on a Mechanically Attached, PVC Single-Ply Roofing System," IAR Report LTR-A-003, Na-tional Research Council, Ottawa, Canada, 1996.
[3] Baskaran, A., Savage, M.G.,Alfawokhiri, F., and Cooper,K.,
"Pressure Distribution Data Measured During the October
1995 Wind Tunnel Tests on Mechanically Attached EPDM Single Ply Roofing Systems," Internal Report LTR-A-004,
Institute for Aerospace Research, National Research Council
of Canada, July 1996.
[4J Xu, Y. L., Mehta,K. C., and Reordon, G. F., "Fatigue of Metal Roof Cladding Subject to Wind Loading. Part I:
Fatigue-Re-lated Characteristics of Roof Pressures,"Proceedings of 9th
ICWE, New Delhi, India, 1995, pp. 1067-1078.
[5J Chen, Y. and Baskaran, A., "Development of Load Sequence
using Pressure Records Measured from Wind Tunnel Studies
for Mechanically Attached Single-Ply PVC and EPDM
Roofs," Internal Report 743, Institute for Research in Con-struction, National Research Councilof Canada,June 1997. [6] Cook, N. J.,The Designer's Guide to Wind Loading
ofBuild-ing Structures, Part 2,Static Structures, Butterworths,
Lon-don, 1990.
[7J Jancauskas, E. D. J., Mahendran, M., and Walker, G. R.,
"Computer Simulation of the Fatigue Behavior of Roof Cladding during the Passage of a Tropical Cyclone,"Journal of Wind Engineering and Industrial Aerodynamics,Vol. 51,
1994, pp. 215-227.
[8] Zarghamee, M.S.,"Wind Effects on Single-Ply Roofing Sys-tems,"Journal af Structural Engineering, ASCE, Vol. 116, 1990, pp. 177-187.
[9J Gerhardt, H. J. and Kramer,
c.,
"Windiョ、オ」セ、
Loading Cy-cle and Fatigue Testing of Lightweight Roofing Fixations,"Journal of Wind Engineering and Industrial Aerodynamics,
Vol. 23,1986, pp. 237-247.
[10] Gerhardt, H. J., "Roofing Membranes-Observed Damage,
Failure Modes, Failure Hypotheses and Laboratory Testing,"
Proceedings of the Roofing Wind Uplift Testing Workshop,
Oak Ridge, TN, 1989, pp. 19-34.
[1 I] Kramer,
c.,
"Damage and Damage AnalysiS of RoofingSys-tem for Large Industrial FlatRoof Buildings,"Proceedings of International Conference on Building Envelope Systems and Technology, Nanyang Technological University, Singapore,
1994, pp. 573-578.
[/2J Kramer,
c.,
"Typical Failure Modes of Building Envelopes,"9th International Conference on Wind Engineering, 1995, pp. 1231-1242.
rod- 'on-lild· lila! Inc!; lus-lind Icnt
'OJ
77, 'N., ber VC ,,-K., 'er'M
14, cil (al c-',iI ce cs VI 11-
,-,I' Ii I,"
I I,
I
I
[131 Smith, T.L., "Improving Wind Perform,nce ofMech,nic,lIy Att,ched Single-Ply Membrone Roof Systems: Lessons from Hurricane Andrew," Proceedings of the iX Congress, inter·
national Waterproofing Association, Amsterdam, 1995, pp. 321-348.
[14]' Bosk,ron,A. ,nd Lei, W., "ANew Facility for Dynomic Wind Performance Evaluation of Roofing Systems," Proceedings
of the 4th International Conference on Roofing Technology,
NRCAINIST, Washington, DC, 16-18 Sept. 1997, p. 14_ [15] Chen, Y., Baskaran, A., and Lei, W., "Wind Load Resistance
of Modified Bitumenous Roofing Systems," Journal of
Construction and Building Materials, Vol. 12, 1998, pp.
471-480. NGセB
[16] Baskar,n, A., Lei, W_, and Richardson,
c.,
"Dynamic Evalu-' atien of Thermoplastic Roofing Systems for Wind Perfor-mance," Journal ofArchitectural Engineering, ASCE, Vol. 5, No.1, 1999, pp. 16-25.[17] DABM, "Darwin Area Building Manual," Darwin Recon-struction Commission, Northern Territory of Australia, 1976.
[18] Mahendran, M., "Fatigue Behavior of Corrugated Roofing under Cyclic Wind Loading," Transactions of the institution
BASKARAN ET AL. ON FLEXIBLE MEMBRANE ROOFS 265
of Engineers, Australia, Civil Engineering, Vol. CE 32, No.
4, 1990, pp. 219-226.
[19J Mahendron, M., "Effect of Overload Cycles on Thin Steel Roof Claddings during Cyclone Winds," Journal of Testing
and Evaluation, ASTM, Vol. 22, No 5, 1994, pp. 453-459. [20] Gerhardt, H. J. and Kramer, C., "Wind Lo,ding and F'tigue
Behavior of Fixings and Bonding of Roof Coverings," Jour·
nal of Wind Engineering and Industrial Aerodynamics, Vol.
23, 1988, pp. 237-247.
[21) Baskaran, A, Paroli, R. M., and Booth,R. 1., "Wind Perfor-mance Evaluation Procedures for Roofing Systems; Current Status and Future Trends," Proceedings of the 5th
Interna-tional Conference on Building Envelope Systems and Tech· nology, Bath,U.K., 1997, pp. 37-54.
[22J Letchford, C. W. and Norville,H. S., "Wind Induced Pressure Loading Cycles for Wall Cladding During Hurricanes," Gl,ss Research and Testing Laboratory, Texas Tech University, Lubbock, TX, 1993.
[23] Dowling, N. E., "Fatigue Failure Predictions for Complicated
sエイ・ウウセsエイ。ゥョ Histories," Journal of Materials, Vol. 7, No.1, 1976, pp. 71-87.