HAL Id: hal-01651500
https://hal.archives-ouvertes.fr/hal-01651500
Submitted on 29 Nov 2017
HAL is a multi-disciplinary open access
archive for the deposit and dissemination of
sci-entific research documents, whether they are
pub-lished or not. The documents may come from
teaching and research institutions in France or
abroad, or from public or private research centers.
L’archive ouverte pluridisciplinaire HAL, est
destinée au dépôt et à la diffusion de documents
scientifiques de niveau recherche, publiés ou non,
émanant des établissements d’enseignement et de
recherche français ou étrangers, des laboratoires
publics ou privés.
Climate control on late Holocene high-energy
sedimentation along coasts of the northeastern Atlantic
Ocean
Clément Poirier, Bernadette Tessier, Eric Chaumillon
To cite this version:
Clément Poirier, Bernadette Tessier, Eric Chaumillon. Climate control on late Holocene high-energy
sedimentation along coasts of the northeastern Atlantic Ocean. Palaeogeography, Palaeoclimatology,
Palaeoecology, Elsevier, 2017, 485, pp.784-797. �10.1016/j.palaeo.2017.07.037�. �hal-01651500�
Contents lists available atScienceDirect
Palaeogeography, Palaeoclimatology, Palaeoecology
j o u r n a l h o m e p a g e : w w w . e l s e v i e r . c o m / l o c a t e / p a l a e o
Climate control on late Holocene high-energy sedimentation along
coasts of the northeastern Atlantic Ocean
Clément Poirier
a,*
, Bernadette Tessier
a, Eric Chaumillon
baMorphodynamique Continentale et Côtière, Université de Caen Normandie, CNRS, Caen 14000, France bUMR 7266 LIENSs, CNRS/Université de la Rochelle, 2 rue Olympe de Gouges, La Rochelle 17000, France
A R T I C L E I N F O
Article history: Received 13 April 2017
Received in revised form 28 July 2017 Accepted 31 July 2017
Available online 2 August 2017 Keywords: Radiocarbon Meta-analysis Coastal barrier HSP Teleconnection A B S T R A C T
Abundant sedimentological and geochronological data gathered on European sandy coasts highlight major phases of increased high-energy sedimentation in the North Atlantic Ocean during the late Holocene. Owing to an inconsistent use of the terminology, it is often difficult to determine whether studies have described storm-built or wave-built deposits. Both deposits can be identified by overall similar coarse-grained sedi-mentary facies, but may provide contradictory paleoenvironmental interpretations. The aim of this study is to address this issue, by analysing a set of published14C ages recovered from wave-built sediment bodies of
the Pertuis Charentais (France). Integration of14C data highlights seven coarse-grained sedimentation pulses
(CSPs) that reflect a synchronous increase in wave-induced sediment supply occurring around 2650, 2420, 1240, 970, 800, 650 and 450 cal. yr B.P. CSPs can be matched with geochronological data published on other exposed sandy coasts of the western Europe. In first order, CSPs were preserved during phases of decreased storm activity and thus limited coastal erosion in the North Atlantic Ocean from 2700 to 2000 and from 1200 to 600 cal. yr B.P. In second order, CSPs occurred during positive NAO and/or negative EA/WR peaks, which are known from previous studies to induce higher waves and to enhance wave-induced sediment transport in the Pertuis Charentais. Chronological boundaries of CSPs could be used as a diagnostic tool to differentiate storm deposits indicative of sudden, episodic very high-energy sedimentation from wave deposits resulting from the sustained action of above-average westerly winds blowing across the North Atlantic Ocean.
© 2017 Elsevier B.V. All rights reserved.
1. Introduction
Sandy coasts represent an important proportion of the world’s oceanic shorelines, typically occurring in energetic wave-dominated areas. Over timescales of hours to millennia, the morphological evolution of sandy coasts is determined by a dynamic equilibrium in the budget between sediment supply (resilience) and erosive events (destruction;Masselink and van Heteren, 2014). It is widely acknowledged that individual storm episodes can induce rates of coastal erosion far exceeding those observed during sustained fair weather conditions (Morton and Sallenger, 2003). Owing to the attractiveness of these landscapes, sandy coasts are often densely populated areas (Zhang and Leatherman, 2011). Forecasted accel-eration of sea-level rise (Rahmstorf, 2007), combined with changes in wind and wave climate (Dobrynin et al., 2012), might modify
*Corresponding author.
E-mail addresses:clement.poirier@unicaen.fr(C. Poirier),
bernadette.tessier@unicaen.fr(B. Tessier),eric.chaumillon@univ-lr.fr(E. Chaumillon).
sediment budgets on these shorelines, thus putting more coastal populations at risk of storm-surge flooding (Chaumillon et al., 2017). Abundant sedimentological and geochronological data gathered on European sandy coasts highlight major phases of storminess in the North Atlantic Ocean during the late Holocene. Disagreement between studies remains high, which is related to a great extent to the heterogeneity of sediment records involved. However, we also believe that the term “storminess” in itself is used inconsistently across publications. Some studies use “storminess” to designate the intensity of prevailing westerly winds blowing across the North Atlantic Ocean (e.g.Orme et al., 2015). Here, we use instead “stormi-ness” in the meaning of e.g.Sabatier et al. (2012)orSorrel et al. (2012), to designate the recurrence of extreme, sudden meteorolog-ical events lasting a few hours to days, associated with storm surge and wave runup that have strong potential for coast erosion. Stormi-ness should be interpreted as a measure of the intensity and/or frequency of these morphogenic events that may fluctuate over a given period of time.
Following this definition, periods of increased storminess in the North Atlantic Ocean were shown to be tied to short-lived cooling
http://dx.doi.org/10.1016/j.palaeo.2017.07.037
events recorded as ice-rafted debris maxima (IRD;Bond et al., 2001; Sorrel et al., 2012). Temporal variability of the IRD time series dis-plays three dominant oscillations of about 2400, 1450 and 1000 years (Debret et al., 2007). The 2400- and 1000-yr oscillations are associated with long-term changes in solar forcing. The 1450-yr cycle, which is expressed more strongly than the two former since about 6000 cal. yr B.P., is likely related to internal variability of the North Atlantic Ocean(Debret et al., 2007; Sorrel et al., 2012) and/or of the Arctic Ocean (Darby et al., 2012). This internal forcing likely drives fluctuations of the subpolar and subtropical gyres that modulate the strength and trajectory of storm tracks in the North Atlantic Ocean (Sorrel et al., 2012). It affects the occurrence of storm events on western European coasts, which have been grouped into five “Holocene Storm Periods” (HSP;Sabatier et al., 2012; Sorrel et al., 2012). The most recent HSP corresponds to the Little Ice Age (LIA), i.e. to the Bond cycle 0 (Bond et al., 2001). Steepening of the meridional temperature gradient during the LIA is frequently invoked as a plausible mechanism needed to trigger stronger storms in the North Atlantic Ocean at that time(Dezileau et al., 2011; Lamb and Frydendahl, 1991; Trouet et al., 2012), in possible conjunc-tion with low-frequency changes in sea surface temperature driving tropical cyclogenesis (van Hengstum et al., 2015).
There is a fundamental dichotomy in the sedimentary expression of HSPs. Onshore, HSPs are associated with the widespread forma-tion of massive aeolian dune fields and coversands stretching along the coasts of western Europe(Alexanderson and Bernhardson, 2016; Bateman and Godby, 2004; Clarke et al., 2002; Clarke and Rendell, 2006; Clemmensen et al., 1996; Clemmensen and Murray, 2006; Clemmensen et al., 2009; Costas et al., 2013,2012, 2016;Gilbertson et al., 1999; Jelgersma et al., 1995; Nielsen et al., 2016; Sommerville et al., 2007; van Vliet-Lanoë et al., 2016; Wilson and Braley, 1997; Wilson et al., 2004), also recorded as the deposition of thin wind-blown quartz layers over soils (Jackson et al., 2005) and peat bogs (Björck and Clemmensen, 2004; de Jong et al., 2006, 2007; Kylan-der et al., 2016; Orme et al., 2015, 2016; Sjögren, 2009; Tisdall et al., 2013). Aeolian activity was initiated during the last glacial termina-tion (Costas et al., 2016) that gave rise to the periglacial “European Sand Belt” (Zeeberg, 2008), the most recent phase of dune forma-tion being the LIA. In marine settings, the sedimentary expression of HSPs is more diverse. A dominant feature is the presence of discrete, millimetre to centimetre thick shelly sand to gravel layers embedded in back-barrier lagoonal successions(Degeai et al., 2015; Dezileau et al., 2011; Sabatier et al., 2008)or in marsh fine-grained sediments (Billeaud et al., 2009), interpreted as the imprint of barrier destruc-tion and sand over wash (Chaumillon et al., 2017). These discrete coarse layers are also recognised offshore, in the wave-influenced outer section of estuaries(Baltzer et al., 2014; Sorrel et al., 2009). Another dominant feature is the detection of discrete erosional dis-continuities in estuaries(Billeaud et al., 2009; Tessier et al., 2010) and lagoons (Ferrer et al., 2010), indicative of prolonged phases of sediment remobilisation and/or erosion.
Owing to an inconsistent use of the terminology, it is often dif-ficult to determine whether these studies have described storm or wave deposits. Both have overall similar coarse-grained sedimentary facies, but may provide contradictory palaeoenvironmental interpre-tations. Storm deposits resulting from sudden meteorological events may be indicative of coastal destruction. Inversely, wave deposits resulting from the sustained action of above-average westerly winds may be indicative of coastal progradation. Accurate stratigraphical and geochronological data, correlated across coasts within the same climatic zone, are therefore needed to better constrain these discrep-ancies. As described above, the sedimentary expression of HSPs is illustrated by abundant data, but less is known in contrast about the evolution of European sandy coasts between HSPs, in a context of weakened storm intensity and/or frequency. The aim of this study is to address these two issues, by analysing a set of14C data obtained on
coarse-grained sediment bodies of the Pertuis Charentais regressive coastal environment (France), and by comparing results with similar sand bodies in western Europe.
2. Study area
The Pertuis Charentais area was chosen because it has received much attention over recent decades, with abundant stratigraphical, sedimentological and geochronological data (Allard et al., 2008, 2010; Bertin et al., 2008; Bertin and Chaumillon, 2006; Billeaud et al., 2005; Chaumillon et al., 2008, 2004; Chaumillon and Weber, 2006; Poirier et al., 2011; Weber et al., 2004a,b). Previous studies have demonstrated the vulnerability of the Pertuis Charentais to storm events(Baumann et al., 2017a,b; Breilh et al., 2014), and its ability to record climate changes of the past centuries to decades(Allard et al., 2008; Poirier et al., 2011, 2017).
2.1. Geological setting
The study area is located along the Atlantic Coast of France (Fig. 1A), in Charente Maritime (46◦N, 01◦W), and corresponds to the northern boundary of the Aquitaine Basin, at the contact with the Armorican Massif (Fig. 1B;Biteau et al., 2006). Anticlines and syn-clines formed in the northern part of the Aquitaine basin during the late Cretaceous and Paleocene, in response to compressive deforma-tion of the crystalline basement related to Pyrenean orogeny (Sibuet et al., 2004). Differential erosion of Mesozoic to Cenozoic loose marls and sandstones in synclines during the Pleistocene contributed to the formation of NW–SE incised valleys, which provided a large accom-modation space for deposition of Holocene marine and continental sediments (Fig. 1B;Chaumillon et al., 2008; Chaumillon and Weber, 2006; Weber et al., 2004a,b).
2.2. Geomorphology
The study area is referred to as the “Pertuis Charentais”. The word “pertuis” locally designates the outer marine segment of three main incised valleys (Chaumillon et al., 2008), which extend inland into large low-lying coastal marshes (Breilh et al., 2013). They include, from north to south (Fig. 1B):
• The Pertuis Breton (260 km2) and Poitevin marsh (980 km2),
which correspond to the paleo-valleys of the Sèvre Niortaise, Vendée and Lay rivers(Chaumillon and Weber, 2006; Weber et al., 2004a),
• The Pertuis d’Antioche (450 km2) and Rochefort marsh (240
km2), which correspond to the paleo-valley of the Charente
River(Chaumillon and Weber, 2006; Weber et al., 2004b), • The Pertuis de Maumusson and Arvert marsh (170 km2), which
correspond to the paleo-valley of the Seudre river (Chaumillon et al., 2008). The Pertuis de Maumusson, unlike the two former bounded by rocky shores, is a 1.5 km wide sedimentary tidal inlet (Bertin et al., 2004).
The Pertuis Charentais seafloor is shallow, with more than 90% of its total area between 0 and−20 m NGF (French reference vertical datum, zero being mean sea level at Marseille), and 65% between 0 and−10 m. Mesozoic bedrock outcrops in the marshes to an altitude of +6± 2 m NGF on average (from +2 up to +20 m NGF), compared to an average marsh elevation between +1.6 and +3.4 m NGF (Breilh et al., 2013).
2.3. Wave climate
The area is affected by semi-diurnal tides ranging from less than 2 m (neap tides) to more than 6 m (spring tides), and by waves
46°30’ N 46°00’ N 45°30’ N 02°00’ W 01°30’ W 01°00’ W 00°30’ W Poitevin marsh Rochefort marsh Br. Pertuis Breton Pertuis d’Antioche P. de Mau-musson M.-O. Fig. 2 Fig. 3 Fig. 4 Holocene Pleistocene Pliocene Eocene Late Cretaceous Late Jurassic Middle Jurassic Early Jurassic Paleozoic Neoproterozoic Arvert marsh Seudre marsh Armorican Massif Armorican Massif Aquitaine Basin 5 km Atlantic Ocean France A) Atlantic Ocean G. E. Ch. R. B)
Fig. 1. A, Map of Europe, showing the location of the Pertuis Charentais. B, Simplified
continuous land-sea geological map of the area, showing the location of the three study areas. Labels in italics correspond to toponyms cited in the text. M.-O., Marennes-Oléron Bay; Br., Brouage Marsh; Ch. R., Charente River; G. E., Gironde Estuary.
originating from the North Atlantic Ocean. Two main wave climate categories can be distinguished: (1) low to moderate wave condi-tions (height Hs1/4 = 0.8–2.5 m, period Tp1/4 = 6–12 s, direction
Dirp1/4= 274–292◦) more frequent during summer and
represent-ing 58–69% of the annual wave climate and (2) energetic wave conditions (Hs1/4= 2.5–9.4 m, Tp1/4= 11–15 s, Dirp1/4= 265–280◦) more frequent in winter and representing 15–27% of the annual wave climate (Bertin et al., 2008). Owing to complex hydrodynamic and bathymetric interactions within the Pertuis, wave energy along the coast is decayed by almost one order of magnitude relative to offshore conditions (Allard et al., 2008).
At the annual to decadal time scale, the position, strength and trajectory of low-pressure systems across the North Atlantic Ocean is controlled by Northern Hemisphere atmospheric cir-culation patterns, the most prominent being the North Atlantic Oscillation (NAO;Barnston and Livezey, 1987; Rogers, 1997). The NAO atmospheric circulation pattern, along with the East Atlantic (EA), East Atlantic–West Russia (EA/WR) and Scandinavian (SCAN) patterns, indirectly affects wave height, period and direction in the North Atlantic Ocean (Martínez-Asensio et al., 2016, and ref-erences therein). Recent (1948–2014) nearshore wave climate and resulting wave-induced longshore sediment transport have been
computed from a high-resolution wave hindcast along the Arçay sand spit (Fig. 3A;Poirier et al., 2017). Within the Pertuis Breton, the NAO and EA/WR patterns respectively account for 25.2 and 20.6% of the winter (December to February) longshore sediment transport variability, while the contribution of EA pattern is minor (3.6%) and that of SCAN is not significant. Longshore sediment transport increases with positive NAO and negative EA/WR con-ditions (Poirier et al., 2017), both being associated with higher offshore and nearshore waves in the area (Martínez-Asensio et al., 2016).
2.4. Holocene evolution
Internal architecture, sedimentology and timing of deposition of the Holocene sediment infilling of the outer marine Pertuis Charentais have been extensively investigated with very high-resolution seismic surveys ground-truthed by sedimentary cores and
14C dating(Chaumillon et al., 2004; Chaumillon and Weber, 2006;
Weber et al., 2004a,b), with particular emphasis on the Marennes-Oléron Bay(Allard et al., 2010; Billeaud et al., 2005; Poirier et al., 2011). Inland, Holocene sediment infilling of the coastal marshes has been described from sedimentary cores, with a focus on the record of relative sea-level changes in the Poitevin Marsh(Clavé et al., 2001; Gruet and Sauriau, 1994; Sauriau and Gruet, 1988; Visset, 1987; Visset et al., 1990). A large array of boreholes has been retrieved in the marshes for geotechnical or hydrological studies, and pro-vide additional descriptions of the marsh sediments(Carbonel et al., 1998; Decker et al., 2001; Weber et al., 2004b).
At the millennial scale, sediment infilling of the incised valleys was dominantly coarse-grained (Chaumillon and Weber, 2006). Stratigraphy was primarily controlled by rapid sea-level rise dur-ing the early Holocene (ca. 9 mm yr−1;Lambeck, 1997; Stéphan and Goslin, 2014), which is similar to other sediment-starved incised val-leys of the French Atlantic coasts(Chaumillon et al., 2008, 2010). Coarse-grained sediment infilling of the Pertuis Charentais is capped by a silt drape (ca. 820 km2large, 1 to 1.5 m thick on average) that
lies unconformably on older sand deposits(Billeaud et al., 2005; Chaumillon et al., 2004)and formed since about the 18th century (Poirier et al., 2011). Fine-grained sediment supply and trapping increased as a result of deforestation on catchments (Poirier et al., 2011), coastal marsh reclamation (Allard et al., 2008) and oyster farming (Bertin and Chaumillon, 2006).
2.5. Sediment sources
Sources of fine-grained sediments in the Pertuis Charentais include (1) coastal rivers flowing directly into the area, the largest being the Charente river (Fig. 1B), (2) the Gironde estuary that is located 35 km southwards(Dabrin et al., 2014; Parra et al., 1998), (3) Mesozoic marls and limestones outcropping along the coast, and (4) coastal marsh clay minerals (Parra et al., 1998).
By contrast, sources of coarse-grained sediments are poorly known. Mineralogical composition of sandy sediments in the Pertuis Charentais is markedly different from that of nearby Cenomanian sandstones or remnant Pleistocene fluvial terraces (Barusseau, 1967). This indicates the importance of hydrodynamical sorting of particles since the beginning of the Holocene marine transgression, and also suggests that much of the coarse-grained sediments in the area are not derived from ancient continental outcrops. Volumes of coarse-grained sediment infilling the Pertuis Breton are larger than those infilling the Pertuis d’Antioche. Given that both incised valleys are subjected to similar tide and wave regimes, and are connected to similarly-sized rivers,Chaumillon and Weber (2006)have concluded that the northern Pertuis Breton acted as a trap for marine sedi-ments derived from the southward-oriented littoral drift. From these observations(Barusseau, 1967; Chaumillon and Weber, 2006), it
appears that coarse-grained particles in the study area are therefore predominantly of marine, not continental, origin.
3. Materials and methods
The study relies on a compilation of both existing and new14C
ages determined on marine mollusc shells retrieved from coarse-grained sediment bodies of the Pertuis Charentais. Three study areas were defined (Fig. 1B), including from north to south, (1) the inner Pertuis Breton and western Poitevin marsh, (2) the Rochefort marsh, and (3) the Marennes-Oléron bay and Brouage marsh, which make up a smaller system at the transition between the Charente and Seudre incised valleys (Allard et al., 2010).
3.1. 14C data compilation
3.1.1. Existing data
Existing14C ages were published in regional monographs(Gabet,
1981; Regrain, 1980), in radiocarbon laboratory reports (Delibrias et al., 1974, 1982)and in peer-reviewed articles(Allard et al., 2010; Chaumillon et al., 2004; Chaumillon and Weber, 2006; Poirier et al., 2011).
Works carried out during the 1970’s and 1980’s provided mostly qualitative information about the stratigraphical context in which
14C samples were retrieved, but descriptions were sufficiently
detailed to ensure the provenance of these samples.14C
measure-ments involved the scintillation method that yielded standard errors typically ranging between 90 and 100 years.
Works carried out since the 2000’s involved extensive geophysi-cal surveys of the Pertuis Charentais combined with abundant sedi-mentological and geochronological data, providing a precise control on the stratigraphic position of14C samples. Measurements involved
the AMS method that yielded standard errors not greater than 30 years.
3.1.2. New data
The 14C database was completed with new ages obtained on
four sedimentary cores retrieved in 2013 with a vibro-corer in the Arçay sand spit (study area 1;Fig. 2A). Cores were positioned along Ground Penetrating Radar (GPR) profiles. GPR survey of the spit (40 km of profiles) was carried out with a GSSI SIR-3000 acquisi-tion unit, equipped with a 400 MHz antenna and a GPS (Tessier et al., 2013). Post-acquisition processing included enhancement of
VK66 C05 PRI C08 CAS Poitevin marsh Pertuis Breton 2 km clay & silt
sand gravel pebble rock Dive St-Michel en L’Herm Arçay sand spit Longeville dune field Ré Island Grues Vignaud Dune T w o-w a y tr a v el time (ms) T w o-w a y tr a v el time (ms) Depth (m NGF) 0 Poz-6076 Poz-4780 VK62 VK66 0 60 30 0 20 10 40 N S VK62 1 km 50 40 30 20 10 1 km S N gas gas +3 +6 –3 N –11.0 –12.0 Depth (m NGF) –8.5 –9.5 Depth (m NGF)
D)
Arçay sand spitC)
Western Pertuis BretonB)
Eastern Pertuis BretonUB4 UB2 UB3 UB1 Mesozoic bedrock Mesozoic bedrock Ubid2 Ubid1 NW PRI 10 m Poz-65863Poz-65862 Poz-65861 C08 Uo Uo Us Up Uc Uc Poz-61003 SE CAS Mesozoic bedrock Poz-61004 C05 Poz-61002 Dsi07 Mi22 GPR –9.0 –11.5
A)
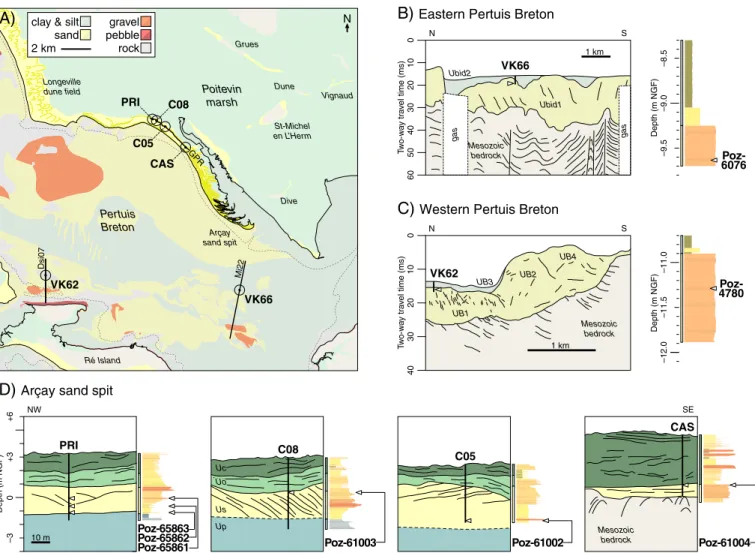
Fig. 2. A, Map of study area 1, Pertuis Breton and Poitevin Marsh. Labels in italics correspond to features cited in the text. Circle symbols indicate the location of sediment cores
in which14C samples listed inTable 1have been recovered. Cores have been positioned along geophysical profiles represented as thick black lines. B, Stratigraphy of the eastern
Pertuis Breton, illustrated by seismic profile Mi22 and sedimentary log of core VK66 (redrawn fromChaumillon and Weber, 2006). C, Stratigraphy of the western Pertuis Breton, illustrated by interpreted seismic profile Dsi07 and sedimentary log of core VK62 (redrawn fromChaumillon et al., 2004). D, Stratigraphy of the Arçay sand spit, illustrated by interpreted Ground Penetrating Radar profiles and sedimentary logs of cores PRI, C08, CO5 and CAS (this study). Along each sedimentary log,14C samples are positioned by white
Depth (m NGF) 0 –2 Gif-3938 Gif-3938 +2 –4 W E 1 m marsh marsh intertidal mudflat intertidal mudflat Mesozoic bedrock chenier-like ridge chenier-like ridge
B)
Rochefort marsh (Le Dauphin)1 km clay & silt
sand gravel pebble rock Gif-3857 Rochefort marsh Pertuis d’Antioche Les Fontaines Le Dauphin BSS001 RLCA N
A)
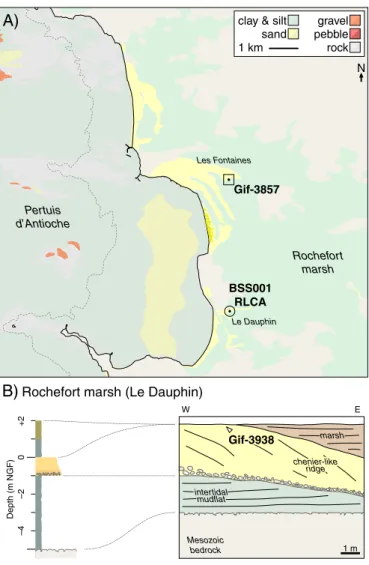
Fig. 3. A, Map of study area 2, Pertuis d’Antioche and Rochefort Marsh. Labels and
symbols as inFig. 2. Square symbol indicates the location of a14C sample for which a
detailed description of the stratigraphical context is not available. B, Stratigraphy of Le Dauphin chenier-like ridge, interpreted fromRegrain (1980)photograph description of a trench dug 450 m eastwards of sediment core BSS001RLCA. Dashed lines corre-late sediment facies recognised in the trench and the core.14C sample Gif-3938 is
positioned on the interpreted stratigraphic section with a labelled white arrow.
signal-to-noise ratio with a Karhunen-Loève filter (Zhao et al., 2005), time-to-depth conversion based on a variable velocity model (Allroggen et al., 2015), and topographic migration (Dujardin and Bano, 2013).
Sediment facies in the cores were visually described, and marine
mollusc shells were sampled for 14C age determination (AMS
method; Pozna ´n Radiocarbon Laboratory, Poland). In order to pre-vent dating of reworked material, only fully preserved remains, belonging to species ecologically compatible with the depositional environment were chosen. When applicable, thin-shelled infaunal bivalves were preferred, because they are indicative of a short post-mortem residence at the water-sediment interface, and are thus expected to record more accurately the true timing of sediment deposition (Poirier et al., 2010). These selection criteria were also followed for14C samples reported byAllard et al. (2010)andPoirier
et al. (2011), but it is unclear whether they were followed as well in the other works used to build the database.
3.2. 14C data processing
Processing of the 14C database (existing and new ages) was
performed with Bchron package implemented in statistical analysis
software R(Haslett and Parnell, 2008; Parnell et al., 2008). First,14C
ages were calibrated against Marine13 reference curve (Reimer et al., 2013). The regional reservoir offset value DR, which is here−28 ± 23, is the inverse-error weighted average of 4 measurements carried out on mollusc shells of the Pertuis Charentais (−36 ± 40, −34 ± 60, −32 ± 39, +7 ± 60;Tisnérat-Laborde et al., 2010) .
Function BchronDensity was then applied to the whole 14C
database, in order to combine the calibrated age distributions into a single, average age distribution. Instead of summing age prob-abilities, BchronDensity fits a mixture of a user-specified number G of normal distributions (here G = 64). The function relies on a stochastic algorithm (Markov Chain Monte Carlo) that produces slightly different results at each run. BchronDensity was therefore iterated 1000 times to improve reproducibility, and output was finally averaged.
4. Results
4.1. Origin of samples
Before describing the output of the BchronDensity function, this preliminary section provides a description of the geographical and stratigraphical context in which both existing and new14C
sam-ples have been retrieved from coarse-grained sediment bodies of the Pertuis Charentais. Although this section partly deals with pub-lished material, it is intended to serve as a guide to the descrip-tion of 14C results. Inland, these sediment bodies consist of thin,
bedrock-attached chenier-like ridges that mark the position of for-mer coastlines. They are depicted on fine-scale geological maps of the area (Bourgueil et al., 1976a,b, 1972;Hantzpergue, 1988; Platel et al., 1976; Verger et al., 1975). Local toponyms in the Poitevin Marsh (“Dune”) and elsewhere in the area (“La Sablière”, “La Gravelle”) are consistent with the presence of sand or gravel-rich subsurface deposits that contrast with dominant clayey silt sediment infilling of the marshes. Within the Pertuis Charentais, Holocene sediments are buried under the large silt drape deposited since the 18th century. Coarse-grained sediment bodies outcrop in hydrodynamically active areas, where the silt drape is absent (Figs. 2A,3A,4A).
4.1.1. Study area 1: Pertuis Breton and Poitevin marsh
The sediment infilling of the Pertuis Breton is predominantly composed of marine sands and gravels, derived from the southward-oriented littoral drift. Subtidal sand outcrops (Fig. 2A) correspond to the top of back-stepping progradational wedges deposited in the area in response to Holocene sea-level rise (Weber et al., 2004a). In the eastern Pertuis Breton (Fig. 2B),14C sample Poz-6076 was recovered
from core VK66 at a depth of−9.60 m NGF, in order to determine the age of the sand wedge Ubid1 (Chaumillon and Weber, 2006). In the western Pertuis Breton (Fig. 2C),14C sample Poz-4780 was
recovered from core VK62 at a depth of−11.30 m NGF, in order to determine the age of the sand wedge UB1 (Chaumillon et al., 2004). New14C samples were recovered from the Arçay sand spit, which
is composed of four stratigraphical units (Fig. 2D), described from base to top in the following. Unit Up has a transparent to low-amplitude horizontal radar facies correlated with blue-grey silty sands, interpreted as the spit platform (in the meaning ofAllard et al., 2008). Unit Us displays high-amplitude, high-angle reflectors dipping southeastwards, in the direction of spit progradation. Us is composed of orange medium sands intercalated with discrete, centimetre-thick coarse shelly sand layers. It is interpreted as the main spit unit. Above, units Uo and Uc have medium amplitude, sub-horizontal or channelised reflectors. Uo consists of homoge-neous fine sands containing abundant millimetre-thick laminations of dark heavy minerals, while such laminations disappear in Uc. Uo is interpreted as an exposed, upper beach environment, while Uc
corresponds to a closed back-barrier tidal lagoon that formed along the northwestern Arçay sand spit, in response to human interven-tions during the 1970’s (Poirier et al., 2017).14C sample Poz-61004
was recovered from core CAS at a depth of +0.92 m NGF, in order to determine the age of the spit platform unit Up. Five other14C
sam-ples were retrieved from spit unit Us, including Poz-65681, 65682 and 65683 in core PRI (−0.05, −0.65, −1.15 m NGF respectively), Poz-61002 in core C08 (+0.37 m NGF) and Poz-61002 in core C05 (−1.70 m NGF).
4.1.2. Study area 2: Rochefort marsh
Chenier-like ridges occurring at the seaward margin of the Rochefort marsh (Fig. 3A) were qualitatively described and sampled for14C age determination byRegrain (1980). Sample Gif-3857 was
taken in Les Fontaines at an approximate depth of 0 m NGF, and sample Gif-3938 was taken in Le Dauphin at an approximate depth of +1.8 m NGF.
Internal architecture of Le Dauphin marsh was illustrated in Regrain (1980) by a photograph of a trench dug in the marsh,
which shows a sand body lying between about−1 and +2 m NGF
above a former intertidal mudflat, and eventually topped by marsh sediments (Fig. 3B). The description is confirmed by the borehole BSS001RLCA (Anonymous, 1997), which was drilled 450 m westward of the trench. Grey sands and gravels (3–4 mm) with abundant shell debris were observed between 0 and−1 m NGF, hence confirming the probable presence of extensive chenier-like ridges in this area, as depicted on the local geological map (Bourgueil et al., 1972).
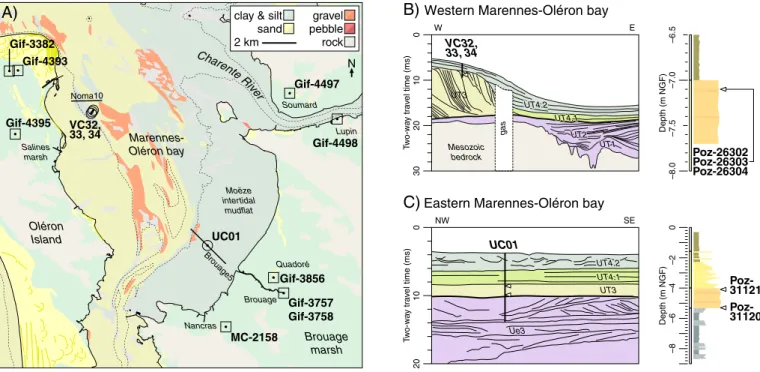
4.1.3. Study area 3: Marennes-Oléron bay and surrounding marshes
Similar subsurface coarse-grained deposits were identified and sampled for 14C age determination in the Charente estuary and
Brouage marsh (Fig. 4A) byRegrain (1980). They include the Soumard (Gif-4497, +3.6 m NGF) and Lupin (Gif-4498, +2.4 m NGF) chenier-like ridges along the Charente estuary, the Quadoré (Gif-3856, +2.8 m NGF) and Nancras (MC-2158, +0.9 m NGF) chenier-like ridges, and a deep subtidal sand body lying directly over the bedrock in Brouage (Gif-3757,−20 m NGF; Gif-3758, −23 m NGF). To the west, Gabet (1981)described a large set of chenier-like ridges in the Salines marsh (Oléron Island,Fig. 4A).14C ages listed in a radiocarbon
lab-oratory report (Delibrias et al., 1982) include Gif-3382 (+2 m NGF), Gif-4393 (+1.5 m NGF) and Gif-4395 (+2.5 m NGF).
The Holocene sediment infilling of the Marennes-Oléron bay has been extensively studied with very high resolution seismic profiles and14C-dated sedimentary cores. To the west (Fig. 4B), three short
sister cores penetrating into the top of a large progradational sand wedge recovered three14C ages (Poz-26302 in VC34, –7.1 m NGF;
Poz-26303 in VC35, –6.5 m NGF; Poz-26304 in VC33, –8.7 m NGF), used for age determination of seismic unit UT3(Allard et al., 2010; Billeaud et al., 2005). To the east (Fig. 4C), core UC01 provided a con-tinuous record of sedimentation from units UT3 to UT4.2 (Poirier et al., 2011). Samples Poz-31120 (−5.30 m NGF) and Poz-31121 (−4.15 m NGF) were recovered from sandy unit UT3 to confirm age determination of its western counterpart.
4.2. Definition of coarse-grained sedimentation pulses (CSPs)
The compiled database includes a total of twenty-four 14C
ages retrieved from coarse-grained sediment bodies of the Pertuis Charentais (Table 1). Two main age populations are recognised, rang-ing from 700± 90 (Gif-4395) to 1640 ± 30 uncal. yr B.P. (Poz-61004), and from 2650± 100 4497) to 2880 ± 100 uncal. yr B.P. (Gif-3382). Similar14C ages are found in much different geographical
and stratigraphical contexts. For instance, samples Gif-4395 and Poz-61002 were recovered from a chenier-like ridge in the Salines marsh (Fig. 4A) and from the Arçay sand spit unit Us (Fig. 2D) respectively,
but both yielded equivalent ages of 700± 90 and 730 ± 30 uncal. yr B.P.
The 24 calibrated 14C ages (Fig. 5A) were supplied to the
BchronDensity function. Averaged output is a complex, multimodal
age distribution (Fig. 5B) with 7 well-defined peaks of age probabil-ity centered on two distinct periods, from about 300 to 1400 cal. yr B.P. and from about 2300 to 2900 cal. yr B.P. We define each age peak as a coarse-grained sedimentation pulse (CSP), assuming that forma-tion of independent, disconnected coarse-grained deposits reflects a synchronous event occurring in the whole Pertuis Charentais area. The multimodal age distribution was decomposed into a subset of individual normal distributions in order to determine the age ranges of each CSP. Decomposition was carried out by a density estimation algorithm implemented in R package mclust (Fraley and Raferty, 2002). CSPs are labelled A to G, from the youngest to the oldest, and have ages of 445± 50, 649 ± 64, 797 ± 47, 968 ± 62, 1240 ± 53, 2422 ± 54 and 2646 ± 62 cal. yr B.P., respectively (Table 2).
4.3. Recognition of CSPs along European coasts
An additional dataset of 3914C and OSL ages obtained on
wave-influenced environments of western Europe was built (Table 3), in order to determine whether CSPs identified in the Pertuis Charentais reflect a local or regional signal. Dated deposits include spits, beaches (including unconsolidated sands and beachrocks) and ridges (including cheniers and plains) from the exposed coasts of Germany, United Kingdom, France, Spain and Portugal (Fig. 6A). When publica-tions already reported calibrated age ranges, they were recalculated to ensure a consistent processing of the dataset, using an up-to-date calibration curve (Marine13) and DR values determined from the on-line “Marine Reservoir Correction” database (Reimer and Reimer, 2006). The BchronDensity function was not applied to this dataset, which is more heterogeneous in terms of sample provenance.
For latitudes between 55◦ (Sylt, Germany) and 43◦ N (Punta Gallín, Spain), two main age populations are distinguished. The most recent one ranges from about 300 to 1300 cal. yr B.P., matching the 2s boundaries of CSPs A to E, and the oldest one ranges from about 2100 to 3100 cal. yr B.P., matching the 2s boundaries of CSPs F and G.
14C ages obtained on spits and beachrocks of the Cadix Gulf (southern
Spain and Portugal), around 37◦N, range from about 400 to 3000 cal. yr B.P. and do not match this overall dichotomy (Fig. 6B). Maximum probability age of some samples falls precisely within, or very close to, the CSP age ranges (Fig. 6B;Tables 2, 3). This is the case e.g. for
14C sample KIA-31638 from Sylt spit, Germany (562–261 cal. yr B.P.,
equivalent to CSP A ), for OSL samples of the Dungeness beach ridge plain, United Kingdom (1053–856 cal. yr B.P., equivalent to CSP D), or for14C sample CNA-1053 from Punta Gallín beach, Spain (907–675
cal. yr B.P., equivalent to CSP C).
Other samples, such as CNA-1052 (643–468 cal. yr B.P.) from Punta Gallín beach, fall in between two CSPs (here A and B), or have large calibration ranges which make the connection with a CSP more questionable (e.g. UQ-2058 in Cordon de Richard chenier, France; 3091–2465 cal. yr B.P., possibly equivalent to CSP G). The lowest agreement is found for14C ages of the Cadix Gulf, for which only
5 samples out of 19 can be associated with CSPs. Poor agreement also exists for14C ages obtained on beachrocks (Gif-1100 in Plage
de la Torche, France; IRPA-20056 and Beta-185788 in Armação de Pêra, Portugal), which are out of the CSPs 2s age ranges (Fig. 6B).
5. Discussion
The basic assumption of this study is that CSPs in the Pertuis Charentais reflect a regional shift towards more energetic marine conditions. While the contribution of relative sea-level changes to the occurrence of CSPs cannot be excluded, it is probably minor in the context of the steady, slow sea-level rise recorded along
gas T w o-w a y tr a v el time (ms) Poz-26302 Poz-26303 Poz-26304 0 30 20 10 E W
B)
Western Marennes-Oléron bayT w o-w a y tr a v el time (ms) 0 20 10 SE NW UT3 UT4.1 UT4.1 UT4.2 UT4.2 UT4.1 UT4.1 UT3 UT4.2 UT4.2 Mesozoic bedrock Ue3 UT1 UT1 UT2 UT2 VC32, 33, 34 UC01 –6.5 –7.5 Depth (m NGF) –7.0 –8.0 –2 Depth (m NGF) 0 –4 –6 –8 Poz-31120 Poz-31121 2 km clay & silt
sand gravel pebble rock Gif-4497 Gif-4498 Gif-3856 Gif-3757 Gif-3758 MC-2158 Gif-4395 Gif-4393 Gif-3382 Brouage marsh Marennes-Oléron bay Quadoré Brouage Nancras Soumard Lupin Moëze intertidal mudflat Salines marsh UC01 VC32, 33, 34 Oléron Island N Noma10 Brouage 5
A)
C)
Eastern Marennes-Oléron bayFig. 4. A, Map of study area 3, Marennes-Oléron bay and surrounding marshes. Labels and symbols as inFigs. 2 and 3. B, Stratigraphy of the western Marennes-Oléron bay, illustrated by seismic profile Noma10 and sedimentary log of core VC34 (redrawn fromAllard et al., 2010 and Poirier et al., 2011). C, Stratigraphy of the eastern Marennes-Oléron bay, illustrated by seismic profile Brouage5 and sedimentary log of core UC01 (redrawn fromPoirier et al., 2011).
French Atlantic coasts during the late Holocene (Lambeck, 1997; Stéphan and Goslin, 2014). In this section, the external climate drivers involved in the occurrence of CSPs are discussed, by com-paring CSP age ranges with time series of the North Atlantic Ocean climate since 3500 cal. yr B.P. (Fig. 7).
5.1. Impact of storminess
A key finding of this study is that CSPs do not coincide with the two last phases of increased North Atlantic storminess previously identified in various studies from about 2000 to 1200 cal. yr B.P. and from about 600 to 150 cal. yr B.P. (Fig. 5B; HSAP, “high storm activity
period” inSabatier et al., 2012; HSP, “Holocene Storm Period” in Sor-rel et al., 2012; van Vliet-Lanoë et al., 2014; SP, “storm periods” in Degeai et al., 2015; Costas et al., 2016and references therein).
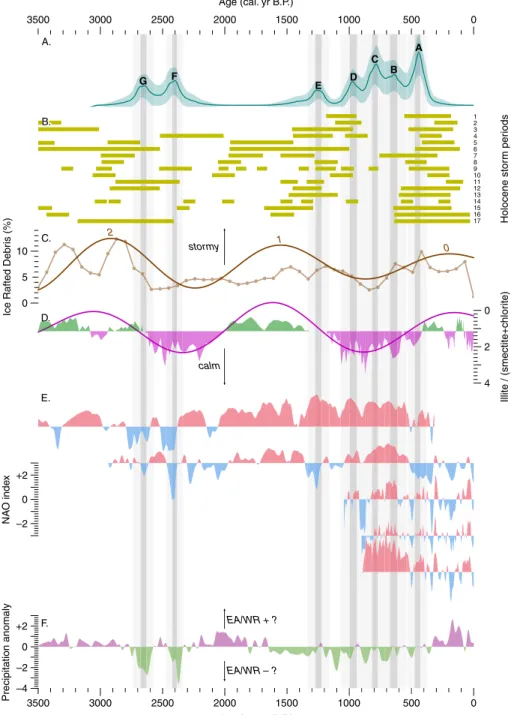
Inversely, CSPs coincide with decreasing or minima values in the 1450-yr wavelet reconstruction of the IRD time series (Fig. 7C; Bond et al., 2001), i.e. during periods of decreased North Atlantic storminess (Sorrel et al., 2012). The same observation applies for a clay mineralogy record of lagoonal sediments in the northwestern Mediterranean Sea (Sabatier et al., 2012), for which CSPs coincide with above-average (
>
1.2) values in the smectite/(illite + chlorite) ratio, interpreted by the authors as a proxy of reduced storm activ-ity (Fig. 7D). Wavelet reconstruction of this clay mineralogy timeTable 1
14C database (Pertuis Charentais).
Lab reference 14C age (uncal. yr B.P.) Study area Toponym Publication reference Type 2s range (cal. yr B.P.) 1s range (cal. yr B.P.)
Gif-4395 700± 90 3 Arceau Delibrias et al., 1982 Chenier-like 518–185 452–289
Poz-61002 730± 30 1 Pointe d’Arçay This study Spit 472–307 453–358
Poz-65861 750± 30 1 Pointe d’Arçay This study Spit 487–319 473–386
Poz-65862 755± 30 1 Pointe d’Arçay This study Spit 490–324 477–394
Poz-65863 850± 30 1 Pointe d’Arçay This study Spit 548–440 521–473
MC-2158 900± 70 3 Le Grand Nancras Regrain, 1980 Chenier-like 650–430 601–487
Poz-61003 975± 30 1 Pointe d’Arçay This study Spit 646–523 621–551
Poz-31121 1065± 30 3 Moëze tidal flat Poirier et al., 2011 Subtidal (marine) 721–590 681–627 Gif-3856 1150± 90 3 Quadoré Regrain, 1980 Chenier-like 910–590 819–647 Poz-26302 1165± 30 3 Rade des Trousses Allard et al., 2010 Subtidal (marine) 821–660 765–687 Gif-3938 1230± 100 2 Le Dauphin Regrain, 1980 Chenier-like 1012–630 900–708 Poz-26304 1235± 30 3 Rade des Trousses Allard et al., 2010 Subtidal (marine) 899–721 865–762 Poz-26303 1245± 30 3 Rade des Trousses Allard et al., 2010 Subtidal (marine) 904–729 875–776 Gif-3857 1280± 90 2 Les Fontaines Regrain, 1980 Chenier-like 1039–672 934–748 Gif-4498 1390± 90 3 Lupin Regrain, 1980 Chenier-like 1174–763 1081–872 Poz-31120 1420± 30 3 Moëze tidal flat Poirier et al., 2011 Subtidal (marine) 1085–912 1037–949 Poz-61004 1640± 30 1 Pointe d’Arçay This study Spit 1295–1155 1269–1200 Gif-3758 1790± 100 3 Brouage marsh Delibrias et al., 1982 Subtidal (marsh) 1594–1172 1480–1275 Gif-4497 2650± 100 3 Soumard Regrain, 1980 Chenier-like 2682–2137 2567–2267 Poz-4780 2695± 30 1 Pertuis Breton Chaumillon et al., 2004 Subtidal (marine) 2575–2324 2469–2349 Gif-4393 2710± 100 3 La Moulinade Delibrias et al., 1982 Chenier-like 2723–2241 2608–2335 Gif-3757 2770± 100 3 Brouage marsh Delibrias et al., 1982 Subtidal (marsh) 2751–2301 2682–2420 Poz-6076 2815± 30 1 Pertuis Breton Chaumillon and Weber, 2006 Subtidal (marine) 2714–2480 2692–2561 Gif-3382 2880± 100 3 La Moulinade Delibrias et al., 1982 Chenier-like 2878–2359 2776–2512
1000 2000 3000 2500 1500 500 0 3500 Age (cal. yr B.P.) MC−2158 Poz−31121 Gif−3856 Poz−26302 Poz−26304 Gif−4498 Poz−31120 Gif−3758 Gif−4497 Gif−4393 Gif−3757 Gif−3382 Gif−4395 Gif−3857 Gif−3938 Poz−65862 Poz−61002 Poz−65861 Poz−65863 Poz−61003 Poz−61004 Poz−4780 Poz−6076 Poz−26303 1000 2000 3000 2500 1500 500 0 3500 Age (cal. yr B.P.) A. A B C D E F G B.
Fig. 5. Definition of the coarse-grained sedimentation pulses (CSPs) described in the text. A, Calibrated14C ages of the Pertuis Charentais coarse-grained sediment bodies listed in Table 1. B, Output of the BchronDensity function. Thick green line corresponds to the mean age distribution after 1000 BchronDensity iterations. Light green shading corresponds to the 2s enveloppe.
series for the 1450-yr cycle is in phase with that obtained for the IRD time series (Fig. 7C). The occurrence of CSPs is therefore likely conditioned by a decrease in the frequency and/or intensity of North Atlantic storms. Such conditions are believed to allow the deposi-tion and long-term preservadeposi-tion of coarse-grained sediments in the Pertuis Charentais. It is likely that coastal barriers in the study area repeatedly switched between phases of destruction during HSPs (ca. 3500 to 2700, 2000 to 1200, and 600 to 150 cal. yr B.P.) and resilience between HSPs (2700 to 2000 and 1200 to 600 cal. yr B.P.)
5.2. Impact of wave climate
According to the present-day wave climate studies described above(Martínez-Asensio et al., 2016; Poirier et al., 2017), wave-induced sediment transport in the study area increases with positive NAO and negative EA/WR conditions. Several reconstructions of low-to high-frequency changes in the NAO index are available for the late Holocene to historical periods, with differences in temporal coverage and resolution (Fig. 7E;Baker et al., 2015; Olsen et al., 2012; Ortega et al., 2015; Proctor et al., 2000; Trouet et al., 2009). The EA/WR atmospheric circulation pattern has received less attention, with a focus mostly on its impact on temperature and precipitation in western Europe and in the Mediterranean region (Ionita, 2014; Krichak and Alpert, 2005; Lim, 2015, and references therein). To our knowledge, no reconstruction of the late Holocene EA/WR variabil-ity exists yet. Given that a positive correlation between EA/WR and
Table 2
Chronological boundaries of coarse-grained sedimentation pulses (CSPs). CSP 2s range 1s range Normal distribution
(cal. yr B.P.) (cal. yr B.P.) (cal. yr B.P.)
A 526–362 466–420 445± 50 B 753–543 676–616 649± 64 C 874–719 817–773 797± 47 D 1070–866 995–937 968± 62 E 1328–1152 1263–1213 1240± 53 F 2510–2333 2445–2395 2422± 54 G 2748–2544 2673–2615 2646± 62
precipitation rates is observed across Asia (Barnston and Livezey, 1987), with negative EA/WR conditions inducing a drier climate, we use a record of late Holocene summer (JJAS) precipitation from lake Ngamring Tso, southern Tibet (Conroy et al., 2017) as an indirect proxy of the long-term EA/WR variability (Fig. 7F).
CSPs A to E (i.e. 450 to 1250 cal. yr B.P.) coincide with domi-nantly positive NAO conditions prevailing from about 500 to 1900 cal. yr B.P. (Fig. 7E;Baker et al., 2015; Olsen et al., 2012), and with dominantly negative EA/WR conditions from about 400 to 1700 cal. yr B.P. (Fig. 7F;Conroy et al., 2017). Although the 1s age ranges of CSPs A to E coincide with minor, slightly positive EA/WR peaks occurring within the overall negative trend (Fig. 7F), they also closely match positive NAO peaks(Ortega et al., 2015; Trouet et al., 2009), or periods of decreasing NAO after these peaks (Olsen et al., 2012), depending on the reconstructions (Fig. 7B). It is therefore very likely that CSPs A to E reflect periods of increased deposition of coarse-grained sediments in the Pertuis Charentais, induced by a more energetic wave climate. This interpretation partly applies for CSPs F and G (2400 and 2650 cal. yr B.P.), as they closely match the likely most negative EA/WR peaks reached since the last 3500 years, but also moderately to strongly negative NAO peaks (Fig. 7E,7F). Such cli-mate conditions have no present-day analogue, and it is therefore difficult to determine to which extent they contributed to a more energetic wave climate as for CSPs A to E.
5.3. Climate control on CSPs along European coasts
Additional14C and OSL ages obtained on wave-influenced
envi-ronments of western Europe (Fig. 6; Table 3)provide some clues about the broader geographical and hydrodynamical context in which CSPs have been recorded. Most14C and OSL ages from
north-ern Europe (above 43◦ N) could be related to CSPs identified in the Pertuis Charentais database with fair (e.g. UQ-2058) to excel-lent agreement (e.g. SacA-23973;Table 1). Conversely, agreement is poor or non-existent for14C ages from southern Spain and
Portu-gal (around 37◦ N). Spit growth in this area may not only depend on wave climate variability, but also indirectly on progradation of
C. Poirier et al. / Palaeogeography, Palaeoclimatology, Palaeoecology 485 (2017) 784–797 Table 3 14C database (Europe).
Reference Lab code Age (uncal. yr B.P.) Method Location Latitude Depositional environment 2s range (cal. yr B.P.) CSP
Lindhorst et al., 2010 KIA-31638 775± 25 14C Sylt, Germanya 54◦54,7’ N Spit 562–261 A
Lindhorst et al., 2010 KIA-31639 1350± 30 14C Sylt, Germany 54◦54,7’ N Spit 1121–725 D
Roberts and Plater, 2007 severalb 1005± 50 OSL Dungeness, United Kingdom 50◦55,9’ N Ridge (plain) 1053–856 D
van Vliet-Lanoë et al., 2014 SacA-23972 565± 30 14C Plage de la Torche, Francec 47◦50,3’ N Beachrock 297–178 None
Giot, 1998 Gif-891 1100± 90 14C Plage de la Torche, France 47◦50,3’ N Beach (unconsolidated) 876–548 B
van Vliet-Lanoë et al., 2014 SacA-23973 1390± 30 14C Plage de la Torche, France 47◦50,3’ N Beach (unconsolidated) 1037–920 D
van Vliet-Lanoë et al., 2014 Poz-36728 1435± 30 14C Plage de la Torche, France 47◦50,3’ N Beach (unconsolidated) 1088–948 D
van Vliet-Lanoë et al., 2014 Poz-37202 1460± 30 14C Plage de la Torche, France 47◦50,3’ N Beach (unconsolidated) 1129–972 D
van Vliet-Lanoë et al., 2014 Poz-36729 1600± 30 14C Plage de la Torche, France 47◦50,3’ N Beach (unconsolidated) 1262–1159 E
van Vliet-Lanoë et al., 2014 Poz-34212 1605± 30 14C Plage de la Torche, France 47◦50,3’ N Beachrock 1264–1164 E
van Vliet-Lanoë et al., 2014 Poz-31327 1620± 30 14C Plage de la Torche, France 47◦50,3’ N Beach (unconsolidated) 1271–1174 E
Giot, 1981 Gif-1100 2670± 110 14C Plage de la Torche, France 47◦50,3’ N Beachrock 2701–2163 F and/or G
Pontee et al., 1998 n.a.d 1421± 162 14C Cordon de Richard, Francee 45◦29,3’ N Ridge (chenier) 1292–686 D
Clavé, 2001 UQ-1983 1600± 135 14C Cordon de Richard, France 45◦29,3’ N Ridge (chenier) 1460–915 E
Pontee et al., 1998 n.a. 2575± 120 14C Cordon de Richard, France 45◦29,3’ N Ridge (chenier) 2647–2005 F?
Clavé, 2001 Beta-102696 2590± 70 14C Cordon de Richard, France 45◦29,3’ N Ridge (chenier) 2493–2117 F?
Clavé, 2001 Beta-102695 2850± 90 14C Cordon de Richard, France 45◦29,3’ N Ridge (chenier) 2819–2377 G
Clavé, 2001 UQ-2058 2975± 120 14C Cordon de Richard, France 45◦29,3’ N Ridge (chenier) 3091–2465 G?
Feal-Pérez et al., 2014 CNA-1052 1048± 35 14C Punta Gallín, Spainf 43◦33,4’ N Beach (unconsolidated) 643–468 None
Feal-Pérez et al., 2014 CNA-1053 1347± 36 14C Punta Gallín, Spain 43◦33,4’ N Beach (unconsolidated) 907–675 C
Zazo et al., 1994 R-2207 1440± 50 14C El Rompido, Spaing 37◦13,0’ N Spit 933–549 None
Zazo et al., 1994 R-2179 1460± 50 14C El Rompido, Spain 37◦13,0’ N Spit 953–560 None
Zazo et al., 1994 R-2180 1875± 50 14C El Rompido, Spain 37◦13,0’ N Spit 1369–941 E?
Zazo et al., 1994 R-2203 2605± 50 14C El Rompido, Spain 37◦13,0’ N Spit 2270–1732 None
Moura et al., 2007 IRPA-20056 710± 20 14C Armação de Pêra, Portugal 37◦05,9’ N Beachrock 280–0 None
Moura et al., 2007 Beta-185788 2280± 40 14C Armação de Pêra, Portugal 37◦05,9’ N Beachrock 1840–1351 None
Zazo et al., 1994 R-2204 1490± 50 14C Doñana, Spain 36◦49,7’ N Spit 986–594 C
Zazo et al., 1994 R-2187 1790± 50 14C Doñana, Spain 36◦49,7’ N Spit 1296–882 D
Zazo et al., 1994 R-2188 1850± 50 14C Doñana, Spain 36◦49,7’ N Spit 1340–924 None
Zazo et al., 1994 R-2185 1860± 50 14C Doñana, Spain 36◦49,7’ N Spit 1350–929 E?
Zazo et al., 1994 R-2210 2010± 50 14C Doñana, Spain 36◦49,7’ N Spit 1535–1078 E
Zazo et al., 1994 R-2205 2185± 50 14C Doñana, Spain 36◦49,7’ N Spit 1729–1273 None
Rodríguez-Polo et al., 2009 AERO 1190± 80 14C Valdelagrana, Spain 36◦32,2’ N Spit 695–328 None
Rodríguez-Polo et al., 2009 ESCA 1250± 70 14C Valdelagrana, Spain 36◦32,2’ N Spit 773–417 None
Rodríguez-Polo et al., 2009 TORVC-4 1590± 60 14C Valdelagrana, Spain 36◦32,2’ N Spit 1109–671 None
Zazo et al., 1994 R-2186 2120± 50 14C Valdelagrana, Spain 36◦32,2’ N Spit 1674–1226 None
Zazo et al., 1994 R-2181 2270± 50 14C Valdelagrana, Spain 36◦32,2’ N Spit 1826–1340 None
Zazo et al., 1994 R-2182 2320± 50 14C Valdelagrana, Spain 36◦32,2’ N Spit 1882–1386 None
Zazo et al., 1994 R-2208 3145± 50 14C Valdelagrana, Spain 36◦32,2’ N Spit 2864–2345 G
a DR = –23± 92; average of values Nos. 73, 74 and 75 (see on-line “Marine Reservoir Correction” database for details;Reimer and Reimer, 2006).
b Average of samples 73BH-7/1; 73BH-9/1,2,3; 73BH-10/1,2,3. OSL ages were reported in years before 2000 CE and were therefore offset by 50 years for comparison with14C expressed in cal. yr B.P.
c DR = –40± 23; value No. 1075.
d n.a., not applicable.
e DR = –34± 60; value No. 1574.
f DR = +101± 65; average of values Nos. 132, 1553 and 1554.
spit beach (unconsolidated) beachrock ridge (chenier) ridge (plain) 1000 2000 3000 2500 1500 500 0 3500 Age (cal. yr B.P.) 55° N 45° N 40° N 15° W France Spain U.K. 200 km Cordon de Richard Valdelagrana Dungeness 10° W 5° W 0° 5° E 10° E 50° N Longitude Latitude 55° N 45° N 40° N 50° N Latitude Sylt Dungeness Sylt Cordon de Richard Plage de la Torche Plage de la Torche Punta Gallín Punta Gallín Armação de Pêra Doñana El Rompido Valdelagrana Doñana El Rompido Armação de Pêra
A)
A B C D E F GB)
Fig. 6. Recognition of CSPs in wave-influenced depositional environments of the exposed coasts of western Europe. A, Map of Europe showing the location of the studied
environments. B, Calibrated age distributions of the14C ages listed inTable 3. Ages are ordered vertically by latitude. Background light and dark grey shading correspond to the
CSP 2s and 1s age ranges, respectively (Table 3).
adjacent deltas (e.g. Guadiana and Guadalquivir) driven by human activities and changes in precipitation regimes (Lario et al., 1995).
Local effects may indeed play a role in the Cadix Gulf, as well as in other areas considered here, but the overall difference between northern and southern Europe (Fig. 6) is more likely explained by spatial variability in wave climate across the North Atlantic Ocean. Spatially-explicit correlations between the NAO index and wave height show a marked north-south dipole pattern. Transi-tion area of zero correlaTransi-tion occurs at the northwestern corner of Spain, around 43◦N (Fig. 6A;Martínez-Asensio et al., 2016). South-wards of this limit, for instance in the Cadix Gulf, wave height decreases with positive NAO conditions. The combined influence of low-frequency storminess and high-frequency NAO variability, which likely drives the occurrence of CSPs in the Pertuis Charentais and elsewhere in northern Europe, is therefore not valid for this area. This opposite north/south pattern does not exist for the EA/WR index (Martínez-Asensio et al., 2016).
5.4. Uncertainties and perspectives
The present study raised a number of questions that would merit further consideration. As shown above, the EA/WR atmospheric cir-culation pattern seems to be an important driver of the occurrence of CSPs. We used (Conroy et al., 2017) lake record of summer (JJAS) precipitation rates over southern Tibet as an indirect proxy of the long-term EA/WR variability, but the influence of EA/WR on wave climate of the Pertuis Charentais predominates in winter (DJF;Poirier et al., 2017). With a sampling resolution of 25 years, it could be expected that this lake record provides a smoothed, long term-averaged reconstruction of the EA/WR circulation pattern. Fur-ther work is however needed to determine to which extent it can be reliably used as a proxy of the winter EA/WR during the late Holocene. Sediment records, speleothems or tree ring data recovered
from the EA/WR poles of action, in western Europe and central Asia (Barnston and Livezey, 1987), might be useful to check this hypothesis.
Reservoir age of the water masses on the northern Icelandic shelf (65◦N) varied by± 150 years since about 1300 cal. yr B.P., depend-ing on the strength of the North Atlantic Current (NAC;Wanamaker Jr et al., 2012). Feedbacks between the NAC and the NAO atmo-spheric circulation pattern have also influenced DR along French Atlantic coasts between 1885 and 1950 CE by 90 to 170 years (Tis-nérat-Laborde et al., 2010). In the present study, such changes in the DR parameter were not considered for calibrating the14C ages
(Table 2), which could have an impact on the chronological bound-aries of CSPs. The overall good agreement between CSPs and late Holocene climate changes in the North Atlantic Ocean suggests that this impact is probably minor, but additional data would help to raise this uncertainty.
Definition of CSPs F and G in the Pertuis Charentais mainly relied on14C dates with a large dating error (scintillation method;Table 1).
New data may help to evaluate more precisely the chronological boundaries of CSPs that could have occurred during the penultimate period of decreased storminess, from about 2000 to 2700 cal. yr B.P. (Fig. 5).
Additional geochronological studies should also be carried out along the coasts of western Europe, in order to better constrain the spatial and temporal extent of the CSPs evidenced in the Pertuis Charentais. Dating of beachrocks should be avoided, as carbonate cementation involved in their formation has complex, multifacto-rial causes controlled by water temperature, pH, salinity, dissolved ions, organic matter and bacteria, to name but a few (Vousdoukas et al., 2007). This could explain the overall low agreement between CSP age ranges and14C dates obtained on beachrocks in Plage de
la Torche (France) and Armação de Pêra (Portugal, 37◦N), the latter being moreover located in the negative NAO-wave height correlation area.
1000 2000 3000 2500 1500 500 0 3500 Age (cal. yr B.P.) 1000 2000 3000 2500 1500 500 0 3500 1 2 3 4 5 6 7 8 9 10 11 12 13 14 15 16 17 Holocene stor m per iods 0 5 10
Ice Rafted Debr
is (%) Age (cal. yr B.P.) 0 2 4 Illite / (smectite+chlor ite) A B C D E F G calm stormy 0 +2 –2 NA O inde x 0 +2 –2 Precipitation anomaly –4 EA/WR + ? EA/WR – ? 2 1 0 A. B. B. C. D. E. F.
Fig. 7. Coarse-grained sedimentation pulses with respect to late Holocene climate change in the North Atlantic Ocean since 3500 cal. yr B.P. A, Mean age distribution of integrated 14C data, as inFig. 5B. B, Periods of increased Holocene storminess (1–17, redrawn fromCostas et al., 2016, see references therein). C, Ice-rafted debris stack record with
1450-year wavelet reconstruction (Bond et al., 2001). Numbers in italics indicate the corresponding Bond cycles. D, Clay mineralogy record of NW Mediterranean lagoonal sediments with 1450-year wavelet reconstruction (Sabatier et al., 2012). Note the inverted y-scale, with large values corresponding to decreased storminess. E, Reconstructions of the North Atlantic Oscillation index, including from top to bottom,Olsen et al., 2012; Baker et al., 2015; Proctor et al., 2000; Ortega et al., 2015; Trouet et al., 2009. F, Precipitation anomalies over the Tibetan Plateau (Conroy et al., 2017), used as an indirect proxy of the East Atlantic/West Russia index. All time series are scaled and smoothed with a robust cubic spline. Background light and dark grey shading correspond to the CSP 2s and 1s age ranges, respectively (Table 3).
6. Conclusions
Compilation of existing14C data performed on coarse-grained
sediment bodies of the Pertuis Charentais helped to better understand the temporal trends in high-energy marine sedimen-tation along coasts of the northeastern Atlantic Ocean, between the so-called Holocene Storm Periods. CSPs are defined as peri-ods of increased accumulation of coarse-grained sediment particles identified in the study area, and possibly in other wave-exposed
environments of western Europe, above 43◦ N. In first order, the occurrence of CSPs is likely controlled by the 1450-yr cycle of North Atlantic storminess. Decreased frequency and/or intensity of erosive storm events is interpreted to allow the deposition and long-term preservation of coarse-grained sediment deposits. In second order, the occurrence of CSPs is likely controlled by changes in the North Atlantic wave climate, driven by low-frequency variability in the NAO and EA/WR atmospheric circulation patterns. Combination of positive NAO and negative EA/WR conditions is known to induce