HAL Id: hal-00295923
https://hal.archives-ouvertes.fr/hal-00295923
Submitted on 22 May 2006
HAL is a multi-disciplinary open access
archive for the deposit and dissemination of
sci-entific research documents, whether they are
pub-lished or not. The documents may come from
teaching and research institutions in France or
abroad, or from public or private research centers.
L’archive ouverte pluridisciplinaire HAL, est
destinée au dépôt et à la diffusion de documents
scientifiques de niveau recherche, publiés ou non,
émanant des établissements d’enseignement et de
recherche français ou étrangers, des laboratoires
publics ou privés.
Effect of smoke and clouds on the transmissivity of
photosynthetically active radiation inside the canopy
M. A. Yamasoe, C. von Randow, A. O. Manzi, J. S. Schafer, T. F. Eck, B. N.
Holben
To cite this version:
M. A. Yamasoe, C. von Randow, A. O. Manzi, J. S. Schafer, T. F. Eck, et al.. Effect of smoke and
clouds on the transmissivity of photosynthetically active radiation inside the canopy. Atmospheric
Chemistry and Physics, European Geosciences Union, 2006, 6 (6), pp.1645-1656. �hal-00295923�
www.atmos-chem-phys.net/6/1645/2006/ © Author(s) 2006. This work is licensed under a Creative Commons License.
Chemistry
and Physics
Effect of smoke and clouds on the transmissivity of
photosynthetically active radiation inside the canopy
M. A. Yamasoe1, C. von Randow2, A. O. Manzi3, J. S. Schafer4,5, T. F. Eck5,6, and B. N. Holben51Instituto de Astronomia, Geof´ısica e Ciˆencias Atmosf´ericas da Universidade de S˜ao Paulo, Rua do Mat˜ao, 1226, S˜ao Paulo,
SP, 05508-090, Brazil
2Alterra, Wageningen University and Research Centre, P.O. Box 47, 6700 AA, Wageningen, The Netherlands
3Instituto Nacional de Pesquisas da Amazˆonia, Av. Andr´e Ara´ujo, 2936 – Alojamento 9/Casa 21, Manaus, AM, 69060-001,
Brazil
4Science Systems and Applications, Inc., 10210 Greenbelt Road, Suite 600, Lanham, MD 20706, USA 5NASA Goddard Space Flight Center, Greenbelt, MD, 20771, Biospheric Sciences Branch, Code 614.4, USA
6Goddard Earth Sciences and Technology Center, University of Maryland-Baltimore County, Baltimore, MD 21228, USA
Received: 6 July 2005 – Published in Atmos. Chem. Phys. Discuss.: 12 August 2005 Revised: 6 March 2006 – Accepted: 20 March 2006 – Published: 22 May 2006
Abstract. Biomass burning activities emit high
concentra-tions of aerosol particles to the atmosphere. Such particles can interact with solar radiation, decreasing the amount of light reaching the surface and increasing the fraction of dif-fuse radiation through scattering processes, and thus has im-plications for photosynthesis within plant canopies. This work reports results from photosynthetically active radia-tion (PAR) and aerosol optical depth (AOD) measurements conducted simultaneously at Reserva Biol´ogica do Jaru (Rondonia State, Brazil) during LBA/SMOCC (Large-Scale Biosphere-Atmosphere Experiment in Amazonia/ Smoke, Aerosols, Clouds, Rainfall, and Climate) and RaCCI (Radia-tion, Cloud, and Climate Interactions in the Amazon during the Dry-to-Wet Transition Season) field experiments from 15 September to 15 November 2002. AOD values were re-trieved from an AERONET (Aerosol Robotic Network) ra-diometer, MODIS (Moderate Resolution Spectroradiometer) and a portable sunphotometer from the United States Depart-ment of Agriculture – Forest Service. Significant reduction of PAR irradiance at the top of the canopy was observed due to the smoke aerosol particles layer. This radiation reduction affected turbulent fluxes of sensible and latent heats. The in-crease of AOD also enhanced the transmission of PAR inside the canopy. As a consequence, the availability of diffuse radi-ation was enhanced due to light scattering by the aerosol par-ticles. A complex relationship was identified between light availability inside the canopy and net ecosystem exchange (NEE). The results showed that the increase of aerosol op-tical depth corresponded to an increase of CO2 uptake by
the vegetation. However, for even higher AOD values, the Correspondence to: M. Yamasoe
(akemi@model.iag.usp.br)
corresponding NEE was lower than for intermediate values. As expected, water vapor pressure deficit (VPD), retrieved at 28 m height inside the canopy, can also affect photosynthesis. A decrease in NEE was observed as VPD increased. Further studies are needed to better understand these findings, which were reported for the first time for the Amazon region under smoky conditions.
1 Introduction
Aerosol particles are well known to affect the climate system by interacting with solar radiation through direct and indirect processes. The direct process involves absorption and scat-tering of solar radiation. While scatscat-tering affects climate by reflecting part of the available radiation back to space and thus cooling the surface, absorption of solar radiation can cool the surface and heat the atmosphere. Both effects of cooling the surface and heating the atmosphere can stabilize the atmosphere by changing its thermodynamic profile. If less energy is available at surface level, turbulent fluxes are inhibited with less evaporation of water from vegetation and water bodies, resulting in a drier lower atmosphere. If the atmosphere is more stable and drier, fewer clouds can be formed, termed a semi-direct aerosol effect (Hansen et al., 1997; Koren et al., 2004). The indirect process is coupled to the cloud condensation nuclei property of aerosol parti-cles, whose excess can change cloud properties and lifetime in the atmosphere (Twomey, 1977; Kaufman and Nakajima, 1993; Kaufman and Fraser, 1997; Andreae et al., 2004). Re-cently another consequence of the aerosol direct effect on solar radiation has been brought under investigation, namely,
1646 M. Yamasoe et al.: Effect of smoke and clouds on transmission of PAR the effect on vegetation carbon gain due to a reduction in
to-tal photosynthetically active radiation (PAR, 400 to 700 nm) reaching the Earth’s surface and the increase of the diffuse fraction of PAR (Chameides et al., 1999; Cohan et al., 2002; Gu et al., 2002; Gu et al., 2003). The first studies consid-ering diffuse radiation due to cloud cover on photosynthetic activities date from the 1980’s. Young and Smith (1983) re-ported an increase in carbon uptake and a reduction in tran-spiration on cloudy days compared to clear days for Arnica latifolia Bong, an understory species common throughout the Rocky Mountains. The increase in carbon uptake was related to the increase of diffuse light in the presence of clouds. Spit-ters et al. (1986) proposed a more realistic partitioning be-tween diffuse and direct solar radiation based on daily total radiation reaching the surface from measurements. Spitters (1986) incorporated that relationship on a model for daily canopy assimilation of CO2and obtained a better agreement
between model calculation and measurement of CO2
assim-ilation rates for sugar beet crop.
Particles with diameters of 0.1 to 1.0 µm scatter light most efficiently in the wavelengths used for photosynthesis. Dur-ing the dry season in the Amazon region, large amounts of such particles are emitted from biomass burning activ-ities to the atmosphere (Andreae et al., 1991; Kaufman et al., 1998; Yamasoe et al., 2000). Measurements performed in the region showed significant reduction of downward so-lar total and photosynthetically active irradiance at the sur-face (Schafer et al., 2002; Procopio et al., 2004; Eck et al., 1998). On the other hand, diffuse fraction of PAR can in-crease from 19% with a clear atmosphere up to 80% under heavy smoke conditions (Yamasoe et al., 20061). The pur-pose of the present work is to assess the effect of the smoke layer on the transmission of PAR inside the canopy in a trop-ical rainforest in the Amazon region and investigate the pos-sible consequences of this effect to the vegetation.
2 Experimental setup and methodology
The measurements were performed as part of LBA/SMOCC (Large-Scale Biosphere-Atmosphere Experiment in Amazo-nia/Smoke, Aerosols, Clouds, Rainfall, and Climate) and RaCCI (Radiation, Cloud, and Climate Interactions in the Amazon during the Dry-to-Wet Transition Season) field ex-periments at a 60-m high micrometeorological tower located at Reserva Biol´ogica do Jaru, hereafter called Rebio Jaru (10◦04.70S, 61◦56.00W). The tower is surrounded by trop-ical rainforest vegetation with mean canopy height of 30– 35 m, with some trees as high as 45m. Although the tower is located in a governmental protected area, landless people
1Yamasoe, M. A., Plana-Fattori, A., Corrˆea, M. P., Garcia, M.
P., Dubuisson, P., Holben, B. N., Schafer, J., Eck, T., and Artaxo, P.: Measurement of global and direct-normal incidence PAR irradiance under smoky conditions in the Amazon Basin, Atmos. Chem. Phys. Discuss, to be submitted, 2006.
have recently developed small-scale slash and burn activities in the area (Andreae et al., 2002). In fact, during the first weeks of the field experiment, conducted from 15 Septem-ber to 15 NovemSeptem-ber 2002, it was possible to see fires and smoke nearby from the top of the tower. Additional informa-tion about the site can be obtained from Andreae et al. (2002) and Von Randow et al. (2002).
PAR irradiance measurements were carried out at seven different heights above surface: from the top of the canopy at 39 m, 30, 25, 19, 15, 10 and 5 m. Energy sensors SKE 510 from Skye Instruments were used. The sensors were mounted at the faces to the north, east and west of the tower on 4 m-long-aluminum poles. Six other sensors measured upwelling PAR irradiances at 39 and 30 m at the same three faces. Four other sensors were setup at about 1 m from the surface, also measuring downward PAR irradiance. Mea-surements were performed every minute.
Aerosol optical depth (AOD) was retrieved from a Cimel radiometer from AERONET (Aerosol Robotic Network) (Holben et al., 1998) mounted at a second tower located about 800 m from the main tower. AOD was also retrieved from a portable sunphotometer (hazemeter), from USDA-FS (United States Department of Agriculture – Forest Ser-vice) which was operated at the site, as part of a regional network spread over states of Rondonia and Acre. Direct solar attenuation measurements were performed from 9:00 to 17:00 LT every 30 minutes. Hao et al. (2005) give ad-ditional information on the hazemeters (description, opera-tion and calibraopera-tion). Finally retrievals from MODIS (Mod-erate Resolution Spectroradiometer) (Kaufman et al., 1997; Remer et al., 2005) aboard Terra (about 10:30 h LT over-pass) and Aqua (about 13:30 h LT overover-pass) satellites were also used in this study, since the AERONET radiometer was not available at the end of the sampling period due to strumental problems. For the period while AERONET in-strument was operating simultaneously with the hazeme-ter and MODIS, aerosol optical depth retrieved from the hazemeter measurements and from MODIS was quality as-sured with AERONET data, considered our reference instru-ment. Results from the hazemeter and MODIS were cor-rected, since hazemeter tended to overestimate AOD as com-pared to AERONET and since MODIS AOD was retrieved at wavelength 0.55 µm while both AERONET and the hazeme-ter values used in this manuscript are for 0.50 µm. The correction was based on linear regressions between hourly mean AOD from AERONET versus AOD from hazemeter or MODIS.
Latent heat, sensible heat and CO2 fluxes were
deter-mined from fast response wind velocity, temperature, hu-midity and CO2concentration measurements performed with
a 3-D sonic anemometer (Solent 1012R2, Gill Instruments, UK) and an infrared gas analyzer (LI-6262, LICOR, USA) installed at 62.7 m height. The fluxes were estimated using the eddy covariance method. The fluctuations of the vari-ables were calculated by subtracting 60 min block average
values from the instantaneous measurements. Also, two ro-tations were applied to align the coordinate frame with the mean streamlines and to force the mean vertical component to zero. A detailed description of the eddy covariance sys-tem and flux calculations is provided by Von Randow et al. (2004). An estimate of net ecosystem exchange (NEE) of CO2was performed as the sum of the fluxes measured at
the top of the tower and the change in storage of CO2in the
layer below. To quantify this change in storage, an empiri-cal model was proposed by Von Randow et al. (2004) and is based on the amount of turbulence observed during the pre-ceding night.
AERONET retrievals of size distribution and complex re-fractive index (according to an inversion model developed by Dubovik and King, 2000) were also used to develop an aerosol optical model within the PAR spectral range. Refrac-tive index was linearly interpolated in the PAR region in bin size intervals of 0.025 µm and input in a Mie code devel-oped by Wiscombe (1980) together with size distribution to calculate single scattering albedo (ω0), asymmetry factor (g)
and extinction efficiency (Qext). The optical model was used
as input in the radiative transfer code SBDART (Santa Bar-bara DISORT Atmospheric Radiative Transfer) (Ricchiazzi et al., 1998) to simulate downward global PAR irradiance at the top of the canopy. Calculations were performed at one minute time steps although hourly mean AOD values were used as input for the runs.
The simulated PAR irradiance was used to separate data affected only by smoke from those affected by clouds. Since the calculations were performed considering only the effect of smoke, with no clouds, hourly mean irradiance from nu-merical simulations would agree with measurements only for non cloud-contaminated cases. Hourly mean values and stan-dard deviations of the mean were calculated for measured ( ¯∈m,σm)and simulated ( ¯∈c, σc)data. In order to filter cloudy data, firstly mean values from measurements with large stan-dard deviations were discarded (σm/ ¯∈m>0.25) as well as data for which the ratio between mean values of PAR from mea-surements and from calculations was lower than 0.70. The choice of those thresholds was based on sensitivity studies according to the variability of aerosol optical depth on a time scale of one hour. Those numbers were obtained consider-ing the worse scenario, for which AOD presented the high-est variability. Numerical simulations of PAR at one minute time step were performed with hourly-mean AOD plus or mi-nus one standard deviation for the worse scenario and com-parisons between these calculations were performed. Mean ( ¯∈c)and standard deviation (σc)for the irradiances calcu-lated with the highest (∈ch)and lowest (∈cl) AOD values were determined. Ratios ∈cl/∈chwere always larger than 0.70 and the ratio σc/ ¯∈c was lower than 0.25. For the remaining data base, a linear fit based on the least squares method was performed. Theoretically, if the correct aerosol optical depth is used in the numerical simulations, measured and calcu-lated PAR should result in a linear fit with slope equal one
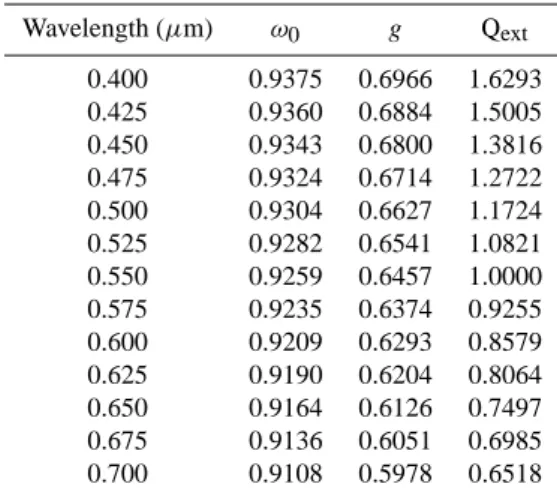
Table 1. Smoke aerosol optical model in the PAR spectral region
developed according to AERONET retrievals of size distribution and refractive index and a Mie code.
Wavelength (µm) ω0 g Qext 0.400 0.9375 0.6966 1.6293 0.425 0.9360 0.6884 1.5005 0.450 0.9343 0.6800 1.3816 0.475 0.9324 0.6714 1.2722 0.500 0.9304 0.6627 1.1724 0.525 0.9282 0.6541 1.0821 0.550 0.9259 0.6457 1.0000 0.575 0.9235 0.6374 0.9255 0.600 0.9209 0.6293 0.8579 0.625 0.9190 0.6204 0.8064 0.650 0.9164 0.6126 0.7497 0.675 0.9136 0.6051 0.6985 0.700 0.9108 0.5978 0.6518
and intercept zero. If data is normally distributed around the best fit, all data should not be far from the linear fit for more than three standard deviations. Thus, this criterion was also used to eliminate possibly cloud-contaminated data.
An index to quantify cloudy or smoky conditions relative to clear sky atmosphere was defined. This index is similar to the “relative irradiance” proposed by Gu et al. (1999) and to the Schafer et al. (2002):
fB=
¯
∈m
∈0
where ¯∈mis the hourly-mean measured PAR irradiance and ∈0is the equivalent clear sky value. The clear sky value was determined numerically considering aerosol optical depth equal 0.05 at 550 nm.
3 Results and discussion
Table 1 presents the calculated parameters of the optical model for biomass burning aerosol particles. The extinction efficiency at the table is normalized at 0.55 µm. The results are similar to Procopio et al. (2003) values. The authors ana-lyzed data from two AERONET radiometers located 700 km apart in the southern Amazon Basin, Alta Floresta (09◦550S, 56◦000W) and Abracos Hill (10◦450S, 62◦210W). Proco-pio et al. (2003) reported mean values of asymmetry factor (g) of 0.67±0.01 and 0.56±0.02, respectively at 0.44 and 0.67 µm, while in the present study, the calculated values for g are 0.680 and 0.605 at 0.45 µm and 0.675 µm, respectively, as shown in Table 1. Extinction efficiency from this work presents a slightly lower spectral dependence when com-pared to Procopio and co-authors results. Figure 1 shows a comparison of single scattering albedo from Mie calculations from this work and mean values retrieved from AERONET.
1648 M. Yamasoe et al.: Effect of smoke and clouds on transmission of PAR
0.70
0.75
0.80
0.85
0.90
0.95
1.00
0.3
0.5
0.7
0.9
1.1
wavelength (µm)
s
in
g
le
s
c
a
tt
e
ri
n
g
a
lb
e
d
o
interpolated AERONET Procopio et al. 2003Fig. 1. Single scattering albedo in the PAR spectral range
interpo-lated according to Mie theory (open diamonds). Solid black dots correspond to mean values from AERONET retrievals at 0.44, 0.67, 0.87 and 1.02 µm and standard deviation (an indication of data vari-ability). Mean values from Procopio et al. (2003) are also shown for comparison (crosses).
Vertical bars indicate the variability of AERONET results. Mean values from the 12 optical models proposed by Proco-pio et al. (2003) are also shown. Chand et al. (2005) retrieved single scattering albedo of about 0.92±0.02 (at 545 nm) from in situ measurements of linear scattering and absorption coef-ficients performed at Fazenda Nossa Senhora Aparecida dur-ing SMOCC (same location of Abracos Hill AERONET site) field campaign, for submicron particles (with diameter lower than 1.5 µm) and dry ambient conditions (relative humidity of about 40%).
As discussed previously both hazemeter and MODIS re-sults were corrected according to AERONET rere-sults, in order to extend the time series for the entire field campaign, since the radiometer from AERONET was not available all the time. The correction was based on linear fittings. Figure 2 shows the comparison of AOD retrievals from the distinct platforms. The parameters of the linear fits are also presented in the figure and were used to correct the data. Although it is possible to observe a good agreement between them, MODIS retrievals were in general lower than AERONET, while the opposite was observed for the hazemeter data.
Hourly mean values of aerosol optical depth at 500 nm are presented in Fig. 3. Mean values higher than 3.0 were observed at the beginning of the sampling period, indicat-ing a very polluted atmosphere. Gradually AOD decreased at the site mostly due to rainfall, reaching mean values of 0.35 to 0.40 by the end of the experiment. Three-hourly rain rate estimates from TRMM (Tropical Rainfall Mea-suring Mission, further information: http://trmm.gsfc.nasa.
gov/trmm rain/Events/TRMMSeniorProp 1.pdf) at a 0.25◦
by 0.25◦ around the site for September and October 2002 are presented at Fig. 3b. Rainfall on 28 September was
re-sponsible for the sharply drop of AOD at the site, as well as the increase in soil water storage integrated from surface up to 3.4 m depth (not shown), which increased from about 600 mm (before 28 September 2002) to 690 mm (measured on 3 October 2002) reaching about 985 mm by the end of the field campaign. In the case of vapor pressure deficit, whose measurements at 28 m height are presented at Fig. 3c, it is possible to observe a tendency of decreasing of maxima val-ues.
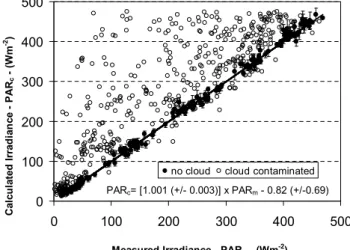
The smoke layer affected PAR irradiance measured at the top of the canopy. Depending on the time of the day, a de-crease of more than 50% could be observed. Figure 4 shows hourly-mean measured PAR irradiance as function of the rel-ative irradiance. Solid symbols indicate smoky conditions only and open symbols include all cases. Separation between hazy and cloud-contaminated data was performed through a linear fitting based on the least squares method, as described previously. Figure 5 shows the result of the fitting. The solid symbols indicate cloud-free cases. After this screen-ing, 66% of data is one standard deviation far from the fit and 96% two standard deviations far. The resulting reduced chi-square (χred2 )is 1.08. The number of degrees of freedom is 178 (after cloud screening), thus, there is a 90% proba-bility that the resultant reduced chi-square should be in the interval 0.83<χred2 <1.18.
When analyzing the effect of smoke on the transmission of PAR through the canopy, an increase of daily mean trans-mittance was observed with the increase of AOD, as shown in Fig. 6a. The estimation of transmittance was obtained by normalizing daily mean downward irradiance measured at one particular level for the one measured at the top of the canopy (at 39 m). Since aerosol particles in the atmo-sphere increase the availability of diffuse radiation, the result presented in Fig. 6 indicates a more efficient penetration of PAR inside the canopy in the presence of the smoke layer. In Fig. 6b, the transmittance is plotted as function of leaf area index (LAI), whose values were estimated from Rummel et al. (2002) (their Fig. 1a) determined at the same site during the dry season of 1999, since no measurement was conducted in 2002. According to Jones (1992), it is possible to estimate an empirical extinction coefficient by adjusting an exponen-tial curve of transmission versus leaf area index. For mean AOD value of 0.26, an extinction coefficient of 0.55, while for AOD equal 2.53, a value of 0.43 was obtained following this approach as shown in Fig. 6b.
As mentioned previously, PAR irradiance at the top of the canopy was attenuated due to the presence of the smoke layer. As expected, if less radiation reaches the surface, there is less energy available and consequently a decrease in tur-bulent fluxes. In the analysis of Fig. 7 it is possible to ob-serve that both sensible and latent heat fluxes are affected by variations in PAR irradiance reaching the top of the canopy, in a quite linear relationship, independently if reduction of PAR was due to aerosol (solid symbols) or cloudy condi-tions. The high variability could be due to variations in air
y = 1.08x + 0.13 R2 = 0.90 (Terra) y = 1.06x + 0.10 R2 = 0.80 (Aqua) 0.0 0.5 1.0 1.5 2.0 2.5 3.0 0.0 1.0 2.0 3.0 AOD (550nm) MODIS A O D ( 5 0 0 n m ) A E R O N E T Terra Aqua y = 0.75x + 0.16 R2 = 0.95 0 1 2 3 4 0 1 2 3 4 AOD (500nm) Hazemeter A O D ( 5 0 0 n m ) A E R O N E T
(a)
(b)
Fig. 2. Comparison of AOD retrievals from AERONET versus (a) MODIS onboard Terra and Aqua satellites and (b) a portable
sunphotome-ter (hazemesunphotome-ter). AERONET data collected 30 min before and 30 min afsunphotome-ter the overpasses were averaged in the comparison with MODIS retrievals. Both AERONET and hazemeter data were averaged in one hour intervals for the second comparison.
0.0 0.5 1.0 1.5 2.0 2.5 3.0 3.5 4.0 A O D ( 5 0 0 n m ) a 0 2 4 6 8 10 12 14 P re c ip it a ti o n r a te ( m m /h ) b 0 500 1000 1500 2000 2500 3000 3500 4000 01/09/2002 11/09/2002 21/09/2002 01/10/2002 11/10/2002 21/10/2002 31/10/2002 10/11/2002 Date V . p re s . d e fi c it @ 2 8 m (P a ) c (a) 0.0 0.5 1.0 1.5 2.0 2.5 3.0 3.5 4.0 A O D ( 5 0 0 n m ) a 0 2 4 6 8 10 12 14 P re c ip it a ti o n r a te ( m m /h ) b 0 500 1000 1500 2000 2500 3000 3500 4000 01/09/2002 11/09/2002 21/09/2002 01/10/2002 11/10/2002 21/10/2002 31/10/2002 10/11/2002 Date V . p re s . d e fi c it @ 2 8 m (P a ) c (b) 0.0 0.5 1.0 1.5 2.0 2.5 3.0 3.5 4.0 A O D ( 5 0 0 n m ) a 0 2 4 6 8 10 12 14 P re c ip it a ti o n r a te ( m m /h ) b 0 500 1000 1500 2000 2500 3000 3500 4000 01/09/2002 11/09/2002 21/09/2002 01/10/2002 11/10/2002 21/10/2002 31/10/2002 10/11/2002 Date V . p re s . d e fi c it @ 2 8 m (P a ) c (c)
Fig. 3. Time series of: (a) Hourly-mean aerosol optical depth (AOD) at 500 nm retrieved from AERONET, portable sunphotometer and
MODIS. The arrow at the bottom of the graph shows the beginning of the intensive field experiment, when vertical profile measurements
inside the canopy were carried out; (b) Three-hourly rain rate estimated from TRMM at a 0.25◦by 0.25◦around the site location; (c) day
1650 M. Yamasoe et al.: Effect of smoke and clouds on transmission of PAR 0 50 100 150 200 250 300 350 400 450 500 0.0 0.2 0.4 0.6 0.8 1.0 fB P A R I rr a d ia n c e ( W m -2) 16h - 17h 15h - 18h 14h - 19h 13h - 20h 12h - 21h
Fig. 4. Hourly-mean measured total PAR irradiance at the top of the
canopy as function of the relative irradiance. Solid circles represent cloud-free data, while open diamonds correspond to all data. The hour (UTC) indicated at the right represent the final time considered in the hourly mean, for instance, 12:00 h–20:00 h represents all data measured between 11:01 h up to 12:00 h and from 19:01 to 20:00 h UTC.
temperature, rain events and local circulations as discussed by Von Randow et al. (2002). For CO2 flux, on the other
hand, the relationship with incident PAR is not linear. From Fig. 8 it is possible to observe that NEE leveling off occurs at about 250 to 300 Wm−2. It is also possible to observe that morning values are higher (more negative, indicating more CO2uptake by vegetation) and present higher
variabil-ity than afternoon fluxes. Third degree polynomial fittings to the data are presented in the figure, stressing the non-linear relationship. Afternoon variability can be related to changes in water vapor pressure deficit (VPD). As Fig. 9 shows, VPD increases with PAR in the morning but presents higher val-ues in the afternoon, without correlation with incident PAR. For morning measurements, a second order polynomial fit-ting could be adjusted to the data, with R2of 0.70, as shown in Fig. 9. Hourly mean values of VPD were retrieved from air temperature and relative humidity measured at 28 m height inside the canopy. A tendency of decreasing NEE for in-creasing VPD was observed for afternoon measurements for similar values of incident PAR (not shown), explaining the less negative results. Since VPD tends to present lower val-ues in the morning than in the afternoon (Fig. 9), this could also explain the higher variability of NEE in the morning, meaning that high VPD inhibits photosynthetic activity. The effect of soil moisture on turbulent and CO2fluxes, if any, is
small, since no systematic difference was observed from the beginning to the end of the field experiment when soil water storage changed from about 600 mm before 27 September to 985 mm in November.
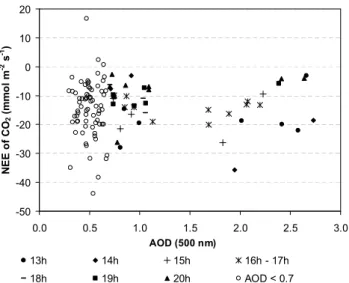
Distinct NEE response was observed for varying aerosol loadings. For low AOD (<0.7) no correlation between NEE
0 100 200 300 400 500 0 100 200 300 400 500
Measured Irradiance - PARm - (Wm -2 ) C a lc u la te d I rr a d ia n c e P A Rc ( W m -2)
no cloud cloud contaminated PARc= [1.001 (+/- 0.003)] x PARm - 0.82 (+/-0.69)
Fig. 5. Linear fitting based on the least squares method between
hourly mean calculated and measured PAR irradiance. Open sym-bols represent all analyzed data and solid symsym-bols indicate situa-tions when cloud effect was negligible. The coefficients of the fit-ting and their standard deviations are also presented.
and aerosol loading was observed (Fig. 10). Above that
threshold, NEE presented a tendency of becoming more neg-ative, up to a saturation point at about AOD 1.5 to 2.0, al-though no data is available for AOD in the range 1.2 to 1.7. For even higher AOD values, NEE started to decrease
again. A possible explanation for the observed behavior
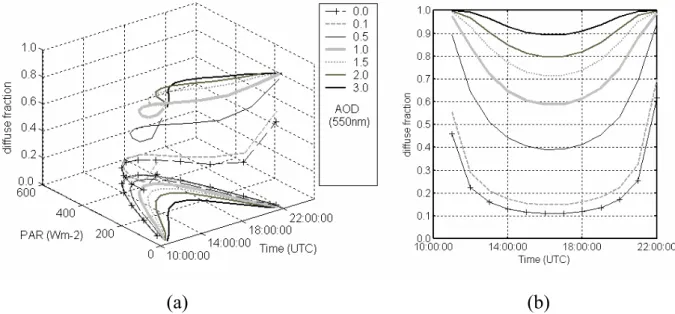
is that, although the diffuse fraction of PAR increases with AOD, the attenuation caused by the aerosol layer reduces the total amount of radiation available for photosynthesis. Figure 11 shows diurnal cycles of total incident PAR irradi-ance and of its diffuse fraction for distinct AOD, determined numerically with SBDART. For AOD equal 1.5, more than 70% of the PAR is diffuse, but only 360 Wm−2 or less is available for photosynthesis. In a similar study, Niyogi et al. (2004) observed an increase of CO2flux for AOD varying
from 0.1 to 0.8. For a broadleaf deciduous forest in Walker Branch, TN, US, they observed an increase from −15 up to about −24 µmol m−2s−1for that AOD range. According to their results, C4 vegetation presented the largest sensitivity, C3 crops/grasslands less and trees from the deciduous forest moderate sensitivity for aerosol on CO2flux. Actually,
grass-land sites presented an opposite response with a decreasing CO2flux as aerosol loading increased. They hypothesized
this difference to the distinct canopy architecture. Aerosol loading at their studied sites was not as high as observed in the Amazon region during the burning season, thus it was not possible to verify if CO2 flux would also decrease at their
sites for higher AOD values. Some possible explanations for the changes in NEE observed in this study for distinct aerosol loadings are discussed: 1) for intermediate values of AOD, the increase of the diffuse fraction of PAR enhances photosynthetic activities up to a level where the amount of
0 5 10 15 20 25 30 35 40 0.0 0.2 0.4 0.6 0.8 1.0 Mean transmittance H e ig h t (m ) 0.26 0.35 0.49 0.71 0.99 2.15 2.53 AOD (500 nm) I/Io(0.26) = e-0.55x R2 = 0.92 I/Io(2.53) = e-0.43x R2 = 0.91 0.0 0.1 0.2 0.3 0.4 0.5 0.6 0.7 0.8 0.9 1.0 0.0 1.0 2.0 3.0 4.0 5.0 6.0 7.0 LAI M e a n T ra n s m it ta n c e 0.26 0.35 0.49 0.71 0.99 2.15 2.53 AOD (500 nm)
(a)
(b)
Fig. 6. Mean transmittance of photosynthetically active radiation inside the canopy at Rebio Jaru for distinct aerosol optical depths at 500 nm.
y = 0.48x - 26.32 R2 = 0.67 -150 -100 -50 0 50 100 150 200 250 300 350 0 100 200 300 400 500 PAR (Wm-2) H ( W m -2 ) y = 1.06x - 2.06 R2 = 0.76 -100 0 100 200 300 400 500 600 700 800 0 100 200 300 400 500 PAR (Wm-2) L E ( W m -2)
(a)
(b)
Fig. 7. Hourly-mean values of sensible (H) and latent heat (LE) fluxes as function of PAR irradiance. Open symbols include all data and
solid symbols refer to cloudless cases (aerosol only).
-50 -40 -30 -20 -10 0 10 20 30 40 50 0 100 200 300 400 500 PAR (Wm-2) N E E o f C O 2 ( µµµµ m o l m -2 s -1 ) morning afternoon morning aerosol only afternoon aerosol only
Fig. 8. Hourly-mean NEE of CO2flux as function of PAR
irradi-ance incident at the top of the canopy for morning (squares) and afternoon (circles) measurements. Open symbols include all data and solid symbols represent cloudless data. Solid lines represent third degree polynomial fittings to the data.
R2 = 0.70 0 500 1000 1500 2000 2500 3000 3500 4000 0 100 200 300 400 500 PAR (Wm-2) V P D @ 2 8 m ( P a ) morning afternoon
Fig. 9. Hourly-mean water vapor pressure deficit at 28 m height
(inside the canopy) as function of PAR. The line represents a second order polynomial fitting to morning data.
1652 M. Yamasoe et al.: Effect of smoke and clouds on transmission of PAR -50 -40 -30 -20 -10 0 10 20 0.0 0.5 1.0 1.5 2.0 2.5 3.0 AOD (500 nm) N E E o f C O2 ( m m o l m -2 s -1) 13h 14h 15h 16h - 17h 18h 19h 20h AOD < 0.7
Fig. 10. Effect of changes of aerosol optical depth on hourly-mean
values of NEE of CO2.
global radiation is too low due to this same smoke layer, in-hibiting photosynthesis; 2) for higher AOD, the concentra-tion of aerosol particles or gases such as ozone in the atmo-sphere is so high that photosynthesis decreases due to the toxic effect of any chemical compounds in the atmosphere. As reported by Andreae et al. (2002), ozone concentration at Rebio Jaru during the dry season of 1999 reached val-ues higher than 40 ppb. This threshold defines ozone crit-ical level, according to the Protocol to Abate Acidification, Eutrophication and Ground-level Ozone (http://www.unece. org/env/lrtap/full\%20text/1999\%20Multi.e.pdf). Ozone is a secondary product from vegetation fires.
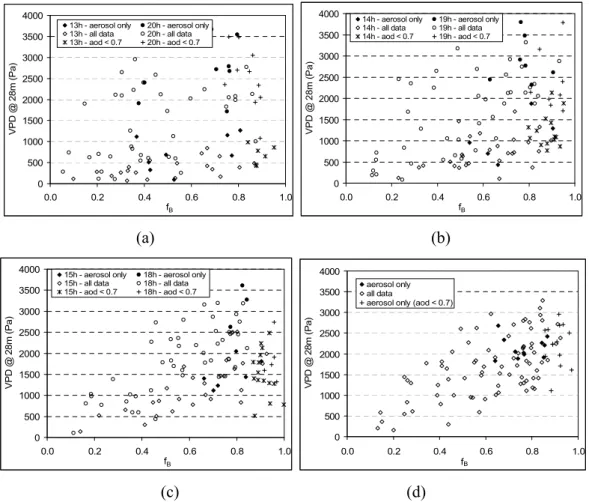
From Figs. 11 and 12 it seems that hypothesis 1 is very plausible. Figure 11 shows that the aerosol layer increases the availability of diffuse radiation as well as reduces the to-tal amount of PAR reaching the top of the canopy. From Fig. 12 it is possible to observe that NEE is more negative at about fB around 0.6 to 0.8 independent on the time of the day, although NEE values are slightly lower (less nega-tive) if the reduction of incident PAR is only due to smoke (solid symbols), particularly when sun is high on the sky (Fig. 11d). As discussed previously, morning VPD values are lower than afternoon and reduction in NEE could be re-lated to increase of VPD. However, comparing graphics from Fig. 13 with those from Fig. 12, analyzing cases with no cloud effect (solid symbols) there are cases for which sim-ilar values of fB are observed, VPD is not high but there is a reduction of NEE, especially for high AOD. This could be an indication of hypothesis 2. Obviously AOD is not ap-propriate to address this local effect, since it represents an atmospheric column integrated quantity and in situ measure-ments should be performed in order to study this effect. All these speculative discussions reinforce that further investi-gations in those directions must still be conducted to get a
better understanding of the observed behavior. The aerosols from biomass burning cover large areas including much of the Amazon as well as distant regions via long-range trans-port and thus could affect the carbon budget on a regional scale, over areas covered by forest, grass, cerrado (a Brazil-ian savanna type vegetation) and crops like soybean, cotton and sugarcane. Since the effect of aerosol on CO2flux
de-pends on the vegetation structure, as reported by Niyogi et al. (2004), the overall effect on the carbon budget is rather non-linear and must still be addressed.
4 Conclusions
The present work showed that high concentrations of aerosol particles in the atmosphere due to biomass burning decrease the amount of global photosynthetically radiation at varying canopy levels, affecting sensible and latent heat fluxes at the surface. On the other hand, the smoke layer increases the diffuse fraction of PAR, enhancing transmission of radiation inside the canopy. This seems to enhance photosynthetic ac-tivity observed as a more negative CO2flux, thus indicating a
higher CO2uptake by the surrounding vegetation. However,
for even higher AOD values (>2.0), CO2 flux and
conse-quently NEE decreased. This could be due to the less avail-ability of PAR or a consequence of the deleterious effects of some chemical compounds in the aerosol particles or gases such as ozone, a secondary product from biomass burning which could be formed from emissions from the surround-ing fires. Cloud effect on CO2exchange is also difficult to
quantify, since cloudiness can vary significantly during the course of a day introducing other complexities in the system. Higher values of water vapor pressure deficit at 28 m height were observed in the afternoon and were related to higher air temperature and lower relative humidity when compared to morning measurements. Those higher values also affected NEE of CO2, resulting in less negative values in the
after-noon indicating a reduction on photosynthetic activity. During the dry season, large areas are affected by aerosol particles from biomass burning activities due to long-range transport. Thus, the observed effect of the smoke layer on carbon flux and NEE, discussed in this manuscript for the first time for the Amazon region, can have significant impli-cations on the carbon budget of ecosystems. Laboratory stud-ies using photosynthesis chambers, other field campaigns and additional modeling efforts are planned to improve our understanding of the effect of aerosol particles from biomass burning on the carbon budget.
Acknowledgements. This work was carried out within the frame
work of the Smoke, Aerosols, Clouds, Rainfall, and Climate (SMOCC) project, a European contribution to the Large-Scale Biosphere-Atmosphere Experiment in Amazonia (LBA). It was financially supported by the Environmental and Climate Program of the European Commission (contract No. EVK2-CT-2001-00110 SMOCC), the Max Planck Society (MPG), the Fundac¸˜ao de
(a)
(b)
Fig. 11. Numerically calculated diurnal cycle of (a) the diffuse fraction and of total incident PAR irradiance for distinct aerosol optical depth
and (b) diffuse fraction only.
-50 -40 -30 -20 -10 0 10 20 30 0.0 0.2 0.4 0.6 0.8 1.0 fB N E E o f C O 2 (µ m o l m -2s -1)
13h - aerosol only 20h - aerosol only 13h - all data 20h - all data 13h - aod < 0.7 20h - aod < 0.7 -50 -40 -30 -20 -10 0 10 20 30 0.0 0.2 0.4 0.6 0.8 1.0 fB N E E o f C O2 (µ m o l m -2s -1)
14h - aerosol only 19h - aerosol only 14h - all data 19h - all data 14h - aod < 0.7 19h - aod < 0.7 (a) (b) -50 -40 -30 -20 -10 0 10 0.0 0.2 0.4 0.6 0.8 1.0 fB N E E o f C O2 (µ m o l m -2s -1)
15h - aerosol only 18h - aerosol only 15h - all data 18h - all data
15h - aod < 0.7 18h - aod < 0.7 -50 -40 -30 -20 -10 0 10 0.0 0.2 0.4 0.6 0.8 1.0 fB N E E o f C O2 (µ m o l m -2s -1) aerosol only all data
aerosol only (aod < 0.7)
(c) (d)
Fig. 12. NEE of CO2as function of fB(relative irradiance) when solar zenith angle is (a) between 48◦and 53◦, (b) between 34◦and 39◦,
1654 M. Yamasoe et al.: Effect of smoke and clouds on transmission of PAR 0 500 1000 1500 2000 2500 3000 3500 4000 0.0 0.2 0.4 0.6 0.8 1.0 fB V P D @ 2 8 m ( P a ))
13h - aerosol only 20h - aerosol only 13h - all data 20h - all data 13h - aod < 0.7 20h - aod < 0.7 0 500 1000 1500 2000 2500 3000 3500 4000 0.0 0.2 0.4 0.6 0.8 1.0 fB V P D @ 2 8 m ( P a ))
14h - aerosol only 19h - aerosol only 14h - all data 19h - all data 14h - aod < 0.7 19h - aod < 0.7
(a)
(b)
0 500 1000 1500 2000 2500 3000 3500 4000 0.0 0.2 0.4 0.6 0.8 1.0 fB V P D @ 2 8 m ( P a ))15h - aerosol only 18h - aerosol only 15h - all data 18h - all data 15h - aod < 0.7 18h - aod < 0.7 0 500 1000 1500 2000 2500 3000 3500 4000 0.0 0.2 0.4 0.6 0.8 1.0 fB V P D @ 2 8 m ( P a )) aerosol only all data
aerosol only (aod < 0.7)
(c)
(d)
Fig. 13. Hourly-mean water vapor pressure deficit at 28 m height inside the canopy as function of the relative PAR irradiance reaching the
top of the canopy when solar zenith angle is (a) between 48◦and 53◦, (b) between 34◦and 39◦, (c) between 18◦and 25◦and (d) smaller
than 13◦.
Amparo `a Pesquisa do Estado de S˜ao Paulo, grants 2001/08574-9 and 2001/06908-7 and the Conselho Nacional de Desenvolvimento Cient´ıfico e Tecnol´ogico, grants 301151/01-6, 306085/2003-8
and Instituto do Milˆenio LBA, grant 62.0056/01-0. We thank
Instituto Brasileiro do Meio Ambiente e dos Recursos Naturais Renov´aveis (IBAMA) and all members of the LBA-SMOCC and LBA-RACCI Science Teams for their support during the field campaign, especially A. C. Ribeiro, M. A. L. Moura, J. von Jouanne and staff from AERONET. M. Yamasoe acknowledges J. C. Thomaz Jr., J. Mello, J. Martins and staff from Laborat´orio de Instrumentac¸˜ao Meteorol´ogica/Centro de Previs˜ao do Tempo e Estudos Clim´aticos (LIM/CPTEC) for support during the field campaign, WeiMin Hao for providing hazemeter data, A. A. de Souza for hazemeter operation, K. C. Ng, A. L. Bonini and H. R. Rocha for support on the experimental setup project and A.
Correia for revising this manuscript. The authors acknowledge
the anonymous referees comments and suggestions which helped improving the final version.
Edited by: A. B. Guenther
References
Andreae, M. O.: Biomass burning: Its history, use and distribution and its impact on environmental quality and global climate, in: Global Biomass Burning: Atmospheric, Climatic and Biospheric Implications, edited by: Levine, J. S., MIT Press, MA, 3–21, 1991.
Andreae, M. O., Artaxo, P., Brand˜ao, C., Carswell, F. E., Cicci-oli, P., da Costa, A. L., Culf, A. D., Esteves, J. L., Gash, J. H. C., Grace, J., Kabat, P., Lelieveld, J., Malhi, Y., Manzi, A. O., Meixner, F. X., Nobre, A. D., Nobre, C., Ruivo, M. d. L. P., Silva-Dias, M. A., Stefani, P., Valentini, R., von Jouanne, J., and Waterloo, M. J.: Biogeochemical cycling of carbon, wa-ter, energy, trace gases, and aerosols in Amazˆonia: The LBA-EUSTACH experiments, J. Geophys. Res., 107(D20), 8066, doi:10.1029/2001JD000524, 2002.
Andreae, M. O., Rosenfeld, D., Artaxo, P., Costa, A. A., Frank, G. P., Longo, K. M., and Silva-Dias, M. A.: Smoking rain clouds over the Amazon, Science, 303, 1337–1342, 2004.
Chameides, W. L., Yu, H., Liu, S. C., Bergin, M., Zhou, X., Mearns, L., Wang, G., Kiang, C. S., Saylor, R. D., Luo, C., Huang, Y., Steiner, A., and Giorgi, F.: Case study of the effects of atmo-spheric aerosols and regional haze on agriculture: An
opportu-nity to enhance crop yields in China through emission controls?, Proc. Natl. Acad. Sci. USA, 96, 13 626–13 633, 1999.
Chand, D., Guyon, P., Artaxo, P., Schmid, O., Frank, G. P., Rizzo, L. V., Mayol-Bracero, O. L., Gatti, L. V., and Andreae, M. O.: Optical and physical properties of aerosols in the boundary layer and free troposphere over the Amazon Basin during the biomass burning season, Atmos. Chem. Phys. Discuss, 4373–4406, 2005. Cohan, D. S., Xu, J., Greenwald, R., Bergin, M. H., and Chameides, W. L.: Impact of atmospheric aerosol light scattering and absorp-tion on terrestrial net primary productivity, Global Biogeochem. Cycles, 16(4), 1090, doi:10.1029/2001GB001441, 2002. Dubovik, O. and King, M. D.: A flexible inversion algorithm for
retrieval of aerosol optical properties from Sun and sky radiance measurements, J. Geophys. Res., 105, 20 673–20 696, 2000. Eck, T. F., Holben, B. N., Slutsker, I., and Setzer, A.:
Measure-ments of irradiance attenuation and estimation of aerosol single scattering albedo for biomass burning aerosols in Amazonia, J. Geophys. Res., 103, 31 865–31 878, 1998.
Gu, L., Fuentes, J. D., Shugart, H. H., Staebler, R. M., and Black, T. A.: Responses of net ecosystem exchanges of carbon diox-ide to changes in cloudiness: results from two North American deciduous forests, J. Geophys. Res., 104, 31 421–31 434, 1999. Gu, L., Baldocchi, D., Verma, S. B., Black, T. A., Vesala, T., Falge,
E. M., and Dowty, P. R.: Advantages of diffuse radiation for ter-restrial ecosystem productivity, J. Geophys. Res., 107(D6), 4050, ACL 2-1 to ACL 2-23, 2002.
Gu, L., Baldocchi, D., Wofsy, S. C., Munger, J. W., Michalsky, J. J., Urbanski, S. P., and Boden, T. A.: Response of a deciduous forest to the Mount Pinatubo eruption: Enhanced Photosynthesis, Science, 299, 2035–2038, 2003.
Hansen, J., Sato, M., and Ruedy, R.: Radiative forcing and climate response, J. Geophys. Res., 102(D6), 6831–6864, 1997. Hao, W. M., Ward, D. E., Susott, R. A., Babbitt, R. E., Nordgren,
B. L., Kaufman, Y. J., Holben, B. N., and Giles, D. M.: Com-parison of aerosol optical thickness measurements by MODIS, AERONET sun photometers, and Forest Service handheld sun photometers in southern Africa during the SAFARI 2000 cam-paign, Int. J. Remote Sens., 29(19), 4169–4183, 2005.
Holben, B. N., Eck, T. F., Slutsker, I., Tanr´e, D., Buis, J. P., Set-zer, A., Vermote, E., Reagan, J. A., Kaufman, Y. J., Nakajima, T., Lavenu, F., Jankowiak, I., and Smirnov, A.: AERONET – A federated instrument network and data archive for aerosol char-acterization, Rem. Sens. Environ., 66(1), 1–16, 1998.
Jones, H. G.: Plants and Microclimate. A quantitative approach to environmental plant physiology, Cambridge University Press, Cambridge, 1992.
Kaufman, Y. J. and Fraser, R. S.: Confirmation of smoke particles effect on clouds and climate forcing, Science, 277, 1636–1639, 1997.
Kaufman. Y. J. and Nakajima, T.: Effect of Amazon smoke on cloud microphysics and albedo - Analysis from satellite imagery, J. Appl. Meteor, 32, 729–744, 1993.
Kaufman, Y. J., Tanr´e, D., Remer, L. A., Vermote, E., Chu, A., and Holben, B. N.: Operational remote sensing of tropospheric aerosol over land from EOS Moderate Resolution Imaging Spec-troradiometer, J. Geophys. Res., 102, 17 051–17 067, 1997. Kaufman, Y. J., Hobbs, P. V., Kirchhoff, V. W. J. H., Artaxo, P.,
Remer, L. A., Holben, B. N., King, M. D., Ward, D. E., Prins, E. M., Longo, K. M., Mattos, L. F., Nobre, C. A., Spinhirne, J. D.,
Ji. Q., Thompson, A. M., Gleason, J. F., Christopher, S. A., and Tsay, S.-C.: Smoke, Clouds, and Radiation-Brazil (SCAR-B) ex-periment, J. Geophys. Res., 103(D24), 31 783–31 808, 1998. Koren, I., Kaufman, Y. J., Remer, L. A., and Martins, J. V.:
Mea-surement of the effect of Amazon smoke on inhibition of cloud formation, Science, 303, 1342–1345, 2004.
Niyogi, D., Chang, H.-I., Saxena, V. K., Holt, T., Alapaty, K., Booker, F., Chen, F., Davis, K. J., Holben, B., Matsui, T., Mey-ers, T., Oechel, W. C., Pielke Sr., R. A., Wells, R., Wilson, K., and Xue, Y.: Direct observations of the effects of aerosol
load-ing on net ecosystem CO2exchanges over different landscapes,
Geophys. Res. Lett., 31, L20506, doi:10.1029/2004GL020915, 2004.
Procopio, A. S., Remer, L. A., Artaxo, P., Kaufman, Y. J., and Holben, B. N.: Modeled spectral optical properties for smoke aerosols in Amazonia, Geophys. Res. Lett., 30, 24, 2265–2270, doi:10.1029/2003GL018063, 2003.
Procopio, A. S., Artaxo, P. Kaufman, Y. J., Remer, L. A., Schafer, J. S., and Holben, B. N.: Multiyear analysis of amazonian biomass burning smoke radiative forcing of climate, Geophys. Res. Lett., 31, L03108, doi:10.1029/2003GL018646, 2004.
Remer, L. A., Y. J. Kaufman, D. Tanr´e, S. Mattoo, D. A. Chu, J. V. Martins, R.-R. Li, C. Ichoku, R. C. Levy, R. G. Kleidman, T. F. Eck, E. Vermote, and B. N. Holben.: The MODIS Aerosol Algorithm, Products, and Validation, J. Atmos. Sci. 62, 947–973, 2005.
Ricchiazzi, P., Yang, S., Gautier, C., and Sowle, D.: SBDART: A research and teaching software tool for plane-parallel radiative transfer in the Earth’s Atmosphere, Bull. Amer. Meteorol. Soc., 79(10), 2101–2114, 1998.
Rummel, U., Ammann, C., Gut, A., Meixner, F. X., and Andreae, M. O.: Eddy covariance measurements of nitric oxide flux within an Amazonian rain forest, J. Geophys. Res., 107(D20), 8050, doi:10.1029/2001JD000520, 2002.
Schafer, J. S., Eck, T. F., Holben, B. N., Artaxo P., Yamasoe, M. A., and Procopio, A. S.: Observed reductions of total solar ir-radiance by bio-mass burning aerosols in the Brazilian Ama-zon and Zambian Savanna, Geophys. Res. Lett., 29(17), 1823, doi:10.1029/2001GL014309, 2002.
Spitters, C. J. T., Toussaint, H. A. J. M., and Goudriaan, J.: Separat-ing the diffuse and direct component of global radiation and its implications for modeling canopy photosynthesis – Part I. Com-ponents of incoming radiation, Agric. For. Meteorol., 38, 217– 229, 1986.
Spitters, C. J. T.: Separating the diffuse and direct component of global radiation and its implications for modeling canopy photo-synthesis – Part II. Calculation of canopy photophoto-synthesis, Agric. For. Meteorol., 38, 231–242, 1986.
Twomey, S.: The influence of pollution on the shortwave albedo of clouds. J. Atmos. Sci., 34, 1149–1152, 1977.
Von Randow, C., S´a,. L. D. A., Gannabathula, P. S. D., Manzi, A. O., and Arlino, P. R. A.: Scale variability of atmospheric sur-face layer fluxes of energy and carbon over a tropical rain forest in southwest Amazonia 1. Diurnal conditions, J. Geophys. Res., 107(D20), 8062, doi:10.1029/2001JD000379, 2002.
Von Randow, C., Manzi, A. O., Kruijt, B., Oliveira, P. J., Zanchi, F. B., Silva, R. L., Hodnett, M. G., Gash, J., Elbers, J., Waterloo, M. J., Cardoso, F. L., and Kabat, P.: Comparative measurements and seasonal variations in energy and carbon exchange over forest
1656 M. Yamasoe et al.: Effect of smoke and clouds on transmission of PAR and pasture in South West Amazonia, Theor. Appl. Climatol.,
78, 5–26, doi:10.1007/s00704-004-0041-z, 2004.
Wiscombe, W.: Improved Mie Scattering Algorithms, Appl. Opt., 19, 1505–1509, 1980.
Yamasoe, M. A., Artaxo, P., Miguel, A. H., and Allen, A. G.: Chem-ical composition of aerosol particles from direct emissions of vegetation fires in the Amazon Basin: water-soluble species and trace elements, Atmos. Environ., 34, 1641–1653, 2000.
Young, D. R. and Smith, W. K.: Effect of cloudcover on photo-synthesis and transpiration in the Subalpine understory species Arnica Latifolia, Ecology, 64(4), 681–687, 1983.