HAL Id: hal-03081243
https://hal.archives-ouvertes.fr/hal-03081243
Submitted on 18 Dec 2020
HAL is a multi-disciplinary open access
archive for the deposit and dissemination of
sci-entific research documents, whether they are
pub-lished or not. The documents may come from
teaching and research institutions in France or
abroad, or from public or private research centers.
L’archive ouverte pluridisciplinaire HAL, est
destinée au dépôt et à la diffusion de documents
scientifiques de niveau recherche, publiés ou non,
émanant des établissements d’enseignement et de
recherche français ou étrangers, des laboratoires
publics ou privés.
meteorological characteristics of “dust devil” vortices
observed by InSight on Mars
Ralph D. Lorenz, Aymeric Spiga, Philippe Lognonne, Matthieu Plasman,
Claire Newman, Constantinos Charalambous
To cite this version:
Ralph D. Lorenz, Aymeric Spiga, Philippe Lognonne, Matthieu Plasman, Claire Newman, et al.. The
whirlwinds of Elysium: A catalog and meteorological characteristics of “dust devil” vortices observed
by InSight on Mars. Icarus, Elsevier, 2021, 355, �10.1016/j.icarus.2020.114119�. �hal-03081243�
UNCORRECTED
PROOF
Contents lists available at ScienceDirect
Icarus
journal homepage: http://ees.elsevier.com
The whirlwinds of Elysium: A catalog and meteorological characteristics of “dust devil”
vortices observed by InSight on Mars
Ralph D.Lorenz
a,⁎, AymericSpiga
b,f, PhilippeLognonné
c, MatthieuPlasman
c, Claire E.Newman
d,
Constantinos Charalambous
eaJohns Hopkins Applied Physics Laboratory, Laurel, MD 20723, USA
bLaboratoire de Météorologie Dynamique (LMD/IPSL), Sorbonne Université, Centre National de la Recherche Scientifique, École Polytechnique, École Normale Supérieure, Paris, France cInstitut de Physique du Globe de Paris, Université de Paris, CNRS, Paris, France
dAeolis Research, 333 N Dobson Road, Unit 5, Chandler, AZ 85224-4412, USA
eImperial College London, Department of Electrical and Electronic Engineering, Imperial College London, South Kensington Campus, London SW7 2AZ, United Kingdom fInstitut Universitaire de France, Paris, France
A R T I C L E I N F O
Keywords Mars atmosphere Convective vortices Dust devils StatisticsA B S T R A C T
A catalog of convective vortex encounters recorded by InSight on the Martian surface is presented, through Sol 390 of the mission. The catalog summarizes key meteorological parameters such as wind speed and direction be-fore the event, peak wind, the duration and magnitude of the pressure excursion, temperatures and solar array data where present. Additional seismic parameters are also provided on seismometer-detected ground accelera-tion. The catalog is intended as a resource for vortex population studies, and as an index for examining these meteorological events in detail and to assess possible geophysical (seismic or magnetic) signatures. Whereas it is difficult to evaluate ‘anecdotal’ results in small surveys, the large number of events (853 with a pressure drop exceeding 0.8 Pa) in this work permits robust statistical evaluation. For example, it is found that three times as many pressure profiles have slower onsets than decays than vice versa, indicating an asymmetry in the surface pressure field due to the tilted advection of the vortex by ambient wind. A vortex area fraction of 0.07% during the most active six hours of the day is deduced.
1. Introduction
Dust devils, and their invisible dustless vortex counterparts, are one of the most prominent, and fascinating, aspects of Martian meteorology. They have been documented by every landed mission (even those – the Mars Exploration Rovers – without dedicated meteorological instrumen-tation). Dust devils play important roles in injecting dust into the atmos-phere (e.g. Cantor et al., 2006; Kahre et al., 2006) and causing sur-face albedo changes via the formation of dust devil tracks (e.g. Reiss and Lorenz, 2016). They also impact the operation of solar-powered vehicles on Mars, via the removal of airfall dust from solar panels, and are believed to be responsible for the ‘cleaning’ of surfaces and optics on several surface missions (e.g. Holstein-Rathlou et al., 2010; Kinch et al., 2015; Vicente-Retortillo et al., 2018; Reiss and Lorenz, 2016). A further virtue of vortices for InSight, given the apparent dearth of ge-ological seismic events, is their role as a (negative) surface load which probes the elastic properties of the near-surface (Murdoch et al., 2017; Banerdt et al., 2020; Lognonné et al., 2020; Kenda et al., 2020).
The InSight lander has been operating on the surface of Mars since November 2018 and, as a fixed geophysical monitoring platform with meteorological instrumentation, is yielding a record of Martian weather that is transformative in its detail and uniformity (Banfield et al., 2020). Very soon after its instrumentation was checked out, transient pressure drops due to convective vortices were detected. Spiga et al., 2020 presented the detection of almost ten thousand pressure drop events through Sol 390, noting the seasonal evolution of the population in response to changing wind and insolation patterns, as well as due to the passage of a dust storm.
The present paper presents a catalog of the largest events in that same period, extracting key meteorological parameters beyond the sim-ple pressure drop magnitude. The catalog comprises ‘browse’ plots of key meteorological variables over the 2 min period around the maxi-mum pressure drop, and an ASCII table of key extracted quantities. It is not intended that strong conclusions be drawn from any single catalog entry – the original data should be reviewed over a wider period for full context, for example – but broad statistical correlations from the catalog should be valid.
⁎Corresponding author.
E-mail address: RALPH.LORENZ@JHUAPL.EDU (R.D. Lorenz)
https://doi.org/10.1016/j.icarus.2020.114119
UNCORRECTED
PROOF
We show in this paper a few example plots of events to illustrate the data quality and features of the vortices. The present study also reviews some statistical aspects of the vortex population and some relationships between the vortex properties and meteorological parameters. This pa-per is not intended as an exhaustive investigation of all possible correla-tions – indeed the provision of the catalog is precisely intended to facili-tate investigations that the authors have not anticipated. It is hoped that the catalog will help identify occasions where close scrutiny of other datasets may be of interest.
2. Data acquisition and catalog generation
The present catalog of vortex properties (access and structure of the catalog are discussed in the appendix) retrieves the local time series of all meteorological data in the 2 min around these events and extracts key parameters. Examples of the browse plots are shown in Figs. 1-3.
The pressure time series, being the most heavily-sampled data and most uniform in quality over the course of the mission, is used to define the vortex event, as in many previous studies. Pressure signals also tend to be the most robust vortex indicators. The detection method of InSight vortex encounters by induced pressure drops is described in Spiga et al., 2020 and Banfield et al., 2020. Although the resolution of the Auxiliary Payload Sensor Suite (APSS) pressure sensor (Banfield et al. 2019) is exquisite (~0.01 Pa) the background fluctuations in pressure are typically of the order of 0.1 Pa and a practical detection threshold scales to some multiple of this value. Generally, the peak pressure drops reported in the catalog appear to be accurate to 5% or better, but in 5%–10% of cases, irregularities in the background pressure may cause the peak to be mis-estimated by up to 20% or so. In other words, the ac-curacy of estimating the pressure drop is not limited by the instrument precision, but rather on where or how the vortex is defined to begin and end. In this respect, however, the present survey is no different from other pressure surveys on Earth and Mars.
As noted in Spiga et al., 2020 many thousands of pressure excur-sions with amplitudes of 0.3 or 0.5 Pa (thresholds used in studies by Pathfinder (Murphy and Nelli, 2002), Phoenix (Ellehoj et al., 2010) and Curiosity (e.g. Ordóñez-Etxeberria et al., 2020) have been de-tected at InSight. However, the signatures in other meteorological data of such small events are typically comparable with the background fluc-tuations associated with convective turbulence. Thus to focus attention where vortex signatures are relatively unambiguous, the present catalog is restricted to events with a pressure drop of 0.8 Pa or more.
Wind data on InSight are recorded by a pair of thermal anemome-ters (‘TWINS’) pointing in the Plus and Minus Y directions in the lo-cal lander level (LL) (roughly East and West respectively). The sensors are located at the edge of the lander deck and stand at approximately 1.2 m from the ground, with a 10 cm difference between the two due to the tilt of the landed spacecraft in Homestead hollow (Banfield et al. 2019). These sensors have a sample rate of 1 Hz and post-process-ing combinpost-process-ing the data from both sensors (if both are powered on) de-termines the best overall estimate of wind direction and wind speed. However, the rapidly-changing speed and direction in a vortex often defeats this estimation process and itfails to generate a valid estimate. This results in some data gaps, often frustratingly at the most interest-ing moment in the record. This is particularly important for the wind peaks which are most critical for inferring the friction speeds required for inducing an aeolian change on the Martian surface (Charalam-bous et al., 2020, Baker et al., 2020). We report, in the catalog plots, the separate intermediate products (the so-called Plus and Minus wind speeds), and (following Charalambous et al., 2020) consider the most likely ‘true’ value to be the higher of the two if both are available: this is the value reported in the catalog table. The retrieved wind di-rection tends to be retrieved more reliably than the speed. Although a full diagnosis of the wind measurement precision (which is dependent
on the wind speed itself, the direction, and the turbulent variation of these quantities and temperature) is beyond the scope of the present paper, simple inspection of the time series in vortex events shows that point-to-point variations of 5 m/s are not unusual, and thus the rate of data acquisition alone limits the fidelity of the wind history to ~3 m/s or so (i.e. an arbitrary time shift of the reading by half a second would lead to a change in the value by this amount.) For the typical wind-speeds of 5–20 m/s in a vortex event, this seems broadly consistent with the stated accuracy of 15% (Banfield et al. 2019).
Lorenz (2016) described a model by which the diameter, intensity and miss distance of a vortex might be estimated (albeit not completely unambiguously) from pressure and wind time series. The intense fluctu-ations in InSight reported wind speeds, and the frequent data gaps, mean such an estimation is difficult in most of the encounters. Although it may succeed, perhaps in combination with seismometer data, in perhaps the best 10–20% of cases, this has not been attempted in the present work.
Dust devils have an optical signature, as their name implies, and can be detected by the solar shadow cast by the dust (e.g. Lorenz and Jack-son, 2015). InSight's solar panels can in principle record such shadows, and these records have indicated dust variations and clouds on Mars (Lorenz et al., 2020). However, solar array data are only recorded when the lander is ‘awake’ to perform radio transmissions or other high power operations, hence long gaps exist when no data are available. Furthermore, for most of the mission, solar array currents have been recorded at a low cadence of ~30s intervals or longer, so the solar array information in the present catalog has very limited value. However, the sampling cadence was recently (Sol 426) increased to 4 s hence these data will likely be of greater interest in any future catalog releases.
Both positive and negative air temperature perturbations have been noted in terrestrial vehicle encounters (e.g. Sinclair, 1973), depending on whether a wide vortex with a resolved (‘cold’) downdraft is pene-trated by the encounter (equivalently, the dust devil passes directly over a fixed station, as at InSight) or not. Detecting such air temperature per-turbations is even more difficult on Mars, where sensors take apprecia-ble time to respond to the thin atmosphere. The maximum and mini-mum air temperatures in the record are reported in the table to permit an assessment of variation overall, but temperature signatures are much less consistent than pressure or wind.
3. Population characteristics
The catalog allows exploration of statistical properties of, and cor-relations between, the various parameters. The large number of events permits relations to be exposed against the obfuscating random varia-tion of vortex characteristics and encounter geometries.
The full catalog of 853 events is available electronically (see appen-dix); the summary entries of a small subset (the ‘top ten’ in terms of pressure drop Sols 1–390) are presented in Table 1. Some basic details of some other events of note, such as those discussed in the literature, are provided in Table 2. The following sections discuss some overall features of the population.
3.1. Pressure and wind speed statistics
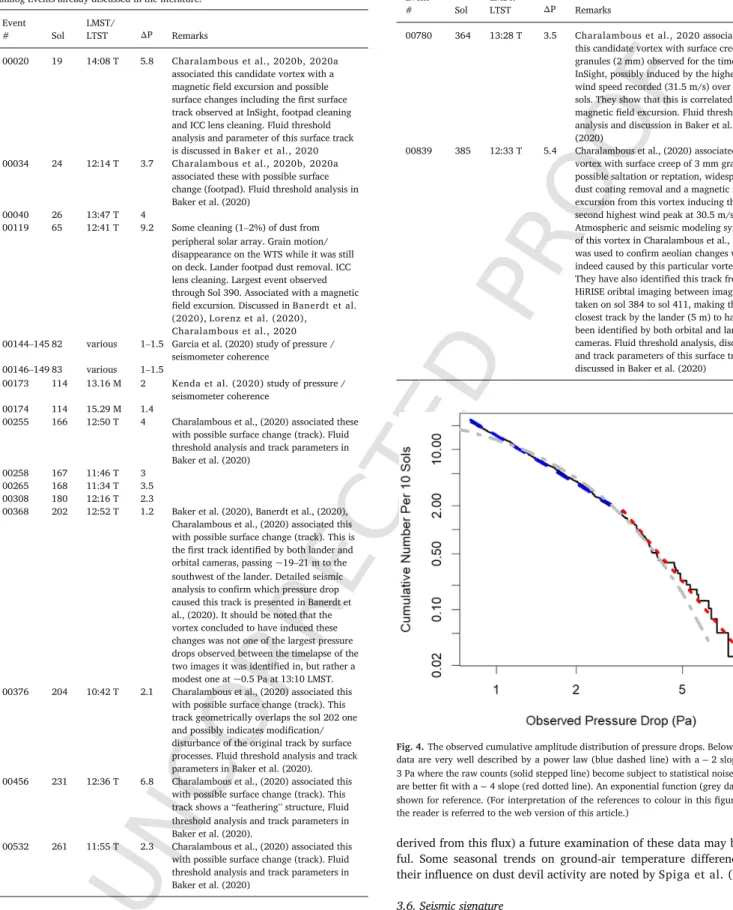
The cumulative plot of peak pressure excursions (dips) is shown in Fig. 4. As noted previously (Banfield et al., 2020; Spiga et al., 2020), the InSight vortex population is very abundant, with several times more detections per day than previous landing sites for which pressure data were available (i.e. excluding the Gusev crater site at which the Spirit rover imaged large numbers of very large dust devils), and with the largest events detected on Mars to date (event 119 on In-Sight Sol 65). At our 0.8 Pa threshold, 2–3 events per Sol are observed.
UNCORRECTED
PROOF
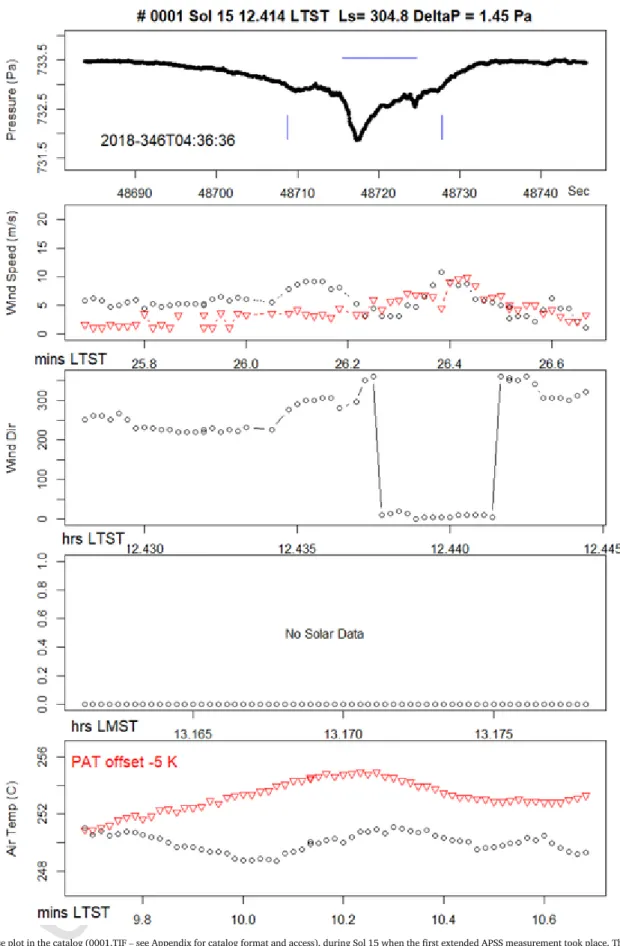
Fig. 1. First browse plot in the catalog (0001.TIF – see Appendix for catalog format and access), during Sol 15 when the first extended APSS measurement took place. This modest (1.45 Pa)
event caused wind direction to veer by about sixty degrees. It is unusual in indicating a temperature perturbation of ~2 K that appears associated with the relatively long duration of the event (notice that the +Y air temperature curve (red triangles), rather warmer than the other side (−Y, black circles) is shifted downwards here by 5 K to be shown well in the same graph. The time axis is the same in all plots, but is labelled with the various units and time systems to facilitate referencing to other datasets. The horizontal blue bar denotes the duration over which the event had a pressure excursion exceeding 50% of the maximum; the vertical blue bars denote where the excursion is 33% or more. The universal time (UTC)
UNCORRECTED
PROOF
indicated in the lower left of the pressure plot corresponds to the start of the record: UTC is the preferred time reference for the seismological community. Minutes LMST and LTST are since the start of the respective hour; the seconds in the uppermost plot are seconds from the start of the APSS record for that Sol. (For interpretation of the references to colour in this figure legend, the reader is referred to the web version of this article.)
The population has a skewed distribution that can be approximated by one or more power law segments. As discussed previously (Lorenz, 2013), lengthy but inconclusive debates may be had with finite, noisy datasets on the relative merits of power law, lognormal, exponential or other fits. In the present instance, an exponential (see e.g. Kurgansky, 2006) has a convexity similar to the population overall, but introduces too much curvature (as was the case for Mars Exploration Rover dust devil diameters, Lorenz, 2009, which were better fit by a power law). An alternate description may be of two power law segments, raising the interesting question of whether the break point between them (the ‘knee’ in the curve) at 3 Pa has any physical significance or interpreta-tion. Spiga et al., 2020 show their catalog as differential rather than cumulative counts, and a change of slope can be discerned (albeit nois-ily) at this point. They fit the population with a single differential power law of −3.5 (thus a cumulative one of −2.5, in effect a weighted average of the −2 and − 4 slopes we identify here).
The peak observed pressure drop and its relation to the core pressure drop of the vortex, depends on the miss distance. Only in the case of a completely diametric encounter, where the center of the vortex passes right over the sensor (whose inlet is on the lander deck, Banfield et al., 2019) does the measurement recover the core pressure drop. Similarly, the peak wind speed measured is a vector sum of the ambient wind (as-sumed uniform) with the vortex wind field (zero at the core, and a max-imum at the ‘wall’, and decaying with distance beyond the wall). As dis-cussed in Lorenz (2016) and elsewhere, a wind time series that shows a single broad peak likely indicates an encounter that did not penetrate the wall (and thus did not sample the maximum wind), whereas a dia-metric encounter with a strong vortex will show a double peak as first the leading wall passes over the sensor, then the calm core, then the fol-lowing wall. Although some modest uncertainties exist depending on the geometry, a good approximation of the maximum circumferential wind is the difference between the peak wind measured and the ambient wind (i.e. that before and after the encounter). We may note, however, that in many InSight encounters, the peak wind experienced by the lander may not be captured by the TWINS wind sensor record due to the highly dy-namic nature of the flow defeating the pipeline calibration.
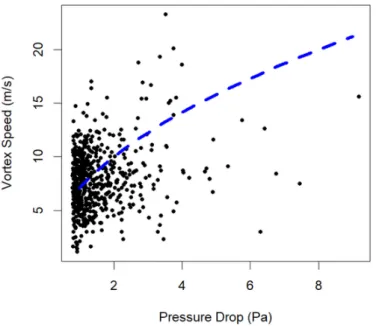
In principle, the peak wind and core pressure drop are related by the cyclostrophic balance: the radial pressure gradient dP/dr at distance r provides the centripetal acceleration to cause the quasi-circular motion of the air parcel. Thus, dP/dr = ρV2/r with V the local circumferential velocity and ρ the atmospheric density. There are various analytic mod-els of pressure and velocity profiles, but in all, the wall (the distance of maximum velocity) is where the pressure has fallen to one half of the core drop. Thus, depending on the function chosen, this integrates to ΔPcore= K ρVmax2, with K in the range 1–2. Fig. 5 shows that the data are not inconsistent with this relationship (using K ~ 1 and ρ ~ 0.02 kg/ m3, a typical value), albeit with large scatter since the observations may not capture the core pressure drop (due to non-diametric geometry), or may not capture the peak velocity (due to sensor drop-out or not pen-etrating the wall), or both (due to non-wall-penpen-etrating geometry and/ or drop-out). Thus measured pressure drops serve as a useful proxy for peak speed and thus ‘intensity’ overall.
3.2. Durations, area fraction and timing
As noted in Jackson et al. (2018) the detection of transients by filtering (e.g. via the Short Term Average – Long Term Average differ-ence or ratio (STA/LTA)) by definition pre-selects the duration of de-tected events. The filter used to detect events here and in Spiga et al., 2020 detects local drops in the ‘detrended’ pressure time series, i.e.
that from which a 1000-s moving average has been subtracted. Thus this filter is in effect simply a high pass filter, which is effective here be-cause the noise amplitude is lower than the events of interest. This ap-proach would rejects events that are longer than several hundred sec-onds. However, in fact most events Figure 6are only about 10 s long. Fortunately the pressure sensor at least is generally sampled at a high rate (data recorded at up to 20 samples per second, although lower rates of 2 samples per second were used early in the mission) to provide good resolution even on these short events.
Of interest is the integrated duration of the detected events, about 6000 s. If we consider the active period of convection to be roughly one quarter of the diurnal period long as on Earth (e.g. 11–17 h local solar time), then the observation period spans about 370 quarter sols or ~ 8 million seconds (although the Martian solar day or Sol is 88,775 s long, or 2.7% longer than Earth's, the rather approximate calculation here is not significantly affected), then the lander was ‘inside’ a vortex for ~0.07% (7 × 10⁻⁴) of the active period. This time fraction F (an ‘ex-posure duty cycle’) defines the effective instantaneous area fraction of vigorous dust devils (i.e. >0.8 Pa, or > ~5 m/s) during the convective part of the day. The quantity is the integral across the vortex popula-tion N(D) per km2per day of (diameter * longevity [t] * advection speed [U])1times the duration of each event, i.e. (diameter / advection speed). (1) A previous calculation, based on observed dust devil diameters ob-tained by imaging at the Gusev site by the Spirit rover, indicated an area fraction of 1.6 × 10⁻⁴(Lorenz and Jackson, 2016). However, this was calculated for the entire period (i.e. based on an optical diam-eter population and calculated over the full day). Thus it should be ad-justed upwards by a factor of 4 to reflect the density during the convec-tive part of the day, yielding a reassuring, if not remarkable, agreement (~6.4 × 10⁻⁴) with the InSight area fraction above.
The first term in eq.1, (DtU), is the area swept by the detectable pres-sure footprint of the vortex, and is defined in part by the prespres-sure thresh-old used. If the pressure threshthresh-old is equivalent to the surface stress needed to lift surface material, then this ΣN(D)DtU quantity would be-come the track area generation rate in terms of km2per km2per day. Reiss and Lorenz (2016) measured this quantity in the InSight region to be 6 × 10⁻⁵to 3 × 10⁻⁴km2per km2per Sol, see also Perrin et al., 2020. If we multiply by the typical event duration (~D/U ~ 7 s or 10−4Sol, 4 × 10⁻⁴of the active period) then we find the area frac-tion F for track forming vortices to be only 10−7, or about four orders of magnitude smaller than the area fraction F we have calculated for vor-tices with 0.8 Pa pressure signatures. It is tempting to interpret Fig. 4 to infer, therefore, that the pressure drop which yields 10−4of the en-counter rate of 0.8 Pa vortices (20 per 10 Sols), i.e. 0.002 enen-counters per 10 sols, is the vortex pressure drop associated with track formation, im-plying about 20-50 Pa. The in-situ vortex data are consistent, then, with a dust-clearing/track-forming event occurring at a given spot only once per 5000 Sols or so at InSight. This long interval is in disappointing con-trast with the 100–700 Sol interval and a 6–40 Pa threshold inferred by Lorenz and Reiss, 2015 for solar array cleaning events on the Spirit rover.
Quasi-periodicities have been noted in atmospheric vortex signa-tures on Earth and Mars, presumed to be due to the tendency of vor
1 Note that an empirical relationship for longevity exists as a function of diameter,
namely t = 40D0.66, where t and D are in seconds and meters respectively (Lorenz,
UNCORRECTED
PROOF
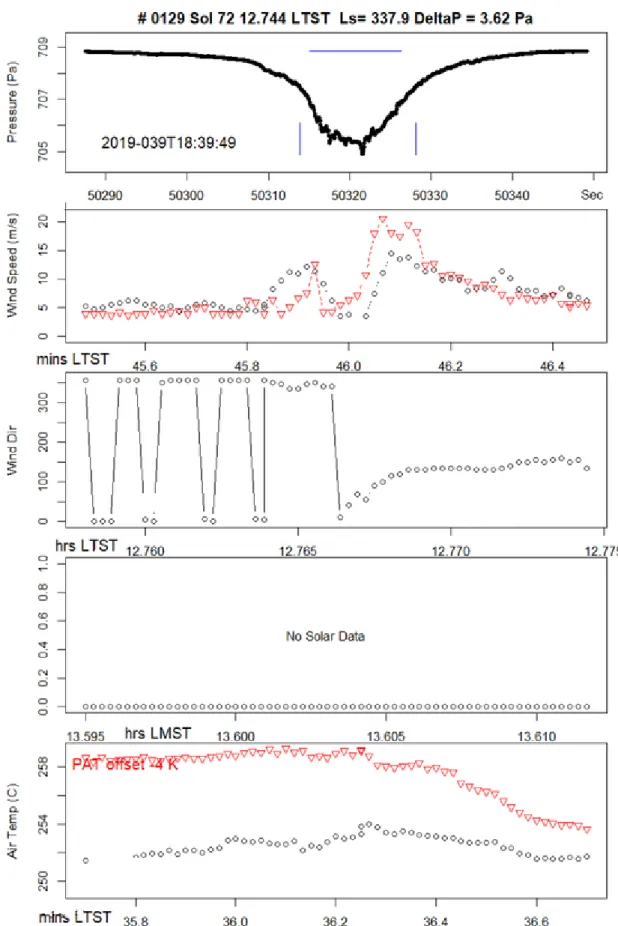
Fig. 2. A powerful vortex noted on Sol 72. This is a relatively large vortex in weak background winds, with a diametric penetration allowing the double peak in wind speed associated
with the ‘wall’ to be resolved. The wind direction in the record is dominated by the vortex winds, with a before/after difference of about 150 degrees.
tices to form in the corners of the upwelling sheets of air in the quasi-regular cellular convection pattern in the planetary boundary layer. This can even manifest (Fenton and Lorenz, 2017) in four dust devils
UNCORRECTED
PROOF
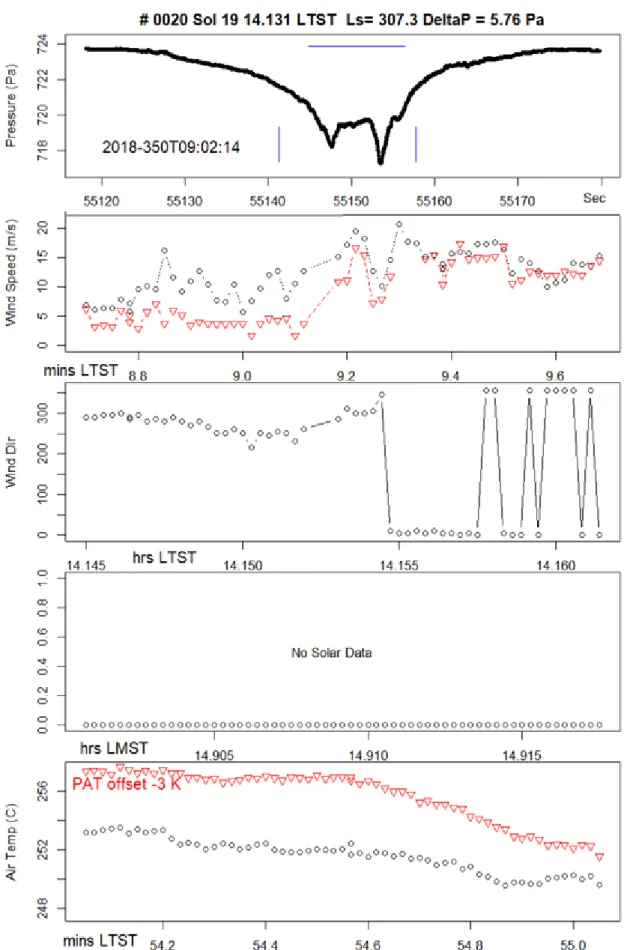
Fig. 3. A relatively strong event recorded on Sol 19. The pressure profile shows two discrete dips within a broader trough, indicating a multi-core vortex, or more likely a cycloidal
UNCORRECTED
PROOF
Table 1Top ten events by pressure drop in Sols 1–390. Table format is the same as the full 853-record ASCII catalog table, except the nearly empty columns pertaining to solar array current, and the LMST and UTC time columns have been omitted. The variables listed in each column are defined in the Appendix: a value of -9.9 indicates data are not available.
Num Sol LTST ΔP(Pa) Nwind Wmax(m/s) Wbef(m/s) Waftr(m/s) Wdir(deg) Atck(s) Dcay(s) Wdth(s) MinT1(K) MaxT1(K) Press(Pa) Ls(deg) 00119 65 13.53 9.18 53 20.1 6.9 4.5 20 2.6 1.3 2.9 249.9 252 702.1 334 00666 323 11.57 7.45 57 17.9 12 10.4 135 6 2.1 5.7 239 242.2 693.7 97.3 00456 231 12.6 6.76 61 16.4 9.5 8 115 1.4 1.5 1.9 241 242.9 753.9 55.9 00517 254 15.15 6.43 60 21.5 11 8.9 85 3.8 1.6 3.6 248.5 250.5 743.7 66.3 00463 233 11.51 6.3 62 13.9 10.9 11.3 143 0.6 0.4 0.6 236.5 238 754.6 56.8 00020 19 14.13 5.76 59 20.7 13.7 7.3 355 12.2 4.1 11.6 249.6 253.5 722.9 307.3 00076 39 12.73 5.67 5 24.8 −9.9 −9.9 310 13.5 4 12 261 265.2 718.8 319.2 00839 385 12.56 5.35 59 20 15.8 10.9 140 1.1 0.8 1.2 249.2 251.1 638.4 126.6 00274 170 14.16 5.18 6 14 −9.9 −9.9 95 3.1 2.2 3.2 249.9 251.2 737 27.8 00709 337 11.38 4.92 58 19.5 13.1 7.9 110 6.9 6.2 9.2 233.7 236.2 680 103.8
appearing equispaced in a line. Cellular convective patterns were puta-tively detected by the ultra-sensitive pressure sensor on board InSight (Spiga et al., 2020), and regularly-spaced pressure dips have been noted in terrestrial studies.
If the boundary layer were a constant depth (say 5 km), and ad-vected at a constant speed (10 m/s), then we would expect the roughly equant (depth/diameter = 1) cells to pass at intervals of ~500 s or 9 min. If every cell wall was populated with a vortex, then encounters would occur with this period: on the other hand, if vortices only popu-late a subset of the cell boundaries, encounters would occur at integer multiples of the period.
A histogram of the intervals between events in the catalog is shown in Fig. 7. Although there are hints of peaks at ~25 and 50 min, the significance is low. It may be that the changing depth of the boundary layer, and varying wind speeds, ‘smear out’ the peaks and that exami-nation of restricted sets of data, and/or examiexami-nation of the much more extensive catalog of pressure drops down to 0.3 Pa, may show possible regularities better. An investigation of such regularities with LES would be of interest, but this is beyond the scope of the present paper.
3.3. Vortex dependence on wind
There are several aspects by which wind may influence vortex detec-tions. First, it is well-known from optical field observations that there is a ‘sweet spot’ of wind speed for dust devil formation - some ambient wind is required to provide adequate circulation (or vorticity) for dust devil rotation. On the other hand, strong winds cause shear which tends to destroy the vortex structure: see discussion in Rafkin et al. (2016). There is also, as discussed in Spiga et al. (2020) an observation bias for single-station measurements towards higher detection numbers for a given formation rate, because (unless longevity has a dependence on wind speed, which may or may not be the case), a vortex sweeps a longer track and thus has a higher detection footprint, in stronger winds. It is seen in Fig. 8 that most vortices at InSight were detected when the wind before the event was 7–13 m/s. However, this may be sim-ply a result of afternoon winds at InSight being predominantly in this range (Spiga et al., 2020) – a more systematic study of the statistics of wind during non-detection periods would be needed to draw strong conclusions. Similarly, a histogram of wind azimuths (Fig. 9) shows that, consistent with the direction of dust devil tracks observed in the environs of the InSight landing site (Reiss and Lorenz, 2016; Perrin et al., 2020) most vortices were detected when the wind was blowing from the southeast (~140 degrees) which is typical for the wind direc-tion in the peak convecdirec-tion period of the day (afternoon) for this sea-son. The secondary peak in the histogram is largely due to the early
part of the mission when winds were more typically from the north or northwest.
3.4. Asymmetry of pressure profiles
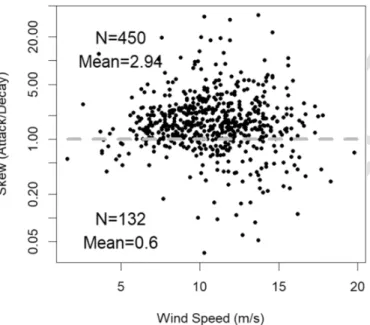
In the ideal model of a two-dimensional vortex being advected past a measurement station (e.g. Lorenz, 2016), the pressure field is aximetric and the cut through it by the measurement site is bilaterally sym-metric about the instant of closest approach. However, it has been noted (e.g. Sinclair, 1973; Lorenz, 2011) that the observed pressure profile is often asymmetric, with a shallower ‘attack’ and a steeper ‘decay’. In the catalog, this shape aspect is quantified by separate attack and decay timescales (see appendix) defined by the times between the pressure ex-cursion peak, and passing a threshold of 20% of the peak. We determine a skewness measure as the ratio of these two times, and this is plotted against windspeed in Fig. 1 (note that the number of points shown is less than the full catalog, since adequate wind data was not present for all events in the catalog.
It is seen that indeed, positively skewed (slower attack than decay) events are more common, by a factor of about three. The interpreta-tion – as discussed in Sinclair (1973) is that the vortex is of course actually three-dimensional, and is tilted forward by the ambient wind shear. Crudely, ground ahead of the vortex intersection with the ground is closer to the tilted cylinder than is ground behind, and so sees part of the low pressure field earlier, hence the longer attack time. The scatter in Fig. 10 suggests that there may be some dependence of the skew on wind speed, with the stronger skew values occurring for intermediate to strong winds, although there may also be a fall-off at the highest ambi-ent winds. The question may bear further study, perhaps with differambi-ent skewness metrics and/or with Large-Eddy Simulations.
3.5. Temperature fluctuations
Warm near-surface air is the principal energy source for dust devils, and strong near-surface temperature gradients are a useful field crite-rion for vortex activity (e.g. Rafkin et al., 2016). The signature of a vortex in time series of temperatures at a fixed height is known to be challenging to recognize, and the correlation of temperature fluctuation with vortex intensity in the catalog (Fig. 11) is not especially strong.
Ground temperatures are recorded on InSight with a radiometer in-strument (Mueller et al. 2020), intended principally to understand the surface boundary conditions on subsurface temperatures and heat flow. However, the data are not recorded frequently enough for routine com-parison with vortices and thus is not included in this catalog, although since vortices are a manifestation of the sensible heat flux term in the surface energy balance (and a predictive metric of dust devil activity is
UNCORRECTED
PROOF
Table 2Catalog Events already discussed in the literature. Event
# Sol LMST/LTST ΔP Remarks
00020 19 14:08 T 5.8 Charalambous et al., 2020b, 2020a associated this candidate vortex with a magnetic field excursion and possible surface changes including the first surface track observed at InSight, footpad cleaning and ICC lens cleaning. Fluid threshold analysis and parameter of this surface track is discussed in Baker et al., 2020 00034 24 12:14 T 3.7 Charalambous et al., 2020b, 2020a
associated these with possible surface change (footpad). Fluid threshold analysis in Baker et al. (2020)
00040 26 13:47 T 4
00119 65 12:41 T 9.2 Some cleaning (1–2%) of dust from peripheral solar array. Grain motion/ disappearance on the WTS while it was still on deck. Lander footpad dust removal. ICC lens cleaning. Largest event observed through Sol 390. Associated with a magnetic field excursion. Discussed in Banerdt et al. (2020), Lorenz et al. (2020), Charalambous et al., 2020 00144–145 82 various 1–1.5 Garcia et al. (2020) study of pressure /
seismometer coherence 00146–149 83 various 1–1.5
00173 114 13.16 M 2 Kenda et al. (2020) study of pressure / seismometer coherence
00174 114 15.29 M 1.4
00255 166 12:50 T 4 Charalambous et al., (2020) associated these with possible surface change (track). Fluid threshold analysis and track parameters in Baker et al. (2020)
00258 167 11:46 T 3 00265 168 11:34 T 3.5 00308 180 12:16 T 2.3
00368 202 12:52 T 1.2 Baker et al. (2020), Banerdt et al., (2020), Charalambous et al., (2020) associated this with possible surface change (track). This is the first track identified by both lander and orbital cameras, passing ~19–21 m to the southwest of the lander. Detailed seismic analysis to confirm which pressure drop caused this track is presented in Banerdt et al., (2020). It should be noted that the vortex concluded to have induced these changes was not one of the largest pressure drops observed between the timelapse of the two images it was identified in, but rather a modest one at ~0.5 Pa at 13:10 LMST. 00376 204 10:42 T 2.1 Charalambous et al., (2020) associated this
with possible surface change (track). This track geometrically overlaps the sol 202 one and possibly indicates modification/ disturbance of the original track by surface processes. Fluid threshold analysis and track parameters in Baker et al. (2020). 00456 231 12:36 T 6.8 Charalambous et al., (2020) associated this
with possible surface change (track). This track shows a “feathering” structure, Fluid threshold analysis and track parameters in Baker et al. (2020).
00532 261 11:55 T 2.3 Charalambous et al., (2020) associated this with possible surface change (track). Fluid threshold analysis and track parameters in Baker et al. (2020)
Event
# Sol LMST/LTST ΔP Remarks
00780 364 13:28 T 3.5 Charalambous et al., 2020 associated this candidate vortex with surface creep of granules (2 mm) observed for the time at InSight, possibly induced by the highest wind speed recorded (31.5 m/s) over 390 sols. They show that this is correlated with a magnetic field excursion. Fluid threshold analysis and discussion in Baker et al. (2020)
00839 385 12:33 T 5.4 Charalambous et al., (2020) associated this vortex with surface creep of 3 mm grains, possible saltation or reptation, widespread dust coating removal and a magnetic field excursion from this vortex inducing the second highest wind peak at 30.5 m/s. Atmospheric and seismic modeling synthesis of this vortex in Charalambous et al., (2020) was used to confirm aeolian changes were indeed caused by this particular vortex. They have also identified this track from HiRISE oribtal imaging between images taken on sol 384 to sol 411, making this the closest track by the lander (5 m) to have been identified by both orbital and lander cameras. Fluid threshold analysis, discussion and track parameters of this surface track is discussed in Baker et al. (2020)
Fig. 4. The observed cumulative amplitude distribution of pressure drops. Below 3 Pa, the
data are very well described by a power law (blue dashed line) with a − 2 slope: above 3 Pa where the raw counts (solid stepped line) become subject to statistical noise, the data are better fit with a − 4 slope (red dotted line). An exponential function (grey dash-dot) is shown for reference. (For interpretation of the references to colour in this figure legend, the reader is referred to the web version of this article.)
derived from this flux) a future examination of these data may be fruit-ful. Some seasonal trends on ground-air temperature differences and their influence on dust devil activity are noted by Spiga et al. (2020).
3.6. Seismic signature
Convective vortices (or more hopefully ‘dust devils’) were predicted before InSight launch to generate seismic signals. See field test on Earth by Lorenz et al. (2015) and modeling with Large Eddy Simulation and elastic loading theories by Kenda et al. (2017), Murdoch et al. (2017). This was verified by the first observations recorded by SEIS
UNCORRECTED
PROOF
Fig. 5. Observed vortex speed and observed pressure drop. A reference curve with theex-pected P ~ KρV2dependence (in this instance, Kρ = 0.02 kg/m3) is shown. Scatter results
from the encounter geometry failing to sample the peak pressure drop, peak wind speed, or both.
Fig. 6. Scatter plot of full width half-maximum duration versus recorded pressure drop.
The majority of events, and all the largest ones (>5 Pa) are less than 15 s long.
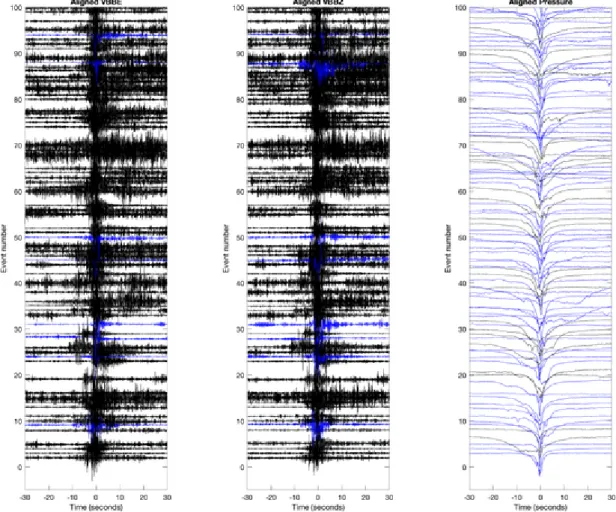
(Lognonné et al., 2019), as illustrated by Banerdt et al., 2020, Lognonné et al., 2020. A seismic signal is therefore a typical feature of many vortex encounters, although the waveforms of dust devils on SEIS SEIS Raw Data: InSight Mission, 2019might differ in shape (Fig. 12).
The seismic signal compliance defines the expected ground velocity response for a given pressure fluctuation. On the vertical axis it reaches typically 3–10 × 10−7m/s/Pa at 1 Hz depending on wind. For high wind, this compliance is increasing with frequency, as the pressure wave induced deformation is sensitive to the rigidity of the top most very low rigidity layers.
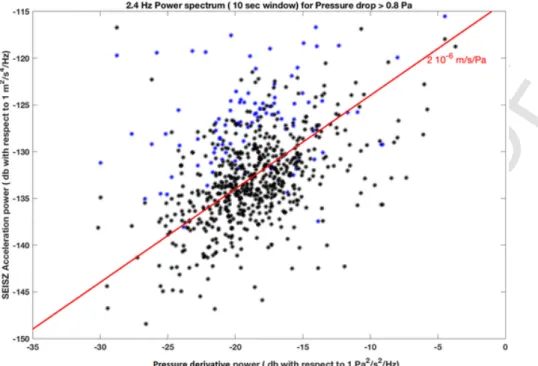
Although dust devils are mostly sources of long period, as already shown by several analysis (Kenda et al., 2020; Charalambous et al., 2020) they have significant energy remains at higher frequencies. Fig. 13 illustrates the energy at 2.4 Hz, and suggests sensitivities of about
Fig. 7. Distribution of intervals (period from one vortex detection to the next).
Fig. 8. Most vortices overall, and most of the large ones, were detected when ambient
winds were between ~7 and 13 m/s.
2 × 10⁻⁶m/s/Pa during dust devils. This is typically 2–7 times larger than at 1 Hz and is compatible with a compliance increasing with both wind and frequency. Most likely, a significant part of the SEIS noise (Stutzmann et al., 2020), including to a few Hz, is related to either dust devils resolved by the pressure sensors and possibly, at very noise level, to pressure drops or not resolved by the APSS sensor.
The maximum amplitudes of the SEIS unfiltered data (MSDS et al., 2019) as well as those at 2.4 Hz are reported in a separate supplemen-tary data file to the catalog, when SEIS fast channels (10 sps or 20 sps) were available.
4. Conclusions
A catalog of vortex encounters has been presented, and has a range of applications both as an index to choose events for further study, and for statistical assessment of the population overall. The summary val-ues in the catalog suggest asymmetric pressure profiles are somewhat common, with slower attack than decay slopes about twice as common, presumably due the asymmetry in the vortex induced by its advection.
UNCORRECTED
PROOF
Fig. 9. Wind azimuths prior to each event in the catalog. These likely reflect simply thepreponderance of ambient wind directions during periods that favor vortex formation, not any preferential vortex formation rate as a function of wind direction.
Fig. 10. The skewness of the pressure profiles (attack timescale divided by decay). It is
seen that most events have slower attack than decay. Note that the total number of points shown is less than the full catalog size, as only those entries with valid wind speeds are useful here.
As expected, vortices are a prominent feature of the seismometer back-ground signals.
Uncited references Banfield et al., 2019
SEIS Raw Data: InSight Mission, 2019 Declaration of Competing Interest
None.
Fig. 11. Relation of vortex intensity and the max-min air temperature range during the
associated record.
Acknowledgements
This is InSight contribution number ICN 174. RL acknowledges the support of the NASA InSight Participating Scientist program via grant 80NSSC18K1626. French co-authors acknowledge support from Cen-tre Nationale d'Études Spatiales (CNES) and Agence Nationale de la Recherche (ANR). CEN acknowledges the support of the NASA InSight Participating Scientist program via grant 80NSSC18K1630. We thank Daniel Viudez Moreiras and Sara Navarro for their work on and expla-nations of the TWINS wind data.
Appendix A. Appendix
The catalog has two elements: an ASCII table, and a zipped archive of TIFF images, comprising plots like Figs. 1-3 showing the details of each event. The two archive elements will be archived on the PDS: to per-mit community utilization pending the archival documentation and peer review phases, they are made available at the Applied Physics Labora-tory Space data reposiLabora-tory http://lib.jhuapl.edu/papers/the-dust-devils-of-elysium-vortex-catalog-and-mete/
After unzipping the archive it is easy to browse the collection of events. Detailed examination of individual events (identified in the table or via the images) can be performed by retrieval of the original APSS datafiles for the relevant Sol, archived at the PDS.
The catalog table comprises 21 columns, with entries as follows. Number – this is the ordinal number in this catalog. There is a close, but not perfect, correspondence with Spiga's pressure drop list (Spiga et al., 2020), in that where incomplete wind data or other issues led to processing errors in catalog generation, those events were rejected. Only a handful of such eliminations were necessary – in this respect we estimate the catalog is >98% complete with respect to possible pres-sure-only detections. Taking instrument anomalies and operating sched-ule (e.g. no operations in the first few days after landing) into account, the overall completeness is certainly >95%. The catalog numbers are ordinal in time (i.e. a lower number always preceded a higher number).
Sol – The InSight Sol number on which the event was observed. LTST – Local True Solar Time, computed by using the position of the Sun and the landing site and recorded in the APSS files. Note that
UNCORRECTED
PROOF
Fig. 12. Example of Dust Devils signals recorded on the VBB or Pressure sensor at 10 sps (blue) or at 20 sps (black). Signals are normalized with respect to their maximum. The 100 largest
pressure drop signals are shown, when acquired on the 10 or 20 sps channels. Note that some signals listed in the catalog are missing, when acquired only on 2 sps. This illustrates the variety of signal detected on the SEIS, even for relatively similar pressure drop long period shapes. Left is east component. Middle is vertical component and right is the pressure time series. VBBE and VBBZ are in acceleration. (For interpretation of the references to colour in this figure legend, the reader is referred to the web version of this article.)
this time is the start of the record plotted in the browse image (i.e. ap-proximately one minute before the peak pressure drop).
DP – The peak pressure drop in Pa.
Wmax - The maximum wind speed (m/s) recorded by either sensor during the record.
Wbef - The mean wind speed (m/s) in the 20 s at the start of the record (the higher of the Plus and Minus wind sensor means is recorded).
Waft – The mean wind speed (m/s)in the 20 s at the end of the record (the higher of the Plus and Minus wind sensor means is recorded).
Wazim - The mean wind direction (degrees from North) in the first 20s of the record (i.e. before the vortex arrival).
Wvalid - Number of valid Plus wind measurements during the record. Atck The interval in seconds between when the pressure drop ex-ceeds 35% of its maximum value and when it reaches the maximum.
Dcay - The interval (s) etween the maximum pressure drop and when it relaxes back to less than 35% of maximum.
Wid - The duration of the pressure excursion in seconds that is more than 50% of the peak amplitude (i.e. the full width half maximum.)
Solar - The hard-tied solar array current in amps during the event (see Lorenz et al., 2020).
NSolar - The number of valid solar flux datapoints during the record. Sdip - The percentage drop in solar flux associated with the dust devil. In the Sol 0–390 catalog this field is zero as there is insufficient data to estimate.
MinT1 - The minimum reading of the −Y wind sensor atmospheric temperatures during the record. The +Y wind sensor typically shows similar behavior during an encounter, but there is often an appreciable difference between the two, due to the wind-dependent perturbations of each by the warm lander deck and solar panels, so only one sensor (−Y) is included in this catalog.
MaxT1 - The maximum reading of the −Y atmospheric temperatures during the event.
Press - The average absolute pressure value (Pa) during the event. This allows the ambient density to be calculated.
Ls – The solar longitude of the event.
LMST The local mean solar time at the start of the record. UTC The Universal Time at the start of the record.
Because the seismic amplitudes, from the two seismic instruments at often different sample rates, are only recovered for about a quarter of the pressure events in the catalog, the data shown in Fig. 13 are pro-vided in a file separate from the main catalog.
UNCORRECTED
PROOF
Fig. 13. Power spectrum amplitudes on the SEISZ as function of the Power spectrum of the pressure derivative for the dust devils reported in the catalog at 2.4 Hz. Black stars are those
from VBBZ while blue stars are those from SPZ when the VBBZ was not operating and therefore prior the wind and thermal shield (WTS) deployment. Spectra are computed on 10 s windows and the amplitudes shown correspond to the maximum amplitude which occurs at the reported time of the dust devil. Sensitivity of 2 × 10⁻⁶m/s/Pa is indicated with red line.
The larger SP measurements are likely related to additional direct wind effects on the SEIS Sensor assembly, prior to its protection by the WTS. (For interpretation of the references to colour in this figure legend, the reader is referred to the web version of this article.)
References
Lognonné, P., Banerdt, W.B., Pike, W.T., Giardini, D., Christensen, U., Garcia, R.F., Kawamura, T., Kedar, S., Knapmeyer-Endrun, B., Margerin, L., Nimmo, F., Panning, M., Tauzin, B., Scholz, J.-R., Antonangeli, D., Barkaoui, S., Beucler, E., Bissig, F., Brinkman, N., Calvet, M., Ceylan, S., Charalambous, C., Davis, P., van Driel, M., Drilleau, M., Fayon, L., Joshi, R., Kenda, B., Khan, A., Knapmeyer, M., Lekic, V., McClean, J., Mimoun, D., Murdoch, N., Pan, L., Perrin, C., Pinot, B., Pou, L., Menina, S., Rodriguez, S., Schmelzbach, C., Schmerr, N., Sollberger, D., Spiga, A., Stähler, S., Stott, A., Stutzmann, E., Tharimena, S., Widmer-Schnidrig, R., Andersson, F., Ansan, V., Beghein, C., Böse, M., Bozdag, E., Clinton, J., Daubar, I., Delage, P., Fuji, N., Golombek, M., Grott, M., Horleston, A., Hurst, K., Irving, J., Jacob, A., Knollenberg, J., Krasner, S., Krause, C., Lorenz, R., Michaut, C., Myhill, B., Nissen-Meyer, T., ten Pierick, J., Plesa, A.-C., Quantin-Nataf, C., Robertsson, J., Rochas, L., Schimmel, M., Smrekar, S., Spohn, T., Teanby, N., Tromp, J., Vallade, J., Verdier, N., Vrettos, C., Weber, R., Banfield, D., Barrett, E., Bierwirth, M., Calcutt, S., Compaire, N., Johnson, C., Mance, D., Euchner, F., Kerjean, L., Mainsant, G., Mocquet, A., Manfredi, J. Antonio Rodriguez, Pont, G., Laudet, P., Nebut, T., de Raucourt, S., Robert, O., Russell, C.T., Sylvestre-Baron, A., Tillier, S., Warren, T., Wieczorek, M., Yana, C., Zweifel, P., 2020. Constraints on the shallow elastic and anelastic structure of Mars from InSight seismic data. Nat. Geosci. in press. doi:10.1038/s41561-020-0536-y.
Banfield, D., Rodriguez-Manfredi, J.A., Russell, C.T., Rowe, K.M., Leneman, D., Lai, H.R., Cruce, P.R., Means, J.D., Johnson, C.L., Mittelholz, A., Joy, S.P., 2019. Insight auxiliary payload sensor suite (apss). Space Sci. Rev. 215 (1), 4. doi:10.1007/ s11214-018-0570-x.
Banfield, D., Spiga, A., Newman, C., Forget, F., Lemmon, M., Lorenz, R., Murdoch, N., Viudez-Moreiras, D., Pla-Garcia, J., Garcia, R.F., Lognonné, P., Perrin, C., Martire, L., Teanby, N., Maki, J., Kenda, B., Mueller, N., Rodriguez, S., Kawamura, T., McClean, J., Stott, A., Charalambous, C., Millour, E., Johnson, C., Mittelholz, A., Clinton, J., Stähler, S., Giardini, D., Warren, T., Pike, T., Daubar, I., Golombek, M., Rolland, L., Widmer Schnidrig, R., Mimoun, D., Beucler, E., Lucas, A., Baker, M., Ansan, V., Karatekin, O., Lewis, S., Hurst, K., Mora Sotomayor, L., Navarro, S., Torres, J., Lepinette, A., Molina, A., Marin Jimenez, M., Gomez-Elvira, J., Peinado, V., Rodriguez-Manfredi, J.-A., Carcich, B., Sackett, S., Russell, C., Spohn, T., Smrekar, S., Banerdt, W.B., 2020. The atmosphere of Mars as observed by InSight. Nat. Geosci.. doi:10.1038/s41561-020-0534-0.
Cantor, B.A., Kanak, K.M., Edgett, K.S., 2006. Mars orbiter camera observations of Martian dust devils and their tracks (September 1997 to January 2006) and evaluation of theoretical vortex models. J. Geophys. Res. Planets 111 (E12). doi:10.1029/ 2006JE002700.
Charalambous, C., McClean, J., Baker, M.M., Pike, T., Golombek, M.P., Lemmon, M.T., et al., 2020a. Aeolian changes at the Insight landing site on mars: multi-instrument observations. Earth Space Sci. Open Arch. 17. doi:10.1002/essoar.10503003.1. Charalambous, C., Stott, A.E., Pike, T., McClean, J., Warren, T., Spiga, A., Banfield, D.,
Garcia, R.F., Clinton, J., Stähler, S.C., López, S. Navarro, Lognonné, P., Kawamura, T., van Driel, M., Böse, M., Ceylan, S., Khan, A., Horleston, A.C., Orhand-Mainsant,
G., Sotomayor, L. Mora, Murdoch, N., Giardini, D., 2020b. A comodulation analysis of atmospheric energy injection into the ground motion at InSight, mars. Earth Space Sci. Open Arch. 48. doi:10.1002/essoar.10503206.1.
Ellehoj, M.D., Gunnlaugsson, H.P., Taylor, P.A., Kahanpää, H., Bean, K.M., Cantor, B.A., Gheynani, B.T., Drube, L., Fisher, D., Harri, A.M., Holstein-Rathlou, C., 2010. Convective vortices and dust devils at the Phoenix Mars mission landing site. J. Geophys. Res. Planets 115 (E4). doi:10.1029/2009JE003413.
Holstein-Rathlou, C., Gunnlaugsson, H.P., Merrison, J.P., Bean, K.M., Cantor, B.A., Davis, J.A., Davy, R., Drake, N.B., Ellehoj, M.D., Goetz, W., Hviid, S.F., 2010. Winds at the Phoenix landing site. J. Geophys. Res. Planets 115 (E5). doi:10.1029/2009JE003411. Jackson, B., Lorenz, R., Davis, K., 2018. A framework for relating the structures and recovery statistics in pressure time-series surveys for dust devils. Icarus 299, 166–174. Kahre, M.A., Murphy, J.R., Haberle, R.M., 2006. Modeling the Martian dust cycle and surface dust reservoirs with the NASA Ames general circulation model. J. Geophys. Res. Planets 111 (E6). doi:10.1029/2005JE002588.
Kenda, B., P.Lognonné, A.Spiga, T.Kawamura, S.Kedar, W. Bruce Banerdt, R.Lorenz, Mod-eling of ground deformation and shallow surface waves generated by Martian dust, devils and perspectives for near-surface structure inversion, Space Sci. Rev., 211, 501–524, Doi:https://doi.org/10.1007/s11214-017-0378-0, 2017.
Kenda, B., Drilleau, M., Garcia, R.F., Kawamura, T., Murdoch, N., Compaire, N., et al., 2020. Subsurface structure at the InSight landing site from compliance measurements by seismic and meteorological experiments. J. Geophys. Res. Planets 125, e2020JE006387. doi:10.1029/2020JE006387.
Kinch, K.M., et al., 2015. Dust deposition on the decks of the Mars exploration rovers: 10 years of dust dynamics on the panoramic camera calibration targets. Earth Space Sci. 2 (5), 144–172.
Kurgansky, M.V., 2006. Steady-state properties and statistical distribution of atmospheric dust devils. Geophys. Res. Lett. 33 (19), 2006GL026142.
Lognonné, P., Banerdt, W.B., Giardini, D., et al., 2019. SEIS: Insight’s seismic experiment for internal structure of Mars. Space Sci. Rev. 215 (12). doi:10.1007/ s11214-018-0574-6.
Lorenz, R.D., 2009. Power law of dust devil diameters on earth and Mars. Icarus 203, 683–684.
Lorenz, R.D., 2011. On the statistical distribution of dust devil diameters. Icarus 215, 381–390.
Lorenz, R.D., 2013. The longevity and aspect ratio of dust devils: effects on detection efficiencies and comparison of landed and orbital imaging at Mars. Icarus 226, 964–970.
Lorenz, R.D., 2016. Heuristic estimation of dust devil vortex parameters and trajectories from single-station meteorological observations: application to InSight at Mars. Icarus 271, 326–337.
Lorenz, R.D., Jackson, B.K., 2015. Dust devils and dustless vortices on a desert playa observed with surface pressure and solar flux logging. GeoResJ 5, 1–11.
Lorenz, R.D., Jackson, B.K., 2016. Dust devil populations and statistics. Space Sci. Rev. 203, 277–297. doi:10.1007/s11214-016-0277-9.
Lorenz, R.D., Kedar, S., Murdoch, N., Lognonné, P., Kawamura, T., Mimoun, D., Banerdt, W.B., 2015. Seismometer detection of dust devil vortices by ground tilt. Bull. Seismol. Soc. Am. 105, 3015–3023. doi:10.1785/0120150133.
UNCORRECTED
PROOF
Lorenz, R.D., Lemmon, M.T., Maki, J., Banfield, D., Spiga, A., Charalambous, C., Barrett, E., Herman, J.A., White, B.T., Pasco, S., Banerdt, W.B., 2020. Scientific observations with the InSight solar arrays: dust, clouds and eclipses on Mars. Earth Space Sci.. doi:10.1029/2019EA000992.
Lorenz, Ralph, Reiss, Dennis, 2015. Solar Panel Clearing Events, Dust Devil Tracks, and in-situ Vortex Detections on Mars. Icarus 248, 162–164.
Murdoch, N., Kenda, B., Kawamura, T., Spiga, A., Lognonné, P., Mimoun, D., Banerdt, W.B., 2017. Estimations of the seismic pressure noise on Mars determined from Large Eddy Simulations and demonstration of pressure decorrelation techniques for the InSight mission. Space Sci. Rev. 211, 457–483. doi:10.1007/s11214-017-0343-y. Murphy, J.R., Nelli, S., 2002. Mars Pathfinder convective vortices: frequency of
occurrence. Geophys. Res. Lett. 29 (23), 18–21.
Ordóñez-Etxeberria, I., Hueso, R., Sánchez-Lavega, A., 2020. Strong increase in dust devil activity at Gale crater on the third year of the MSL mission and suppression during the 2018 global dust storm. Icarus 113814.
Perrin, C., Rodriguez, S., Jacob, A., Lucas, A., Spiga, A., Kawamura, T., Murdoch, N., Pan, L., Lorenz, R., Daubar, I.J., Lognonne, P., Banfield, D., Banks, M.E., Garcia, R.F., Newman, C., Ohja, L., Widmer-Schnidrig, R., Banerdt, W.B., 2020. Monitoring of dust devil tracks around the InSight landing site, mars, and comparison with in-situ atmospheric data. Geophys. Res. Lett. 47 (10), e2020GL087234. doi:10.1029/ 2020GL087234.
Rafkin, S., Jemmett-Smith, B., Fenton, L., Ito, J., Lorenz, R., Tyler, D., 2016. Dust devil formation. Space Sci. Rev. 203, 187–207.
Reiss, D., Lorenz, R., 2016. Dust devil track survey at Elysium Planitia, Mars: implications for the InSight landing sites. Icarus 266, 315–330.
SEIS Raw Data: InSight Mission, 2019. InSight Mars SEIS Data Service, IPGP, JPL, CNES, ETHZ, ICL, MPS, ISAE-Supaero, LPG, MSFC. doi:10.18715/SEIS.INSIGHT.XB_2016.
Sinclair, P.C., 1973. The lower structure of dust devils. J. Atmos. Sci. 30 (8), 1599–1619. Baker, M, Newman, C, Charalambous, C, et al., 2020. Evidence for vortex-dominated
aeolian activity at InSight’s landing site. JGR-Planets. Submitted for publication. Banerdt, W.B., Smrekar, S., Banfield, D., Giardini, D., Golombek, M., Johnson, C.,
Lognonné, P., Spiga, A., Spohn, T., Stähler, S., Antonangeli, D., Asmar, S., Beghein, C., Bowles, N., Bozdag, E., Chi, P., Christensen, U., Clinton, J., Collins, G., Daubar, I., Dehant, V., Fillingim, M., Folkner, B., Garcia, R., Garvin, J., Grant, J., Grott, M., Grygorczuk, J., Hudson, T., Irving, J., Khan, A., Kargl, G., Kawamura, T., Kedar, S., King, S., Knapmeyer-Endrun, B., Knapmeyer, M., Lemmon, M., Lorenz, R., Maki, J., Margerin, L., McLennan, S., Michaut, C., Mimoun, D., Mittelholz, A., Mocquet, A., Morgan, P., Mueller, N., Nagihara, S., Newman, C., Nimmo, F., Panning, M., Pike, T., Plesa, A.-C., Rodriguez-Manfredi, J.-A., Russell, C., Schmerr, N., Siegler, M., Stanley, S., Teanby, N., Tromp, J., van Driel, M., Warner, N., Weber, R., Wieczorek, M., 2020. Early results from the InSight mission: mission overview and global seismic activity. Nat. Geosci.. doi:10.1038/s41561-020-0544-y.
A. Spiga et al.https://arxiv.org/abs/2005.011342020
Stutzmann, E., Schimmel, M., Lognonné, P., Horleston, A.C., Ceylan, S., van Driel, M., Stähler, S.C., Banerdt, W.B., Calvet, M., Charalambous, C., Charalambous, C., Clinton, J., Drilleau, M., Fayon, L., Garcia, R.F., Giardini, D., Hurst, K., Jacob, A., Kawamura, T., Margerin, L., Murdoch, N., Pike, T., Scholz, J.-R., Spiga, A., 2020. Polarized ambient noise on mars. Earth Space Sci. Open Arch. 41. doi:10.1002/ essoar.10503376.1.
Vicente-Retortillo, Á., Martínez, G.M., Renno, N., Newman, C.E., Ordonez-Etxeberria, I., Lemmon, M.T., Richardson, M.I., Hueso, R., Sánchez-Lavega, A., 2018. Seasonal deposition and lifting of dust on mars as observed by the Curiosity rover. Sci. Rep. 8 (1), 1–8. doi:10.1038/s41598-018-35946-8.