HAL Id: halshs-00487175
https://halshs.archives-ouvertes.fr/halshs-00487175v3
Submitted on 4 Jul 2011HAL is a multi-disciplinary open access
archive for the deposit and dissemination of sci-entific research documents, whether they are pub-lished or not. The documents may come from teaching and research institutions in France or abroad, or from public or private research centers.
L’archive ouverte pluridisciplinaire HAL, est destinée au dépôt et à la diffusion de documents scientifiques de niveau recherche, publiés ou non, émanant des établissements d’enseignement et de recherche français ou étrangers, des laboratoires publics ou privés.
Actuarial risk assessment of expected fatalities
attributable to carbon capture and storage in 2050
Minh Ha-Duong, Rodica Loisel
To cite this version:
Minh Ha-Duong, Rodica Loisel. Actuarial risk assessment of expected fatalities attributable to carbon capture and storage in 2050. International Journal of Greenhouse Gas Control, Elsevier, 2011, 5, pp.1346-1358. �10.1016/j.ijggc.2011.07.004�. �halshs-00487175v3�
Wedge
(c) 2008-2011. Minh Ha-Duong. Rodica Loisel. CIRED Reproduction allowed. share alike. attribution.
Blue cells: Numerical assumptions defining the scenario
1 Gt C emissions avoided 20% Energy penalty = p
3,67 Gt CO2 emissions avoided A 90% Capture efficiency = e
4,17 Gt CO2 baseline B =A / a 5,00 Gt CO2 generated G = g B 4,50 Gt CO2 stored S = s B
Carbon dioxide emissions and coal types 2,38 t CO2 generated by t of coal (bituminous grade)
Coal Types
CO2 emissions
2050 2,101 Gt of coal consumed in 2050 kgCO2/MJ
2025 0,879 Lignite 9,3 27,6 0,10 0,93
2015 0,391 Sub bituminous 18,1 26,2 0,10 1,72
2007 Bituminous 25,4 25,8 0,09 2,38
1500 Total number of capture sites in our Wedge scenario.
5 10
7500 15000 Workers on capture sites
Coal CO2
15% 10% Fraction shipped
0,32 0,45 Quantity shipped, Gt in 2050
4500 5000 Average trip, Nm
Electronic supplement to the manuscript « Expected fatalities for one wedge of CCS in 2050 »
Defines the « wedge of CCS at baseload coal power plants » scenario and summarizes its expected fatalities
Scenario parameters : Coal needed for the wedge of CSC at baseload coal plants
Source: http://www.ccsd.biz/PSE_Handbook/5/3/ Specific Energy(a) MJ/kg Carbon Content (b) gC/MJ kgCO2/kg coal
a) IEA Coal online b) IPCC 1996 Scenario parameters : Capture
Workers exposed to the risk at each capture site. Range representing « a fraction of the workforce of a modern coal power plant ».
Scenario parameters : Shipping
Reference plant
With CCS plant
Baseline CO2 emissions B
CO2 generated G = (1+p) B
CO2 captured and stored S = e G = e (1+p) B CO2 avoided A = S - p B = (e (1+p) – p) B
Energy penalty
Wedge
90% Fraction pipelined (= not shipped)
Year km Mt 2007 1 3 2015 50 15 2025 100 190 2050 100 4050 Mt kt CO2/yr
Year Sites Wells Wells/site Injection Inject/well
15000 Injection wells 2007 3 12 4 3 250
500 Storage sites 2015 15 50 3,33 15 300
90% onshore 2025 50 667 13,33 200 300
450 Onshore storage sites 2050 500 15000 30 4500 300
30 Active injection wells at each site 0,30 Mt injected per well
10 30 Full time workers per site for operation, monitoring, development, maintenance...
5000 15000 Workers on injection sites
25 100 km² footprint of a storage site
20 20 Inhabitants / km² over storage sites
500 2000 Inhabitants in the footprint zone
225000 900000 Persons exposed to storage sites, worldwide
Scenario parameters : Pipeline CO2
Scenario parameters : Injection and storage
Wedge
Mathematical note on CCS and CO2 accounting
Graphically explained by the figure below, based on Figure RID 2 in IPCC SRCCS The baseline is defined as the nominal capacity of the reference coal plant, without CCS Knowing e and p, we have:
120% Generation relative to baseline g = 1 + p
108% Fraction captured (and stored) compared to baseline s = e g = e (1 + p) 88% Fraction avoided compared to baseline a = s – p = e (1 + p) – p
Reference plant
With CCS plant
Baseline CO2 emissions B
CO2 generated G = (1+p) B
CO2 captured and stored S = e G = e (1+p) B CO2 avoided A = S - p B = (e (1+p) – p) B
Energy penalty
Mining
This spreadsheet computes global expected fatalities in the mining industry due to the fact that CCS allows the use of coal. (c) 2008-2011. Minh Ha-Duong. Rodica Loisel. CIRED Reproduction allowed. share alike. attribution. Historical stats for the US coal mining industry
Source (a) Source (a) Source (b) =D/E '=ln(F) Smooth trendOLS estimation of log (fatalities/production)
t Year Miners Fatalities Coal_Prod_Mt FAR_US log_FAR_US a + b t + c t²
1 1900 448,58 1489 268 5,55 1,71 1,86 const 1,8741 a 2 1901 485,54 1574 292 5,40 1,69 1,85 time -0,0116 b 3 1902 518,2 1724 300 5,74 1,75 1,84 timesq -0,0004 c 4 1903 566,26 1926 356 5,42 1,69 1,82 5 1904 593,69 1995 350 5,70 1,74 1,81 6 1905 626,05 2232 391 5,71 1,74 1,79 34 1933 523,18 1064 383 2,78 1,02 1 35 1934 566,43 1226 417 2,94 1,08 0,96 45 1944 453,94 1298 683 1,90 0,64 0,52 86 1985 197,05 68 884 0,08 -2,56 -2,17 87 1986 185,17 89 890 0,10 -2,3 -2,25 88 1987 172,78 63 919 0,0686 -2,68 -2,33 89 1988 166,28 53 946 0,06 -2,88 -2,42 90 1989 164,93 68 981 0,07 -2,67 -2,5 93 1992 153,13 55 998 0,06 -2,9 -2,76 106 2005 116,44 23 1131 0,02 -3,9 -3,98 107 2006 122,98 47 1055 0,04 -3,11 -4,08 108 2007 122,94 34 1039 0,03 -3,42 -4,18
The global coal industry in: 2007
Fatalities 11000 Source: Drexler et al. (2008) ICEM report on research, activities and developments, page 20
Production (Mt) 6691,05
F/C 1,64 This is the global fatality rate today
ln (F/C) 0,497
time index 45,42 (Positive t solution of ln(F/C) = a + b t +c t²) (the other root is: -73,73 )
1944 Year in which USA was at this fatality rate
Electronic supplement to the manuscript « Expected fatalities for one wedge of CCS in 2050 »
Source (a) http://www.msha.gov/stats/centurystats/coalstats.asp
Source (b) http://www.eia.doe.gov/cneaf/coal/page/fig1_us_historical_production_bar_chart.xls Source: http://www.iea.org/Textbase/stats/coaldata.asp?COUNTRY_CODE=29&Submit=Submit 1900 1915 1930 1945 1960 1975 1990 2005 -5 -4 -3 -2 -1 0 1
2 log (Fatalities / Coal production)Smooth trend '=ln(F)
Mining
Extrapolation of the global average coal mining fatality rate to 2050
Assumption (A): The global coal industry fatality rate per Mt converges to the rate recorded in the USA, averaged over 1990-2007
F/C 0,0383
Assumption (B): The global coal industry fatality rate per Mt declines along the same historical curve as the USA
Target year: 2050
Years later: 43
Time index 88,42
1987 Year for which we lookup the USA fatality rate
Adjusted value -2,37 The log fatality rate at this time index, using the smoothed curve
F/C 0,09351 The result: global coal mining industry fatality rate for 2050
Coal mined Fatality rate Expected fatalities
Gt (scenario) per Mt mined In 2050
2,1 0,0383 81 Convergence to USA 1990-2007
2,1 0,0935 196 Safety progress follows the USA curve
Engineering consistency check about the incremental quantity of coal
According to engineer Nhan T. Nguyen (pers. Com.) for a future (2021) High Efficiency (45%) IGCC power plant
500 MW coal-based power plant needs 1,08 Mt bituminous coal
Proportionality suggests that
800 GW that correspond to one CCS wedge would need 1731,2 Mt bituminous coal
According to the table above, this would emit 4,12 Gt CO2
Another view 920 kg CO2 / Mwh in 1997, Annex II countries
8760 h/yr
8059200 kg CO2 / MW / yr for a baseload plant 500 MW plant capacity
4,03E+006 t CO2/yr (divide by 1000 for kg to t) A 500MW average plant emits 4 Mt CO2 per year
Summary results table : expected fatalities from coal mining
(source : Marion et al. CONTROLLING POWER PLANT CO2 EMISSIONS: A LONG RANGE VIEW)
Shipping coal
This spreadsheet provides evidence to support the coal shipping scenario assumptions (see Shipping CO2 sheet for fatalities estimates). (c) 2008-2011. Minh Ha-Duong. Rodica Loisel. CIRED Reproduction allowed. share alike. attribution.
Total global production (Mt)
Hard coal Brown coal/Lignite
2008e 5848 951 Approx. 13% of hard coal production (717 Mt) is used by the steel industry
2007 5442 956 2006 5205 914 2005 4934 906 2004 4629 879 2003 4231 893 1996 3734 1990 3489 1981 2796 1980 2805
International Hard Coal Trade (Mt)
Steam Coking Total Trade Share of trade By ship
2008 676 262 938 16% 2007 670 247 917 17% 2006 593 222 815 16% 15% 2005 548 227 775 16% 14% 2004 541 188 609 13% 15% 2000 421 187 608 14%
1996 318 196 513 In the scenario, we assume that 15% of coal used will be shipped
1995 297 196 494
1990 299 199 898
Electronic supplement to the manuscript « Expected fatalities for one wedge of CCS in 2050 »
How much coal is shipped in international trade ?
Source: http://www.worldcoal.org/resources/coal-statistics/
Shipping coal
Development of seaborne trade (Mt)
Steam coal Coking coal
Atlantic Pacific Atlantic Pacific Total Mt billion ton milesaverage trip (miles)
2006 240 330 72 129 771 3540 4591 2005 219 289 72 129 709 3113 4391 2004 210 274 67 123 674 2960 4392 2000 157 187 70 98 512 2509 4900 1996 125 139 70 103 437 1995 120 129 68 103 420 1994 108 111 66 98 383 1986 74 59 61 81 275 1985 76 55 61 83 275 1984 66 39 56 79 240
Over 1986-2006, seaborne steam coal trade has increased on average by about 7.5% p.a. In the scenario, we assume that average trip will be 4500 miles
World seaborne trade in ton-miles, selected years (billions of ton-miles)
Oil
Year Crude Products Iron ore Coal Grain World total
1970 5597 890 6487 1093 481 475 2049 2118 10654 1980 8385 1020 9405 1613 952 1087 3652 3720 16777 1990 6261 1029 7290 1978 1849 1073 5259 3891 16440 2000 8180 1319 9499 2545 2509 1244 6638 6790 22927 2001 8074 1345 9419 2575 2552 1322 6782 6930 23131 2002 7848 1394 9898 2731 2549 1241 6879 7395 23516 2003 8390 1460 9850 3035 2810 1273 7118 7810 25124 2004 8795 1545 10340 3444 2960 1350 9521 8335 26814 2005 8875 1652 10527 3918 3113 1686 9119 8730 28376 2006 8983 1758 10741 4192 3540 1822 9976 9341 30058 2007 9214 1870 11084 4544 3778 1927 10676 9665 31425 2008 9300 1992 11292 4849 3905 2029 11209 10245 32746
Activity level Fatality rate Fatalities
Tt Nm in 2050
1,42 2,9 4,2 Extrapolated from tanking
1,42 10,9 15,5 Extrapolated from all goods trade How far is coal shipped ?
Source SSY - www.ssyonline.com
Source: Table 5 in UNCTAD. Review of Maritime Transport 2009. (link)
Crude plus
products 5 main dry bulks Other dry cargoes
Trains
This spreadsheet provides evidence to support the coal railr transport scenario assumptions
(c) 2008-2011. Minh Ha-Duong. Rodica Loisel. CIRED Reproduction allowed. share alike. attribution.
2,101 Gt of coal (lignite) consumed in 2050 85% Fraction transported by train
1,79 Gt transported by train 10000 t of coal per unit train
number of train trips 119 train trips per power plant per year
500 km, average trip In USA, average distance shipped per ton of coal, grew from about 430 miles in 1979 to about 700 miles in 1997.
8,93E+07 Train km In China, average coal transportation distance increased from about 400 km in 1978 to about 600 km in 2008.
5,55E+07 Train miles
Railroad accident statistics in the US
Class I RAILROADS Accident/Incident overview
2001 2002 2003 2004 2005 2006 2007 2008 2009 2010 9502 8435 8345 8585 8336 7888 7573 6940 5482 5390 Total fatalities 629 639 590 613 577 622 546 505 412 460 15 15 13 18 18 8 10 15 12 9 327 356 345 318 300 362 305 291 250 275 277 251 223 264 241 246 220 195 140 171 44% 39% 38% 43% 42% 40% 40% 39% 34% 37%
Train miles 5,4E+8 5,5E+8 5,6E+8 5,8E+8 6,0E+8 6,1E+8 5,9E+8 5,8E+8 4,8E+8 5,1E+8
a/i rate 17,7 15,3 14,8 14,7 13,9 12,8 12,8 12,0 11,5 10,5
0,56 0,51 0,44 0,51 0,46 0,42 0,41 0,37 0,34 0,36
0,91 0,83 0,7 0,81 0,74 0,68 0,65 0,59 0,55 0,58
Previous decades had higher rates.
Railroad accident statistics in Europe
In 2004, EU-25
The number of fatalities per million train-kilometers
Electronic supplement to the manuscript « Expected fatalities for one wedge of CCS in 2050 »
How much railroad activity to transport the coal in the scenario ?
In USA, a typical unit train is 100 to 120 cars long, each holding 100 to 115 (short) tons of coal. http://www.wsgs.uwyo.edu/coalweb/trains/unit.aspx
178 571
Reference: Energy Information Administration. http://www.eia.doe.gov/cneaf/coal/ctrdb/tab34.html Accessed 2011-02-03
Reference: Tu (2010) http://www.glenbradford.com/files/Stocks/Summary_China_Coal_Value_Chain_J.Tu_Draft.pdf, figure 2 page v
http://safetydata.fra.dot.gov/OfficeofSafety/publicsite/Query/tenyr1a.aspx ACCIDENTS/ INCIDENT Employee on duty deaths Trespasser deaths, not at HRC Highway-rail Xing incidents deaths
Fatality rate (per million train miles) Fatality rate (per million train km)
Trains The average was 0.92 in 2004, and 1.13 in 2005.
Simo Pasi (2006) Rail transport accidents in the European Union in 2004, Eurosta Transport, “Statistics in Focus”
Piazza, Mihm and Cassir (2006) Developing CSTs for the European Railway System
In France EPSF (2010) Rapport sur la sécurité du réseau ferré national
2006 2007 2008 2008
0,197 0,141 0,118 0,119 Serious injuries
0,193 0,173 0,163 0,159 Fatalities per million train-km (excl. Suicides)
0,024 0,020 0,020 0,018 Travelers
0,075 0,073 0,072 0,072 Level crossings users 0,087 0,062 0,068 0,066 Trespassers 0,008 0,006 0,005 0,004 Workers 0,000 0,013 0,008 0,007 Others
Normative european targets (FWSI / million train-km / year) European Railway Agency (2009) Common Safety Targets
0,08 Employees
0,74 Level crossing users ERA recommendation on the first set of Common Safety Targets as referred to in Artilce 7 of Directive 2004/49/EC
0,02 Others 2,3 Trespassers 2,51 Whole society
Share of fatalities in FWSI (fatalities and weighted serious injuries) 10 serious injury statistically equivalent to 1 fatality
In UK WSI < F for the main risks (trespass & level crossing) See also data above for France
75% Share of F in FWSI
Trespassing is a crime, we don’t attribute these fatalities to CCS but to alcohol, stupidity and depression 0,84
0,63 Fatalities per million train-km, excluding trespassers and suicides, European Common Safety target
Mkm Fatality rate Fatalities
89,3 0,63 56 2009 ECS target are realised
89,3 0,91 81 The 2001 USA risk rate applies
http://www.eds-destatis.de/en/downloads/sif/nz_06_06.pdf , FR version http://epp.eurostat.ec.europa.eu/cache/ITY_OFFPUB/KS-NZ-06-006/FR/KS-NZ-06-006-FR.PDF
IRSC 2006, Dublin http://www.intlrailsafety.com/Dublin/presentations_AM_23_Oct/03_R_Piazza_P_Mihm_C.Cassir.pps
http://www.securite-ferroviaire.fr/fr/modules/cms/fichiers/403/rapport_securite_2009.pdf
http://www.era.europa.eu/Core-Activities/Safety/Pages/common-safety-targets.aspx
http://www.era.europa.eu/Document-Register/Pages/recommendation-first-set-common-safety-targets.aspx
http://eur-lex.europa.eu/LexUriServ/LexUriServ.do?uri=OJ:L:2009:150:0011:0019:EN:PDF
http://www.rssb.co.uk/SiteCollectionDocuments/pdf/reports/strategic%20safety%20%20plan%20%2009-14.pdf
FWSI per million train-km European common target « Employees + level crossing users + other »
Capture
This spreadsheet computes global expected fatalities to capture the CO2
(c) 2008-2011. Minh Ha-Duong. Rodica Loisel. CIRED Reproduction allowed. share alike. attribution. Method 1: Industrial carbon dioxide use
120 100 Mt CO2/year Sources (a) (b) Source (c)
12 Fatalities from the two chemical accidents recordedSource (d)
1926 1997 Period 72 Years
Source (a) IPCC (2005) SRCCS main report says 115 in 7.3.4. Numbers on table 7.2 add up to 152.6 with a large uncertainty and include artificial CO2. Source (b) IPCC (2005) SRCCS Technical Summary says 120 in section 7.
Source (c) Source (d)
Journal of Loss Prevention in the Process Industry 12:361-378
Qty captured Risk rate Expected
Gt CO2 Fatalities
4,5 1,4 6,3 Accident record, low case
4,5 1,7 7,5 Accident record, high case
Method 2: Fatalities from utilities in large economies
In industrialized countries, 3 to 14 fatalities per year, per 100,000 workers can reasonably be expected.
This range is a guesstimate based on the table below, which is a descriptive statistics summary of the data to the right --->
n Min Average Max
UK 25 0 2,1 4,4 USA 4 4 5,0 6 France 31 1,7 13,0 31,9 Canada 14 10,5 14,2 19,7 Italy 16 1 3,6 7 Japan 38 0 2,8 16 China 18 6,1 16,8 27,3
Workers Fatality rate Fatalities
7500 3 0,23 Worker’s safety, low case
Electronic supplement to the manuscript « Expected fatalities for one wedge of CCS in 2050 »
Conclusion of Aresta & Tommasi (1997) Carbon dioxide utilisation in the chemical industry, Energy Convers. Mgmt, v 38:S373-S378 Khan & Abbasi (1999) Major accidents in process industries and an analysis of causes and consequences
Summary table : expected fatalities in 2050 to capture the CO2 Gt-1 a-1
Capture
Rates of fatal injuries (Raw data)
Source:
Query: By Topic / Occupational injuries - 8B. Rates of occupational injuries, by economic activity.
1969-present, for the 10 largest economies.
Row selected: Economic activity code 4 (in ISIC revision 2) or E (in ISIC revision 3), meaning Electricity, gas and water
Note: Data for Germany, India and Russia were not available or useable.
1969 1970 1971################################################################################################2004 2005 2006 2007 UK 4 ########################################## E ####################################### 0 1 ,,, ,,, USA* E ### 6 4 6 ,,, France** 4 0,136 0,231 0,207########################################################################### E ##############################,,,,,,,,,,,, ,,, ,,, ,,, Canada* E ################################# 12,8 18,4 19,7 Italy* E ####################################### 2 2 3 ,,, Japan*** 4 0,06 0,06 0,08##################################################################### E ############-########################### 0 0 0 0 China* 4 ################################################ 17,7 14,2 ,,, Brazil* E ###,,,,,,,,, ,,, ,,, ,,,
* Per 100.000 workers employed.
** Per 1000 workers employed, excluding agents of public gas and electricity services.
200Is the conversion factor to 100.000 workers employed: Assuming that 1 worker does 2000 hours, then a million hours is 500 workers employed.
Rates of fatal injury (all rows per 100.000 workers) Summary table
1969 1970 1971################################################################################################ 2004 2005 2006 n Min Max Average UK ##################################################################### 0,0 1,0 25 0 4,4 2,12 USA ### 6,0 4,0 6,0 4 4 6 5 France 13,6 23,1 20,7#################################################################################### 31 1,7 31,9 13,03 Canada ################################# 12,8 18,4 19,7 14 10,5 19,7 14,21 Italy ####################################### 2,0 2,0 3,0 16 1 7 3,63 Japan 12,0 12,0 16,0################################################################################################ 0,0 0,0 0,0 38 0 16 2,84 China ################################################ 17,7 14,2 18 6,1 27,3 16,75 Brazil ### 1 18,6 18,6 18,6
International Labor Organisation, LABORSTA database. http://laborsta.ilo.org/data_topic_E.html (accessed 2009-02-06)
Pipelines
This spreadsheets analyzes the risk of pipelines
(c) 2008-2011. Minh Ha-Duong. Rodica Loisel. CIRED Reproduction allowed. share alike. attribution.
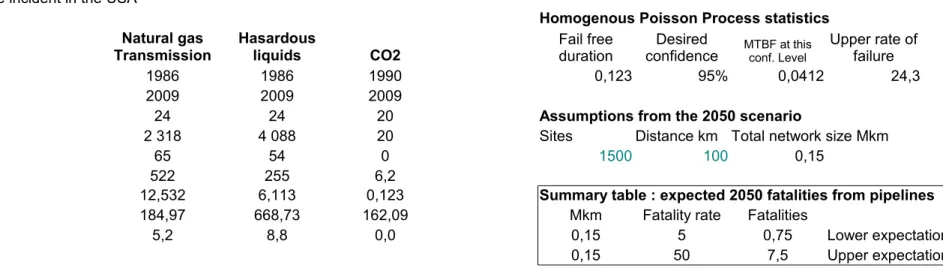
Following IPCC (2005), we consider the yearly incident rate as Number/km, not Number / Mt / km
Evidence from the US pipelines networks
Updated statistics of pipeline incident in the USA
Homogenous Poisson Process statistics CO2
Start 1986 1986 1990 0,123 95% 0,0412 24,3
End 2009 2009 2009
Duration (years) 24 24 20 Assumptions from the 2050 scenario
# significant incidents 20 Sites Distance km Total network size Mkm
# fatalities 65 54 0 1500 100 0,15
Network length (1000km) 522 255 6,2
Observation basis (Mkm yr) 12,532 6,113 0,123
Incidents /Mkm / yr 184,97 668,73 162,09 Mkm Fatality rate Fatalities
Fatalities / Mkm / yr 5,2 8,8 0,0 0,15 5 0,75 Lower expectation
0,15 50 7,5 Upper expectation
Table data sources:
The 20 significant incidents, 0 fatalities for CO2 pipes were obtained by looking up the PHMSA data files directly, see table to the right.
References interesting but not used
Dooley JJ, Dahowski RT, Davidson CL, 2008, «Comparing existing pipeline networks with the potential scale of future U.S. CO2 pipeline networks», doi:10.1016/j.egypro.2009.01.209
Note: in UK CO2 pipeline are designed similarly to natural gas transportation
Electronic supplement to the manuscript « Expected fatalities for one wedge of CCS in 2050 »
Natural gas
Transmission Hasardous liquids Fail free duration confidenceDesired MTBF at this conf. Level
Upper rate of failure
2 318 4 088
Summary table : expected 2050 fatalities from pipelines
US Department of Transportation, Office of Pipeline Safety. Natural Gas Pipeline Operators Incident Summary Statistics by Year 1/1/1986 – 12/31/2008 (accessed 2010-02-18) (link) Hazardous liquid pipeline operators accident summary statistics by year (accessed 2010-02-18) (link)
For average network length computations, see tables to the right
The ENSAD database at PSI. http://gabe.web.psi.ch/research/ra/
John Gale and John Davison (2004) Transmission of CO2—safety and economic considerations. Energy 29:1319-1328 (link)
Jo Y.D., Crowl D.A., 2008, « Individual risk analysis of high-pressure natural gas pipelines », Journal of Loss Prevention in the Process Industries, 21: 589-595. http://www.hse.gov.uk/pipelines/resources/designcodes.htm
Pipelines
In the US, are CO2 incidents more or less likely to cause fatalities ?
CO2
Fatalities / incident 0,0280 0,0132 0,0000
Incidents without fatalities (at least) 2253 4034 20
97,20% 98,68% 100,00% 90,00% 86,00%
100,00% 12,16% 4,90%
We have a run of 20 incidents without fatality.
But even if a significant CO2 incident has 10% probability of causing at least one fatality,
there is more than 10% probability that the observed run of 20 incidents without victims is just luck.
If we want the 95% confidence level, we can only say that the probability that a serious incident with a CO2 pipeline causes a fatality is less than 14%.
In other words, we do not have enough observations to compare statistically
the lethality of CO2 pipelines incidents with the lethality of other pipelines accidents.
Evidence from European networks
Ancien (a) Concawe Oil Pipelines Management Group’s Special Task Force on oil pipeline spillages (OP/STF-1), 2007, “Performance of European crosscountry oil pipelines, . Statistical summary of reported spillages in 2005 and since 1971”, Brussels.
27 Oil Pipeline in Western Europe (average from Figure 1 page 3, thousand km)
37 Period 1971 2006
14
0,0140 Fatalities per 1000 km per year
Natural gas
Transmission Hasardous liquids
The probability that an serious incident has no victim is larger than
Probability that the number of incidents in $E$37 all have No fatalities
Source (a) Concawe Report No. 7/08. Performance of European cross-country oil pipelines - statistical summary of reported spillages in 2006 and since 1971
Pipelines
Imperial-metric distance unit conversion factor
1,61 km 1 mile
Natural gas transmission pipeline annual mileage Unit: 1000 miles
Year Onshore Offshore onshore
offshore
total pipe (in Km)
1984 885 277,6 7,35 284,95 33,29 3,67 36,96 321,92 518,07 1985 952 282,75 7,72 290,46 33,73 1,74 35,47 325,93 524,54 1986 1,01 280,67 9,29 289,96 29,74 1,96 31,7 321,65 517,65 1987 963 284,24 7,62 291,86 29,65 2,48 32,13 323,99 521,41 1988 1,02 280,25 7,91 288,16 28,94 3,1 32,04 320,2 515,32 1989 1,03 279,73 8,2 287,93 29,6 2,55 32,14 320,07 515,1 1990 1,11 283,88 8,11 291,99 29,27 3,15 32,42 324,41 522,09 1991 1,21 285,3 8,57 293,86 29,01 3,7 32,71 326,58 525,57 1992 1,18 283,07 8,4 291,47 28,91 3,72 32,63 324,1 521,58 1993 1,13 285,04 8,22 293,26 28,43 3,63 32,06 325,32 523,55 1994 1,23 293,44 8,11 301,55 27,4 3,91 31,32 332,86 535,69 1995 1,27 288,85 8,1 296,95 26,67 4,26 30,93 327,88 527,67 1996 1,25 285,34 6,85 292,19 24,86 4,76 29,62 321,8 517,89 1997 1,35 287,75 6,63 294,37 28,3 6,16 34,46 328,83 529,21 1998 1,17 295,61 7,11 302,71 23,49 5,67 29,17 331,88 534,11 1999 1,18 290,1 6,02 296,11 26,36 5,92 32,28 328,39 528,49 2000 1,17 293,72 5,24 298,96 21,88 5,68 27,56 326,52 525,48
2001 1,35 284,91 5,54 290,46 17,73 3,88 21,61 312,07 502,23 Carbon dioxide systems, jan 12, 2010
2002 1,47 297,21 6,33 303,54 16,98 5,58 22,56 326,1 524,81 No of Onshore Offshore Total Total pipe
2003 1,47 295,55 6,28 301,83 16,43 6,33 22,76 324,59 522,37 records pipe (mi) (1000 km)
2004 1,43 296,86 6,24 303,22 17,27 7,41 24,73 327,95 527,78 2004 21 3408 0 3408 5,48 2005 1,48 294,68 5,86 300,66 16,03 7,37 23,4 324,06 521,53 2005 27 3718 127 3846 6,19 2006 1,49 293,61 6,7 300,46 13,1 7,33 20,43 320,89 516,42 2006 29 3827 0 3827 6,16 2007 1,45 294,73 6,2 301,17 12,57 7,12 19,7 320,86 516,38 2007 31 3884 0 3884 6,25 2008 1,48 295,22 6 301,22 12,99 7,23 20,22 321,44 517,31 2008 30 4202 0 4202 6,76 522,16 Average, 2004-2008 6,169 Source: Average 1986-2007 N° of
records transmissTotal gatheringtotal
Pipelines
Liquid Pipeline Operator Total National Mileage Database report on CO2 pipeline spills in the US.
Year Miles 1000 km
1984 153404 246,88 RPTID SIGNIFICANTTFAT COMM
1985 152859 246 20020028 YES CARBON DIOXIDE Significant incidents
1986 152489 245,41 20000144 YES CARBON DIOXIDE 6
1987 152376 245,23 19970029 YES CARBON DIOXIDE
1988 148910 239,65 19960133 YES CARBON DIOXIDE
1989 150158 241,66 19960132 YES CARBON DIOXIDE
1990 152089 244,76 19960016 YES CARBON DIOXIDE
1991 165689 266,65 20010030 NO CARBON DIOXIDE
1992 155113 249,63 19950092 NO CARBON DIOXIDE
1993 153444 246,94 19940149 NO CARBON DIOXIDE
1994 154731 249,02 19940082 NO CARBON DIOXIDE
1995 154933 249,34 19940025 NO CARBON DIOXIDE
1996 163422 263 RPTID SIGNIFICANTFATAL COMM Significant incidents
1997 156638 252,08 20090248 YES 0 CO2 14
1998 154528 248,69 20090243 YES 0 CO2
1999 158248 254,68 20090204 YES 0 CARBON DIOXIDE
2000 160900 258,94 20070207 YES 0 DRY CO2
2001 159648 256,93 20070122 YES 0 CO2
2002 161670 260,18 20070030 YES 0 CARBON DIOXIDE
2003 159512 256,71 20070063 YES 0 CARBON DIOXIDE
2004 166798 268,44 20070100 YES 0 CARBON DIOXIDE
2005 166349 267,71 20060217 YES 0 CARBON DIXOIDE
2006 166283 267,61 20050026 YES 0 CARBON DIOXIDE
2007 168036 270,43 20040283 YES 0 CARBON DIOXIDE
Average 1986-2007: 254,71 20040271 YES 0 CARBON DIOXIDE
20040243 YES 0 SOUR CARBON DIOXIDE
20080328 NO 0 CO2 20080267 NO 0 CO2 20080254 NO 0 CO2 20080228 NO 0 CO2 20080192 NO 0 CO2 20080175 NO 0 CO2 20080174 NO 0 CO2 20060291 NO 0 CARBON DIXOIDE 20060196 NO 0 CO2 20060045 NO 0 CARBON DIOXIDE 20050200 NO 0 CARBON DIOXIDE 20040244 NO 0 CO2 20030315 NO 0 CARBON DIOXIDE 20030323 NO 0 CARBON DIOXIDE 20030140 NO 0 CARBON DIOXIDE 20030064 NO 0 CARBON DIOXIDE
20030075 NO 0 CARBON DIOXIDE (CO2)
20030099 NO 0 CARBON DIOXIDE
20020418 NO 0 CARBON DIOXIDE
20020417 NO 0 CARBON DIOXIDE
20020172 NO 0 CO2
Source: PHMSA Significant Incident Data Assess database (link)
0 0 0 0 0 0 0 0 0 0 0
Shipping CO2
(c) 2008-2011. Minh Ha-Duong. Rodica Loisel. CIRED Reproduction allowed. share alike. attribution. Method 1. Oil tanking statistics: we consider the average FAR/ Mt-miles in oil trade by tankers for 1978-2001
2322 Fatalities on the period 1978-2001 from oil tanker incidents (Ranheim 2002) 24 Period duration
8258 Gt miles of oil (crude+products) shipped by tankers – average 1978-2001 (see table below) 11,7 fatality per Tt-miles-yr
Oil (crude+products) World seaborne trade in Gt-miles (Table reproduced from IMO 2005 Facts and figures p. 6, citing data from Fearnleys Review, 2004)
1970 6487 1975 9727 Weigted average 1980 9405 75-80 9566 1985 5157 80-85 7281 1990 7821 85-90 6489 2000 10265 90-00 9043 2001 10179 00-01 10222 2002 9898 78-01 8258
Method 2. Shipping/ World Trade statistics
Year Fatalities* Total trade** Fatality rate Log. Tendency
1 1989 688 16385 0,0420 0,0460 2 1990 389 17121 0,0227 0,0401 3 1991 1204 17873 0,0674 0,0367 4 1992 246 18228 0,0135 0,0342 5 1993 504 18994 0,0265 0,0323 6 1994 1552 19600 0,0792 0,0308 7 1995 419 20188 0,0208 0,0295 8 1996 710 20678 0,0343 0,0283 9 1997 257 21825 0,0118 0,0273 10 1998 566 21492 0,0263 0,0264 11 1999 439 21990 0,0200 0,0256 12 2000 373 23693 0,0157 0,0249 13 2001 317 23891 0,0133 0,0242 14 2002 1274 24172 0,0527 0,0236 15 2003 197 25844 0,0076 0,0230 16 2004 589 27635 0,0213 0,0224 Total 9724 339609 0,0286 62 2050 0,0109 Extrapolation !
Electronic supplement to the manuscript « Expected fatalities for one wedge of CCS in 2050 »
This spreadsheet computes global expected fatalities attributable to shipping CO2 in the wedge scenario
1989 1990 1991 1992 1993 1994 1995 1996 1997 1998 1999 2000 2001 2002 2003 2004 0 0,01 0,02 0,03 0,04 0,05 0,06 0,07 0,08 0,09 f(x) = -0,0085 ln(x) + 0,0460 R² = 0,1056
Fatality rate
World seaborne trade
liv e s lo s t p e r b ill io n to n n e -m ile s
Shipping CO2
Source: * Fatalities: IMO 2005 FSI.3/Circ.6. ** Total world seaborne trade (billion tonne-miles): Fearnley annual Review 2004, p.49 Analysis of the trend, for extrapolation
According to Ranheim (2002), the trend in fatalities is declining. 775 in the second 12 year half of the series, versus 1617 in the previous 12 years. However the number of tanker incidents increased again during 2002-2007, see chart, source (a).
And over 2002-2007, the table below sums up to 229 fatalities.
Chart source: (a)
Recent data (include descriptions)
Fatalities in recorded tanker incidents – all types and sizes
2008->27/5 33 2007 61 2006 40 2005 26 2004 65 2003 21 2002 16
Sources: Compiled by E. Ranheim at Intertanko, based on reports from LMIU, published at: (a)
(b) (c) (d)
Period Fatalities* Annual average
1978-1989 1617 134,75
1990-2001 775 64,58 2,09
2002-2007 229 38,17 1,69
*Ranheim (2002) The table suggests that safety improved by a factor 2 over 78-89, then by 1.7 over 90-01. We extrapolate a factor 4 over 2002-2050.
References and data sources on shipping
Shipping Fatality rate Fatalities
CO2 Tt Nm Fat/Tt Nm 2050 expected
2,25 2,9 7 Tanking, extrapolated
2,25 11 25 All goods, extrapolated
http://www.themaritimefoundation.com/templates/Page.aspx?id=44456 http://www.themaritimefoundation.com/templates/Page.aspx?id=43302 http://www.themaritimefoundation.com/templates/Page.aspx?id=44172 http://www.themaritimefoundation.com/templates/Page.aspx?id=42406
Ranheim E (2002) dans "Sécurité Maritime et protection de l'environnement" Evolution et Perspectives (Brest), p 68-77. Summary table : expected fatalities for shipping CO2 IMO (International Maritime Organization) Library Services (2005) International Shipping and World Trade. Facts and figures
IMO (2005) Casualty statistics and investigation. Very serious and serious casualties for the year 2003. FSI.3/Circ.6 – 17/3/2005. The IMO database on marine casualty and incidents (not very useful)
Fearnley annual Review 2004
For global production and productivity, see UNCTAD « Review of maritime transport » Casualties topic page on Seasearcher, Lloyd’s database.
1989 1990 1991 1992 1993 1994 1995 1996 1997 1998 1999 2000 2001 2002 2003 2004 0 0,01 0,02 0,03 0,04 0,05 0,06 0,07 0,08 0,09 f(x) = -0,0085 ln(x) + 0,0460 R² = 0,1056
Fatality rate
World seaborne trade
liv e s lo s t p e r b ill io n to n n e -m ile s
Injection
(c) 2008-2011. Minh Ha-Duong. Rodica Loisel. CIRED Reproduction allowed. share alike. attribution.
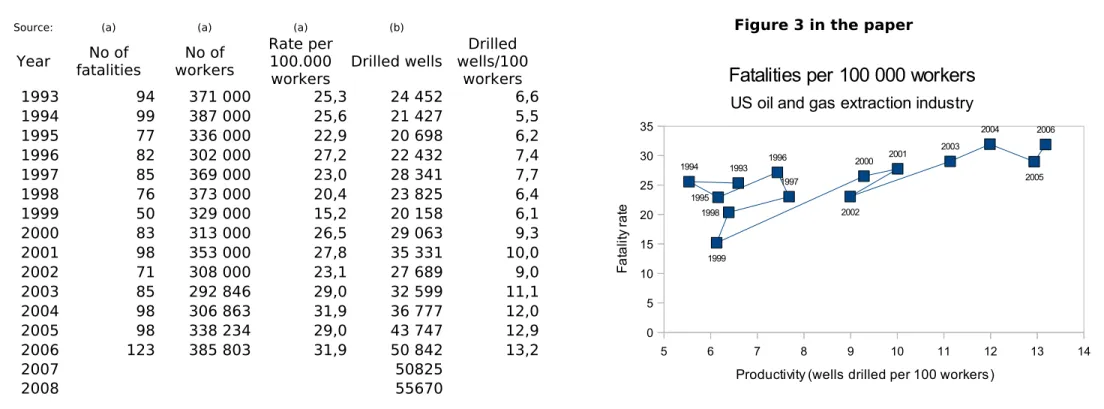
Source: (a) (a) (a) (b) Figure 3 in the paper
Year Drilled wells
1993 94 25,3 6,6 1994 99 25,6 5,5 1995 77 22,9 6,2 1996 82 27,2 7,4 1997 85 23,0 7,7 1998 76 20,4 6,4 1999 50 15,2 6,1 2000 83 26,5 9,3 2001 98 27,8 10,0 2002 71 23,1 9,0 2003 85 29,0 11,1 2004 98 31,9 12,0 2005 98 29,0 12,9 2006 123 31,9 13,2 2007 50825 2008 55670 Sources
(a) Centers for Disease Control and Prevention. 2008. Fatalities Among Oil and Gas Extraction Workers --- United States, 2003--2006. MMWR 57(16):429-431. (b) U.S. Energy Information Administration 2009. Annual Energy Review 2008. Report DOE/EIA-0364(2008)
Assumptions from the 2050 scenario
5000 15000 Workers on injection sites
Workers Fatality rate Fatalities
5000 20 1 Lower expectation
Electronic supplement to the manuscript « Expected fatalities for one wedge of CCS in 2050 »
This spreadsheet computes global expected fatalities attributable to the injection of CO2 in the wedge scenario
No of fatalities No of workers Rate per 100.000 workers Drilled wells/100 workers 371 000 24 452 387 000 21 427 336 000 20 698 302 000 22 432 369 000 28 341 373 000 23 825 329 000 20 158 313 000 29 063 353 000 35 331 308 000 27 689 292 846 32 599 306 863 36 777 338 234 43 747 385 803 50 842
Table 1, Available at http://www.cdc.gov/mmwr/preview/mmwrhtml/mm5716a3.htm
Table 4.5 Crude Oil and Natural Gas Exploratory and Development Wells, 1949-2008. Column Total, Wells drilled. Available at http://www.eia.doe.gov/emeu/aer/txt/ptb0405.html
Summary table : expected fatalities from injection
5 6 7 8 9 10 11 12 13 14 0 5 10 15 20 25 30 35 1993 1994 1995 1996 1997 1998 1999 2000 2001 2002 2003 2004 2005 2006
Fatalities per 100 000 workers
US oil and gas extraction industry
Productivity (wells drilled per 100 workers)
F a ta lit y ra te
Injection
31/12/10 31/12/09
Revenue Employees R/E Revenue Employees R/E
(million $) $ (million $) $
Schlumberger http://investorcenter.slb.com/phoenix.zhtml?c=97513&p=irol-reportsannual
Halliburton http://ir.halliburton.com/phoenix.zhtml?c=67605&p=irol-reportsAnnual
Baker Hugues http://investor.shareholder.com/bhi/annuals.cfm
Weatherford International http://annualreport.weatherford.com/
CGGVeritas http://www.cggveritas.com/default.aspx?cid=38&lang=2
Minimum Maximum
Injection per site 8,8 million ton per year
Assumed injection fee 0,50 USD per ton of CO2
Revenue 4,40 USD million per year
Employees per site R/E 2010 R/E 2009
Maximum 24 26
Minimum 11 11
Number of sites 500
Total workers R/E 2010 R/E 2009
Maximum Minimum
Source : annual reports available at
27 447 108 000 $254 139 22 702 77 000 $294 831 17 973 58 000 $309 879 14 675 51 000 $287 745 14 414 53 100 $271 450 9 664 34 400 $280 930 10 221 55 000 $185 836 8 833 52 000 $169 865 2 904 7 264 $399 780 3 109 7 500 $414 533 $185 836 $169 865 $399 780 $414 533 11 838 12 951 5 503 5 307
Injection
http://investorcenter.slb.com/phoenix.zhtml?c=97513&p=irol-reportsannual http://ir.halliburton.com/phoenix.zhtml?c=67605&p=irol-reportsAnnual http://investor.shareholder.com/bhi/annuals.cfm
Storage
(c) 2008-2011. Minh Ha-Duong. Rodica Loisel. CIRED Reproduction allowed. share alike. attribution. Method 1: Minimum endogenous mortality risk increase
Negligible level of individual risk increase in MicroMort units: 1
1 micromort is defined as a one in a million probability of dying next year. This is a negligible level because: the probability of dying for Females, aged 5-9 is 97 MicroMort in Western Europe, 106 in New England This is the minimum across genders, region and age groups. So practically everybody is above 100 micromorts.
Risk level
225000 1E-06 0,23 MEM, small footprint
900000 1E-06 0,90 MEM, large footprint
Method 2: Storage sites as artificial installations
Analogue with a risk level apparently greater than CO2 storage: Risk around dangerous installations (Seveso)
France Europe Europe (former period)
1076 8558 Sites Source (a) 1860 Sites Source (c)
38 153 Fatalities Source (b) 14 Accidents per year Source (c)
17 17 Years Source (b) 2,3 Fatalities per accidents Source (c)
2,08E-003 1,05E-003 Fatalities per site per year 1,73E-002 Fatalities per site per year
Analogue with a risk level apparently smaller than CO2 storage: Risk around common installations in France
500000 Sites 403 Fatalities 17 Years Source (b)
4,74E-005 Fatalities per site per year
The above rates should be increased to account for underreporting (except those from source c), so the range is 0.01 – 0.0001
Because CO2 storage is regulated in-between these analogues, we assume that the accepted risk will be 0.001, in the (geometric) middle. But we extrapolate a worst case 3 times as high, because EU societies are more risk averse than our 2050 world
Onshore sites Risk per site Expected fatalities
450 0,001 0,45 Analogue, low risk
450 0,003 1,35 Analogue, high risk
Electronic supplement to the manuscript « Expected fatalities foone wedge of CCS in 2050 »
This spreadsheet computes global expected fatalities attributable to the storage of CO2 in the wedge scenario
According to P. Fishbeck and D. Gerard « Death Risk Rankings » database, accessed at http://www.deathriskrankings.com/ 2001-02-23,
Summary table : expected fatalities in 2050 from storage, method 1
Exposed
population Expected fatalities in 2050
Storage
Sources for method 2
(a) Salvi, O., A. Jovanovic, C. Bolvin, C. Dupuis, C. Vaquero, D. Balos, et A-M. Villamizar. 2008. F-SEVESO. Study of the effectiveness of the Seveso II Directive. Final report. (b) Michel, Laurent. 2010.Inventaire 2009 des accidents technologiques. Bureau d'Analyse des Risques et Pollutions Industriels (BARPI),
(c) Haastrup, P, et H Romer. 1995. An analysis of the database coverage of industrial accidents involving hazardous materials in Europe.
Remark on reliability testing and CO2 storage demonstration projects
If a fatality occurs too soon, it will be hard to justify that the risk per site is as low as 0.001 fatality per year.
with a 95% confidence level, one has to see the system working without failure for 3000 years. So when do we get 3000 years of storage experience in our scenario ?
Year Storage sites
2007 3 3 1,5 2008 4,5 7,5 1,5 2014 13,5 66 1,5 2015 15 81 3,5 2016 18,5 99,5 3,5 2024 46,5 373,5 3,5 2025 50 423,5 18 2026 68 491,5 18 2038 284 2711,5 18 2039 302 3013,5 18 2040 320 3333,5 18 2041 338 3671,5 18 2042 356 4027,5 18 2043 374 4401,5 18 2044 392 4793,5 18 2045 410 5203,5 18 2046 428 5631,5 18 2047 446 6077,5 18 2048 464 6541,5 18 2049 482 7023,5 18 2050 500 7523,5 18
Contract nᄚ070307/2007/476000/MAR/A3. Ao?t 29. http://ec.europa.eu/environment/seveso/review.htm
Minist?re de l'Ecologie, de l'Energie, du D?veloppement Durable et de l'Am?nagement du Territoire. http://www.aria.developpement-durable.gouv.fr/barpi_2963.jsp Journal of Loss Prevention in the Process Industries 8, no. 2: 79-86. http://dx.doi.org/10.1016/0950-4230(95)00008-O
According to the NIST/SEMATECH e-handbook of statistical methods (http://www.itl.nist.gov/div898/handbook/apr/section3/apr311.htm), to test statistically an MTBF of 1000 years
Cumulative experience
New sites opened per
Results
Summary of results (Table 4)
(c) 2008-2011. Minh Ha-Duong. Rodica Loisel. CIRED
Minimum Maximum
Coal mined Fatality rate Expected fatalities
Gt (scenario) per Mt mined In 2050
2,1 0,0383 81 Convergence to USA 1990-2007
2,1 0,0935 196 Safety progress follows the USA curve 80,6 196,5
Activity level Fatality rate Fatalities
Tt Nm in 2050
1,42 2,9 4,2 Extrapolated from tanking
1,42 10,9 15,5 Extrapolated from all goods trade 4,2 15,5
Mkm Fatality rate Fatalities
89,3 0,63 56 2009 ECS target are realised
89,3 0,91 81 The 2001 USA risk rate applies 56,2 80,9
Qty captured Risk rate Expected
Gt CO2 Gt-1 a-1 Fatalities
4,5 1,4 6,3 Accident record, low case
4,5 1,7 7,5 Accident record, high case
Workers Fatality rate Fatalities
7500 3 0,23 Worker’s safety, low case
15000 14 2,1 Worker’s safety, high case 0,2 7,5
Mkm Fatality rate Fatalities
0,15 5 0,75 Lower expectation
0,15 50 7,5 Upper expectation 0,8 7,5
Electronic supplement to the manuscript « Expected fatalities for one wedge of CCS in 2050 »
Summary results table : expected fatalities from coal mining
Summary table : expected fatalities for shipping coal
Summary table : expected fatalities from coal on railroads
Summary table : expected fatalities in 2050 to capture the CO2
Results
Shipping Fatality rate Fatalities
CO2 Tt Nm Fat/Tt Nm 2050 expected
2,25 2,9 7 Tanking, extrapolated
2,25 11 25 All goods, extrapolated 6,6 24,6
Workers Fatality rate Fatalities
5000 20 1 Lower expectation
15000 30 4,5 Upper expectation 1,0 4,5
Risk level
225000 1E-06 0,23 MEM, small footprint
900000 1E-06 0,90 MEM, large footprint
Onshore sites Risk per site
450 0,001 0,45
450 0,003 1,35 0,2 1,4
Total 149,7 338,2
Summary table : expected fatalities for shipping CO2
Summary table : expected fatalities from injection
Summary table : expected fatalities in 2050 from storage, method 1
Exposed population Expected fatalities in 2050 Expected fatalities