E R R A T U M
Erratum to: Genetic variability and phenotypic plasticity of apple
morphological responses to soil water restriction in relation
with leaf functions and stem xylem conductivity
Pierre-E
´ ric Lauri
1,7•Teˆte` Se´ve´rien Barigah
2,6•Gerardo Lopez
1,3•Se´bastien Martinez
1•Pasquale Losciale
4•Marco Zibordi
3•Luigi Manfrini
3•Luca Corelli-Grappadelli
3•Evelyne Costes
1•Jean-Luc Regnard
5Published online: 9 August 2016
Ó Springer-Verlag Berlin Heidelberg 2016
Erratum to: Trees
DOI 10.1007/s00468-016-1408-3
Unfortunately, some part text of Table
3
was missing in the
original publication of this article. The complete corrected
Table
3
is given in the following page.
The online version of the original article can be found under doi:10.1007/s00468-016-1408-3.
& Pierre-E´ric Lauri lauri@supagro.inra.fr
1 INRA, UMR AGAP, 34398 Montpellier, Cedex 05, France 2 INRA, UMR 547 PIAF, 63100 Clermont-Ferrand, France 3 Dipartimento Scienze Agrarie, University of Bologna, V.le
G, Fanin 46, 40127 Bologna, Italy
4 Consiglio per la ricerca in agricoltura e l’analisi
dell’economia agraria (CREA), Research Unit for Agriculture in Dry Environments [CREA-SCA], Bari, Italy
5 Montpellier SupAgro, UMR AGAP,
34060 Montpellier, Cedex 02, France
6 Clermont Universite´, Universite´ Blaise-Pascal, UMR 547
PIAF, BP 10448, 63000 Clermont-Ferrand, France
7 Present Address: UMR System, Campus Montpellier
SupAgro, 2 place Pierre Viala, Baˆt. 27, 34060 Montpellier, France
123
Trees (2016) 30:1909–1910 DOI 10.1007/s00468-016-1440-3
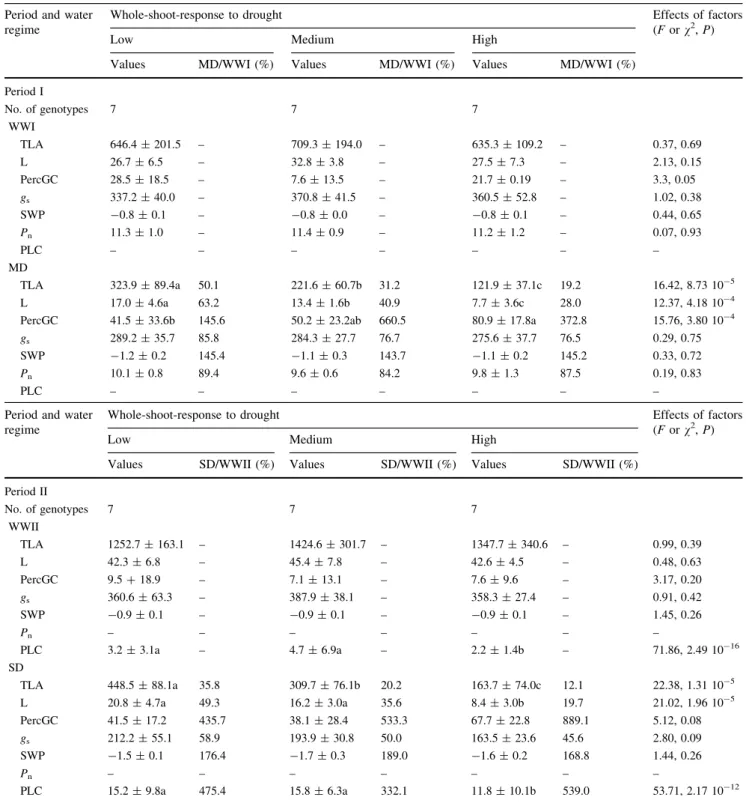
Table 3 Whole-shoot response to drought of two apple cultivars ‘Starkrimson’ and ‘Granny Smith’ and in 19 of their progenies, during two consecutive periods of growth (I and II)
Period and water regime
Whole-shoot-response to drought Effects of factors (F or v2, P)
Low Medium High
Values MD/WWI (%) Values MD/WWI (%) Values MD/WWI (%) Period I No. of genotypes 7 7 7 WWI TLA 646.4 ± 201.5 – 709.3 ± 194.0 – 635.3 ± 109.2 – 0.37, 0.69 L 26.7 ± 6.5 – 32.8 ± 3.8 – 27.5 ± 7.3 – 2.13, 0.15 PercGC 28.5 ± 18.5 – 7.6 ± 13.5 – 21.7 ± 0.19 – 3.3, 0.05 gs 337.2 ± 40.0 – 370.8 ± 41.5 – 360.5 ± 52.8 – 1.02, 0.38 SWP -0.8 ± 0.1 – -0.8 ± 0.0 – -0.8 ± 0.1 – 0.44, 0.65 Pn 11.3 ± 1.0 – 11.4 ± 0.9 – 11.2 ± 1.2 – 0.07, 0.93 PLC – – – – – – – MD TLA 323.9 ± 89.4a 50.1 221.6 ± 60.7b 31.2 121.9 ± 37.1c 19.2 16.42, 8.73 10-5 L 17.0 ± 4.6a 63.2 13.4 ± 1.6b 40.9 7.7 ± 3.6c 28.0 12.37, 4.18 10-4 PercGC 41.5 ± 33.6b 145.6 50.2 ± 23.2ab 660.5 80.9 ± 17.8a 372.8 15.76, 3.80 10-4
gs 289.2 ± 35.7 85.8 284.3 ± 27.7 76.7 275.6 ± 37.7 76.5 0.29, 0.75
SWP -1.2 ± 0.2 145.4 -1.1 ± 0.3 143.7 -1.1 ± 0.2 145.2 0.33, 0.72 Pn 10.1 ± 0.8 89.4 9.6 ± 0.6 84.2 9.8 ± 1.3 87.5 0.19, 0.83
PLC – – – – – – –
Period and water regime
Whole-shoot-response to drought Effects of factors (F or v2, P)
Low Medium High
Values SD/WWII (%) Values SD/WWII (%) Values SD/WWII (%) Period II No. of genotypes 7 7 7 WWII TLA 1252.7 ± 163.1 – 1424.6 ± 301.7 – 1347.7 ± 340.6 – 0.99, 0.39 L 42.3 ± 6.8 – 45.4 ± 7.8 – 42.6 ± 4.5 – 0.48, 0.63 PercGC 9.5 ? 18.9 – 7.1 ± 13.1 – 7.6 ± 9.6 – 3.17, 0.20 gs 360.6 ± 63.3 – 387.9 ± 38.1 – 358.3 ± 27.4 – 0.91, 0.42 SWP -0.9 ± 0.1 – -0.9 ± 0.1 – -0.9 ± 0.1 – 1.45, 0.26 Pn – – – – – – – PLC 3.2 ± 3.1a – 4.7 ± 6.9a – 2.2 ± 1.4b – 71.86, 2.49 10-16 SD TLA 448.5 ± 88.1a 35.8 309.7 ± 76.1b 20.2 163.7 ± 74.0c 12.1 22.38, 1.31 10-5 L 20.8 ± 4.7a 49.3 16.2 ± 3.0a 35.6 8.4 ± 3.0b 19.7 21.02, 1.96 10-5 PercGC 41.5 ± 17.2 435.7 38.1 ± 28.4 533.3 67.7 ± 22.8 889.1 5.12, 0.08 gs 212.2 ± 55.1 58.9 193.9 ± 30.8 50.0 163.5 ± 23.6 45.6 2.80, 0.09 SWP -1.5 ± 0.1 176.4 -1.7 ± 0.3 189.0 -1.6 ± 0.2 168.8 1.44, 0.26 Pn – – – – – – – PLC 15.2 ± 9.8a 475.4 15.8 ± 6.3a 332.1 11.8 ± 10.1b 539.0 53.71, 2.17 10-12
For each class of response (low, medium, high) absolute values (mean ± SD) of shoot morphology and plant functioning traits are provided. For each trait, values with different letters indicate significant differences (P \ 0.05) between means (ANOVA with the class of response as factor, followed when significant by HSD-Tukey multiple mean comparison test). The ratios MD/WWI in period I and SD/WWII in period II are also provided for each trait. Units of the variables are figured in Table 1
1910 Trees (2016) 30:1909–1910