HAL Id: cirad-00664047
http://hal.cirad.fr/cirad-00664047
Submitted on 28 Jan 2012HAL is a multi-disciplinary open access
archive for the deposit and dissemination of sci-entific research documents, whether they are pub-lished or not. The documents may come from teaching and research institutions in France or abroad, or from public or private research centers.
L’archive ouverte pluridisciplinaire HAL, est destinée au dépôt et à la diffusion de documents scientifiques de niveau recherche, publiés ou non, émanant des établissements d’enseignement et de recherche français ou étrangers, des laboratoires publics ou privés.
recommendations for yield forecast using NDVI
Agnes Begue, Valentine Lebourgeois, Eric Bappel, Pierre Todoroff, Anne
Pellegrino, Florence Baillarin, Bernard Siegmund
To cite this version:
Agnes Begue, Valentine Lebourgeois, Eric Bappel, Pierre Todoroff, Anne Pellegrino, et al.. Spatio-temporal variability of sugarcane fields and recommendations for yield forecast using NDVI. International Journal of Remote Sensing, Taylor & Francis, 2010, 31 (20), pp.5391-5407. �10.1080/01431160903349057�. �cirad-00664047�
recommendations for yield forecast using NDVI
A. BÈGUÈ*†, V. LEBOURGEOIS‡, E. BAPPEL†, P. TODOROFF§, A. PELLEGRINO†, F. BAILLARIN‡‡ and B. SIEGMUND‡
† Agricultural Research Centre for International Development (CIRAD), UMR TETIS, Maison de la Télédétection, Montpellier, F-34093 France
‡ Agricultural Research Centre for International Development (CIRAD), UPR SCA, Station La Bretagne, Saint-Denis, La Réunion, F-97408 France
§ Agricultural Research Centre for International Development (CIRAD), UPR SCA, Station de Roujol, Petit Bourg, Guadeloupe, F- 97170 France
‡‡ SPOT IMAGE, 5 rue des satellites, Toulouse, F-31030, France
Sugarcane is a semi-perennial grass whose cultivation is characterized by an extended harvest season lasting several months leading to very high spatio-temporal variability of the crop development and radiometry. The objective of this paper is to understand this variability in order to propose appropriate spectral indicators for yield forecast. To do this, we used ground observations and SPOT4 and SPOT5 time series acquired monthly over a 2-year period over Reunion Island and Guadeloupe (French West Indies). We showed that variations in the NDVI (Normalized Difference Vegetation Index) of sugarcane at the field scale are the result of the interaction between the sugarcane crop calendar and plant phenology in a given climatic environment. We linked these variations to crop variables measured in the field (LAI and leaf color), and derived simple, appropriate NDVI-based indicators of sugarcane yield components at the field scale (cane yield and sugar content). For biomass forecast, the best correlation (r² = 0.78) was obtained with images acquired about 2 months before the harvest season, when all the fields are fully developed but before the maturation stage. For sugar content, a polynomial relationship (r² = 0.75) was observed between the field NDVI acquired during the maturation stage and sugar content in the stalk.
Keywords: spatial variability, time series, NDVI, Sugarcane, Spatio-temporal, Crop management, Yield, Production, LAI, sucrose.
1. Introduction
The main advantage of satellite or aerial imagery over traditional systems is that it provides objective and spatially explicit observations of crop productivity over large areas. Crop yield estimation has been studied by the remote sensing community for many years now (e.g. Pinter et al. 2003, Lamb 2000), especially for cereals, which are major food crops.
Unlike other gramineous crops, estimation of sugar cane yield has been the subject of little remote sensing-oriented research, despite the worldwide importance of the crop with 20 million hectares harvested every year (FAO 2008). The few studies that have dealt with sugarcane were largely inspired by what was
being done for cereal crops. Direct approaches that link crop biomass to multispectral measurements or vegetation indices were developed from field radiometry (Simoes et al. 2005a), aircraft measurements (Schmidt et al. 2000), high resolution satellite images (Almeida et al. 2006, Ueno et al. 2005, Krishna Rao et al. 2002), and low resolution satellite images (Bastidas-Obando et al. 2007, Schmidt et al. 2000). Other indirect approaches that combine multispectral data with agrometerological, production or ecophysiological crop growth models (Rudorff et al. 1990, Bastiaanssen et al. 2003, Bappel et al. 2005) have also been explored. However, research in this field is still young and few experiments have been conducted, so it is difficult to draw conclusions about the reliability and possible generalization of results. Furthermore, except for Bastiaanssen et al. (2003), who used a rough harvest index, none of these studies estimated sucrose yield.
Although remote sensing is potentially very useful for sugarcane (see review by Abdel-Rahman et al. 2008), Simoes et al. (2005a) linked the paucity of publications of experimental results to the difficulty in collecting data for a large crop and to the length of the growing period. Almeida et al. (2006) reported that predictions of sugarcane yield using remote sensing are rarely discussed in the specialized literature owing to the proprietary nature of past work, which has mainly been conducted by sugarcane industry research institutes. In addition, we believe that the length of the harvest season, the lack of direct links between sugar yield and crop radiometry, and the uncertainty of the growth models (Promburom et al. 2001, Inman-Bamber et al. 2005b) are largely responsible for the difficulties involved in using remote-sensing data to forecast sugarcane yield.
- The length of the harvest season (4-12 months) means ratoon crops start their growth in a wide range of different conditions even in the same location (Inman-Bamber et al. 2005b), resulting in very high spatio-temporal variability at the field scale. Only fine time series of images with decametric resolution enable this variability to be captured at the scale at which it appears.
- The lack of direct links between radiometry and sugar yield cannot be easily compensated by the use of growth models. Sugarcane is for the most part indeterminate and sucrose is accumulated in a vegetative organ that is harvested over an extended period of the year (Inman-Bamber et al. 2005a, Inman-Bamber et al. 2005b). Consequently, forecasting sugarcane yield is harder than for most other crops that accumulate the product of value in sexual reproductive organs under relatively predictable patterns of development.
- Finally, it is very difficult to use sugarcane growth models to simulate extreme situation due to the lack of basic physiological information available (Inman-Bamber et al. 2005b) as well as to difficulties in calibrating the model at the field or farm scale (Promburom et al. 2001).
Considering the particularities of sugarcane physiology and cultivation, the objectives of this study were to 1. characterize and understand the spatio-temporal variability of the sugarcane crop by analyzing the effects of management practices and climate on the spectral properties of sugarcane over time, and 2. use the results of our analysis and ground measurements made during the experiment to draw conclusions and make recommendations concerning direct remote sensing methods to forecast the sucrose yield (product of biomass and sucrose fraction). To do this, we used NDVI time series of SPOT4 and SPOT5 images acquired monthly over a 2-year period over Guadeloupe and Reunion Islands.
2. Sugarcane - background information
Sugarcane (Saccharum officinarum L.) is a semi-perennial tall grass in the Poaceae, whose stalk sap is rich in sugar. It is a tropical crop which grows between latitude 35°N and latitude 30°S. The ideal climate for sugarcane is a long, warm growing season and a fairly dry, sunny, cool, but frost-free ripening and harvest season (Humbert 1968).
The growth of sugarcane is characterized by three development stages: sprouting and tillering, stalk growth, and maturation. The maturation is triggered by a decrease in soil water content, in temperature, and in nitrogen availability and is characterized by the end of stalk growth and modifications in the stalks and leaves; sucrose accumulates and chlorophyll, leaf water content and turgor decline (Hsiao 1973). We are hypothesizing an inverse correlation between sucrose content and chlorophyll content can be used to estimate yield by remote sensing.
Sugarcane stem cuttings are used as planting material. After 18 and 24 months, the sugarcane is cut and harvested; buds on the underground stubble that remains germinate again and give rise to another crop. This is called the ratoon crop which is harvested at about 12-month intervals for four years or more, before the crop is renewed due to decreasing yield. The crop is harvested when it has fully matured and ripened. Early varieties and ratoon crops are the first to be harvested either mechanically (usually green) or by hand (either burnt or green). The harvest season generally lasts several months; the exact time of harvest depends on the tonnage of cane to be processed, the capacity of the mills, and the climate (there is no harvest during the rainy season).
3. Data acquisition
3.1 Study sites
The experimental sites are located in two French overseas territories – Guadeloupe (16° 17’ N; 61° 25’ W) in the French West Indies, and Reunion Island (21° 07’ S; 55° 31’ E) in the southern Indian Ocean - and represent a wide range of agronomic, climatic and socio-economic conditions. On these islands, most growers are smallholders, and the mean size of the sugarcane fields is about 0.9 ha. Sugarcane harvest is done during the dry season, and lasts from February to July in the northern hemisphere, and from July to December in the southern hemisphere.
In Guadeloupe, sugarcane covers about 14 300 ha (Source: Agriculture and Forestry Office, 2006). Sugar production is generally low (~ 60 t ha-1), mainly because most crops are rainfed and large areas are frequently subjected to water stress. Image analysis and ground experiments in Guadeloupe were carried out on the Gardel estate site, which covers about 1 000 ha and is run by the only planter-miller on the island. Recorded rainfall on the Gardel estate was respectively 1185 mm and 1905 mm in the 2002-03 and 2003-04 growing seasons (recorded between June and May) for an average annual rainfall of 1325 mm during the period 1977-2000.
In Reunion, 25 500 ha of sugarcane are cultivated along the coast (Source: Agriculture and Forestry Office, 2006). In the wet north-eastern part of the island, where most of our field experiments were conducted, sugarcane is rainfed but production is generally high (~ 90 t ha-1). In meteorological stations located close to our field experiment, recorded rainfall was respectively 2028 mm, 1697 mm, and 1626 mm in the 2002, 2003, and 2004 growing seasons (recorded between January and December).
3.2 Geospatial data acquisition
3.2.1 Satellite images. At each study site, image time series were acquired using SPOT4 and SPOT5 satellites. The most complete time series was available for the Reunion Island site, with 25 images acquired between May 2002 and November 2004 (Appendix A). This time series belongs to the ISLE-Reunion data base set up by CNES (De Boissezon et al. 2006). For the Guadeloupe site, the image time series comprised 17 images acquired between September 2002 and May 2004 (Appendix B). The images in both time series were as evenly spaced as possible, depending on the cloud cover.
The four spectral bands on SPOT4 and SPOT5 are Green (G: 0.50 – 0.59 µm), Red (R: 0.61 – 0.68 µm), Near Infrared (NIR: 0.78 – 0.89 µm) and Shortwave Infrared (SWIR: 1.58 – 1.75 µm). SPOT4 images are acquired at a resolution of 20 m , and SPOT5 images at a resolution of 10 m (except the SWIR band which is 20 m). In addition, a 2.5 m resolution multispectral image (Supermode®) was acquired every year over Reunion Island. All the images were acquired in raw format (level 1a) with no geometric pre-processing. 3.2.2 Digital Elevation Models. In order to apply accurate geometric correction to the satellite images, we used a Digital Elevation Model (DEM) at a resolution of 25 m in x and y purchased for Reunion Island (TOPO® DB, IGN). In Guadeloupe, a 10 m resolution DEM was processed from aerial photos ordered by the French Ministry of Agriculture.
3.2.3 Cane field boundaries. Since 2002, data concerning the expansion and localization of sugarcane fields in Guadeloupe and Reunion has been recorded and updated annually by the Agriculture and Forestry Office in conformity with the European Union Common Agricultural Policy (CAP). Based on farmers’ declarations, the boundaries of agricultural fields are digitized on 0.5 m resolution aerial ortho-photographs (ORTHO® DB, IGN) acquired every five years. On Reunion Island, farmers only declare blocks of plots. To supplement this block database, a map of field boundaries is produced regularly by photo-interpretation of a SPOT5 image acquired at a resolution of 2.5 m (Lebourgeois et al. 2007). This is less accurate than using aerial photographs but enables annual updating, which is necessary for a crop like sugarcane with a high rotation rate in a region with highly dynamic land use.
3.3 Agronomic data acquisition
In 2002 and 2003, different sets of ground measurements were collected at the experimental sites to characterize the structure and biochemical composition of sugarcane canopies. The measurements were averaged at the field scale so they could later be related to SPOT spectral data.
1. The Leaf Area Index (LAI) was estimated on twenty ratoon fields sampled in irrigated and rainfed areas in Reunion only. The measurements were repeated two or three times during the crop season. For not fully developed cane canopies, LAI was calculated using allometric functions, by measuring the stalk height from the soil to the last ligule, along a 3-m segment of one row in each field (Martiné 2003). For closed canopies, LAI was measured with a Licor LAI-2000 sensor. Both measurements were compared and inter-calibrated.
2. The nitrogen and water conditions of the plants were estimated by measuring the greenness of plant leaves. Relative greenness was measured throughout the sugarcane cycle in sampled fields in Reunion and Guadeloupe using a handheld chlorophyll meter (SPAD-502, Konica Minolta). In each field, three SPAD measurements were made on the upper side of the third leaf of 30 plants.
3. The sugar content of cane juice was measured with a handheld refractometer (BRIX ATC-1, Atago). The refractometer measures the total soluble solid content of the juice; the BRIX scale, calibrated to the number of grams of sugar contained in 100 g of water, enables direct reading of stalk sugar content (%).
At the experimental sites in Reunion and Guadeloupe, BRIX measurements were taken on five primary canes per sampled field during the maturation stage. Each cane was sampled at the bottom, middle and top, and the three values were then averaged.
To supplement the ground measurements, we collected field information (plantation date, harvest date, variety) and yield data (fresh biomass and sugar content) from the agronomic databases of the Gardel estate and from cane growers in Reunion.
4. Methods
4.1 Image pre-processing
SPOT images were orthorectified using the geometric SPOT model provided by ERDAS IMAGINE™
software. For the process, we used the DEM and 30 control points scattered over both scenes. The control points were extracted from aerial ortho-photographs (ORTHO® DB, IGN). The SPOT images co-registration accuracy was better than one pixel
As we used image time series, the digital counts needed to be converted into reflectances. To do this, we used the following equation:
S S E G DC ) cos(θ π ρ= Equation 1
where ρ is the TOA (Top Of Atmosphere) reflectance, DC is the digital count, G is the sensor absolute calibration gain (provided in the metadata associated with the image), θS is the solar zenith angle and ES is the solar radiation in the appropriate wavelength. In mountainous terrain, such as on Reunion Island, additional radiometric corrections are necessary to take into account the variation in incident radiation due to the surface slope and aspect (Richter 1998). In this case, the illumination angle βs replaces θS in Eq. 1:
) cos( ) sin( ) sin( ) cos( ) cos( ) cos(βS = θS θn + θS θn ϕS −ϕn Equation 2
where θn is the surface zenith angle (slope), ϕS is the solar azimuth angle and ϕn the surface azimuth angle (aspect).
Despite the radiometric calibration of each image, some effects due to the atmosphere composition or the sun-view configuration still interfered with the radiometry of the surface. To limit these effects, we normalized the reflectance values in each image using invariant targets (El Hajj et al. 2008) and we based our analysis on the NDVI (Normalized Difference Vegetation Index) values. On the areas of interest, the clouds and cloud shadows were masked by photo interpretation.
4.2 NDVI-based indicators
The study was conducted using NDVI time series of SPOT4 and SPOT5 images. All calculations and analysis were done at the field scale, which is the scale of the cropping operation and the scale of the variability.
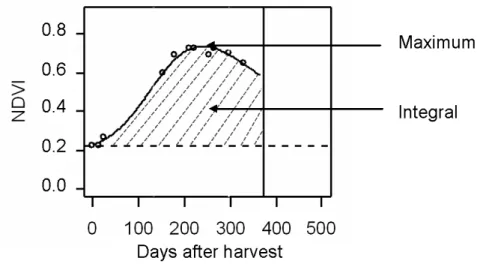
Using the time series of satellite images, we calculated common NDVI-based indicators (e.g. Tucker 1979, Prince et al. 1986, Du Plessis 1999): the maximum NDVI and the integrated NDVI over the growing period. The calculation was done after modeling the NDVI values through time.
For all image acquisition dates, we first computed the mean NDVI for each polygon field eroded by one pixel to minimise residual misregistration errors. The NDVI model was made using these field NDVI values.
For each field, two continuous logistic functions were used to represent the crop growth phase G(t) and the senescence phase S(t) (Clevers et al. 2002) (Figure 1):
[ ]
{
}
[ ]{
( )}
) (1
/
)
(
1
/
)
(
)
(
)
(
)
(
ts t b ti t ae
M
t
S
e
M
t
G
t
S
t
G
t
NDVI
− − − −+
=
+
=
−
=
Equation 3where t is the number of days since the last harvest, M is the maximum value of the logistic curves, a and b are the slopes at the inflexion points of the G and S functions, and ti and ts are time values at these inflexion points. These parameters were obtained by non-linear fitting, minimizing the residual sum of squares. At t = 0 (date of the previous harvest), an initial value for NDVI was set equal to the value of sugarcane field residues calculated from SPOT images acquired within two weeks after the harvest (0.168 and 0.226 for Guadeloupe and Reunion respectively).
Figure 1. Example of temporal profile of NDVI measured with SPOT satellites over a sugarcane field in Guadeloupe. The points correspond to SPOT measurements acquired on different dates, and the curve is a fitted logistic-based function (see text). The maximum and time-integral of the fitted function are given.
Once the NDVI was modeled for each field, the maximum value and the integrated NDVI value over the growing period (between two harvests) were calculated.
5. Results and discussion
5.1 Spatio-temporal variability of sugarcane NDVI
5.1.1 Temporal variability of sugarcane NDVI at the field scale. The time variations in sugarcane field-based NDVI were shown to be mainly related to the phenology of the crop and to climatic conditions. The examples given in Figure 2 are typical of the time variations in field-based NDVI in wet rainfed conditions (Reunion) and in dry rainfed conditions (Guadeloupe).
Ratoon NDVI reflects the phenology of the crop (Gers 2003) and can be split into:
- A growth phase: After harvest, the soil is covered with crop residues and the value of the NDVI is low, between 0.15 and 0.2, depending on the amount of residues (Figure 2). The NDVI then increases rapidly
as the vegetation regrows and, after four to six months, reaches the maximum value (between 0.7 and 0.8) typical of a fully developed dense green canopy. The length of the growing period depends on the climatic conditions after the harvest. In the case of crops harvested early in winter (around June in Reunion, and February in Guadeloupe), sugarcane grows slowly due to low temperatures and low rainfall; the crop canopy needs about six months to reach full cover. When the crop is harvested in summer (around December in Reunion, and July in Guadeloupe), crop growth is faster due to high temperatures and higher rainfall; in these conditions the crop canopy reaches full cover in about four months.
- The maturation phase: When there is no water stress (e.g. in Reunion), the NDVI remains stable during the maturation phase, and remains and right up to harvest (Figure 2a). In cases of severe water stress (in Guadeloupe in 2002–2003), NDVI can decrease all the way down to 0.25 (Figure 2b) due to the senescence of the leaves. In such extreme cases, a senescent standing cane and crop residues on the surface of the soil have similar NDVIs and consequently cannot be satisfactorily distinguished using NDVI alone. Only the use of an additional spectral band, such as the short wave infrared band, can help avoid confusing the two surface conditions (Lebourgeois et al. 2007).
Planted sugarcane crops grow more slowly than ratoon crops. When the field is ploughed before planting, it takes between 10 months (in normal water conditions, Figure 2a) and 16 months (in stressed conditions, Figure 2b) for the NDVI to increase from the value of bare soil (between 0.10 and 0.15) to its maximum (between 0.7 and 0.8). This additional time (compared to ratoon crops) is due to the fact that a plant crop has fewer buds available to produce primary shoots and the buds are located deeper in the soil than in the ratoon crop (Thompson 1988).
Figure 2. Time series of SPOT NDVI illustrating the sugarcane crop cycles of three fields in (a) a rainfed area with no water stress on Reunion Island, and (b) a rainfed area with limited water in Guadeloupe (Gardel). The shaded areas correspond to the harvest seasons. The dotted lines represent the harvest.
5.1.2 Spatial variability of sugarcane NDVI at the farm or regional scale. The main driving factor of the spatial variability of sugarcane at the farm or regional scale is cropping practices. However, in Reunion and Guadeloupe, one can observe synchronized development of the sugarcane fields at the regional scale, at the beginning of the dry season before the harvest period.
The length of the harvest and planting seasons, and the resulting time lag in sugarcane phenology at the scale of the individual field, are responsible for the high spatial variability in the spectral properties of the cropped area. This variability is illustrated by a boxplot representation of NDVI over the course of the growing season (Figure 3). Such inter-field variability has been reported by many authors, for example Xavier et al. (2006), who had difficulty selecting homogeneous samples from the MODIS time series suitable for supervised classification of the cane cropped area in Brazil. However, at our study sites, climatic factors such as rain and temperature play the role of regulators, resulting in synchronization of the vegetative growth of the ratoon crops with a NDVI peak and minimal inter-field variability at the end of the rainy season (Figure 3) about two months before the harvest season (around May in Reunion, and December in Guadeloupe). At this vegetation peak, the new plantations are still at an early stage of development and appear as outliers in the boxplot representation (Figure 3a, b).
In conclusion, during the pre-harvest period, ratoon NDVI is maximal, inter-ratoon-field variability is minimal, and the sugarcane fields are comparable in terms of vegetative development with a completely closed canopy.However, in regions with a longer harvest season (> 8 months) or a different harvest calendar, such synchronization of plantation growth should not occur, as a crop harvested late would not have the physiological time necessary to reach full development before the following harvest.
(a)
(b)
June 02 Oct 02 Feb 03 June 03 Oct 03 Mar 04 Aug 04
0 .1 0 .2 0 .3 0 .4 0 .5 0 .6 0 .7
SPOT acquisition date
F ie ld N D V I
Sept 02 Dec 02 Mar 03 Jul 03 Nov 03 Jan 04 Apr 04
0 .1 0 .2 0 .3 0 .4 0 .5 0 .6 0 .7
SPOT acquisition date
F ie ld N D V I 0.7 0.5 0.6 0.4 0.3 0.2 0.1 0.7 0.5 0.6 0.4 0.3 0.2 0.1
SPOT image acquisition date
April October March September March September 2002 2002 2003 2003 2004 2004
SPOT image acquisition date
September March July November April 2002 2003 2003 2004 2004
Figure 3. Box plot of SPOT NDVI of rainfed sugarcane fields over time (a) ratoons and plantations under wet conditions in Reunion, (b) ratoons and plantations under dry conditions in Guadeloupe, (c) ratoons only in Reunion, (d) ratoons only in Guadeloupe. The shaded areas correspond to the harvest seasons.
Jul 02 Oct 02 Feb 03 June 03 Oct 03 Mar 04 Aug 04
0 .1 0 .3 0 .5 0 .7
SPOT acquisition date
F ie ld N D V I
Sept 02 Dec 02 Mar 03 Jul 03 Nov 03 Jan 04 Apr 04
0 .1 0 .2 0 .3 0 .4 0 .5 0 .6 0 .7
SPOT acquisition date
F ie ld N D V I
SPOT image acquisition date
April October March September March September 2002 2002 2003 2003 2004 2004
SPOT image acquisition date
September March July November April 2002 2003 2003 2004 2004 0.7 0.5 0.6 0.4 0.3 0.2 0.1 0.7 0.5 0.6 0.4 0.3 0.2 0.1
(c)
(d)
5.2 Relationships between NDVI and crop variables
It is well known that the main driving factors of variations in the NDVI are the amount of vegetation (generally expressed by LAI) and the color of the leaves. Using our experimental data set, we studied the links between these two variables and the NDVI for sugarcane ratoons. To do this, we split our experimental data set into two data sets, one corresponding to the growing phase and the other corresponding to the maturation phase. We confirmed that, during the growing stage, variations in the NDVI were mainly explained by variations in the LAI, and that, during the maturation phase, variations in the NDVI were mainly explained by changes in the color of the leaves. The transition period between these two stages corresponded to the maximum NDVI.
5.2.1 Relationship between NDVI and LAI. In Reunion, the range in measured LAI values was particular wide (from 0.1 to 7), and enabled us to build a field-scale relationship between the NDVI derived from SPOT images and the measured LAI (Figure 4). This relationship was only established for data acquired during the growth phase of the crop (before and during the period of maximum NDVI), and is consequently only valid for green LAI:
NDVI
LAI =0.0211exp7.9336 Equation 4
As expected, the relationship between NDVI and LAI at field-scale was strong (r² = 0.94), exponential and began to saturate for LAI values above 3. The RMSE was 0.98, which could be related to (a) the imprecision of the LAI estimation caused by the field sampling techniques, and (b) sun-view configuration noises affecting the satellite radiometric signal.
y = 0.0211e7.934 x R2 = 0.94; n = 48 RMSE = 0.98 0 2 4 6 8 0 0.2 0.4 0.6 0.8 SPOT NDVI L A I
Figure 4. Relationship between LAI measurements and SPOT NDVI calculated at the field scale for the Reunion data set. For each field, only the NDVI values acquired before or during the maximum NDVI were selected.
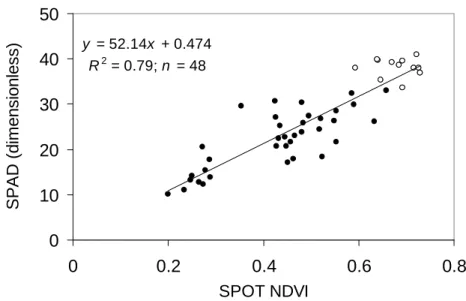
5.2.2 Relationship between NDVI and SPAD. During the maturation phase (during and after the period of maximum NDVI), a linear relationship appeared between the field NDVI derived from SPOT images and that derived from measured SPAD values (Figure 5):
474 . 0 14 . 52 + = NDVI SPAD Equation 5
This relationship was strong (r² = 0.79) and valid for a large range of SPAD values, from 10 to 40. Values of 40 corresponded to very green leaves (irrigated, healthy canopy) while SPAD values of 10 corresponded to senescent leaves.
During the maturation stage, the leaves are more or less senescent and generally turn yellowish due to degradation of the chlorophyll. This change in color has an impact on reflectances in the visible bands, leading to a decrease in NDVI values. Equation 5 is valid when spectral variations in the canopy can be linked only to variations in leaf color. This assumes that the vegetation canopy is fully developed (no soil visible) and that the structure of the canopy is not modified by any other factors.
y = 52.14x + 0.474 R2 = 0.79; n = 48 0 10 20 30 40 50 0 0.2 0.4 0.6 0.8 SPOT NDVI S P A D ( d im e n s io n le s s )
Figure 5. Relationship between SPAD measurements and SPOT NDVI calculated at the field scale for the Reunion (open symbols) and Guadeloupe (solid symbols) data sets. For each field, only the NDVI values acquired during or after the maximum NDVI were selected.
5.3 Use of NDVI-based indicator for yield forecast
As mentioned above, NDVI could be related to the LAI during the growth stage, and to the color of the leaves during the maturation stage. The LAI is known to be linked to one yield component, cane biomass (e.g. Simoes et al. 2005b); we assumed and confirmed in this study that the color of the leaves can be linked to the other yield component, sugar content. Based on these assumptions and observations, in the following section, we describe the relationships we obtained between sugarcane yield components and NDVI-based indicators. 5.3.1 Relationship between NDVI and cane yield. SPOT time series acquired during the cropping season in Reunion and Guadeloupe were used to derive regressions between cane yield (biomass) measured at the field scale and 1. the maximum NDVI, and 2. the time integral of NDVI (Figure 1), for a large set of sugarcane ratoon fields. Our results show that maximum NDVI and integrated NDVI methods gave comparable RMSE at the field-scale, i.e. 13.2 t/ha and 15 t/ha respectively (Figure 6).
(a) (b) y = 1,0459e6,2301x R2 = 0.78 ; n = 127 RMSE = 13.2 t ha-1 0 30 60 90 120 150 180 0.5 0.6 0.7 0.8
Maximum NDVI
M
e
a
su
re
d
Y
ie
ld
(
t
h
a
-1)
y = 1.5225x - 78.911 R2 = 0.72 ; n = 97 RMSE = 15 t ha-1 0 30 60 90 120 150 180 40 70 100 130Integrated NDVI
M
e
a
s
u
re
d
Y
ie
ld
(
t
h
a
-1)
Figure 6. Regressions between ratoon field yields in Guadeloupe (solid symbols) and Reunion (open symbols), and SPOT NDVI indicators: (a) NDVI maximum (see text) and (b) NDVI time integral (see text).
As mentioned above, at our sites, the maximum NDVI is reached about two months before harvest begins. At this time, at the end of stalk growth, the yield tendencies of the crop are already established, and the NDVI can be a good indicator of biomass as shown in Figure 6a. This result is in agreement with results of Rudorff et al. (1990) and Ueno et al. (2005) who concluded that the bestacquisition period of satellite images for the assessment of sugarcane yield is about two months preceding the beginning of harvest. Almeida et al. (2006) recommended deriving the NDVI-yield relationship at 8-10 months of growth, which is also consistent with our observations. Not using this period could explain the bad results obtained by some authors who related the NDVI or spectral reflectances to yield without questioning the image acquisition dates in their specific
agronomic context (Lee-Lovick et al. 1991, Schmidt et al. 2000). In theory, with a single observation, the reliability of imagery as a means of estimating final yields decreases the earlier the image is taken before harvest because there are more opportunities for factors, such as drought or nutrient deficiency, to influence yield. However, the advantage of the maximum NDVI method is that it can be used with only a few images, even a single image may suffice if it is acquired about two months before the beginning of the harvest season when the growth of different cane fields has reached maximum (Figure 3). However, the relationship is not linear and may not be accurate for high yields due to NDVI saturation.
The integrated NDVI method provides linear regressions with yield (Figure 6b) with is an important feature. However, it is more difficult to implement as it requires a larger number of inter-calibrated images acquired throughout the growing season, along with a good approximation of the harvest dates for each field (which is only possible for large estates, where cropping operations are recorded). Generally, the relationship between integrated NDVI and yield depends on the variety and on environmental conditions (Bastidas-Obando et al. 2007). We thus recommend that this approach be used in combination with field measurements to calibrate the regressions.
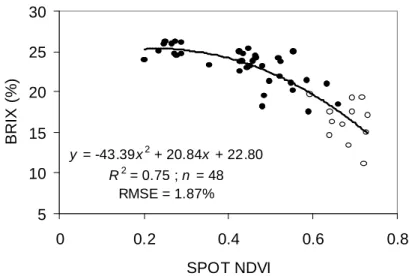
5.3.2 Relationship between NDVI and sugar content. Our results showed that during the maturation phase (during and after the period of maximum NDVI), a relationship exists between the NDVI derived from SPOT images and BRIX values measured in the field (Figure 7). This relation, which was established from the Guadeloupe and Reunion 2002-2003 data sets, was rather linear between BRIX [12%-25%] and NDVI [0.4–0.7]; below an NDVI value of 0.4, the variations in the NDVI did not correspond to variations in BRIX values that stay constant around 25%. Globally the relation was good with r² = 0.75 and RMSE = 1.87%.
As mentioned above, during the maturation stage the leaves are senescing, the chlorophyll is degraded and the leaves turn yellowish. Generally, leaf senescence corresponds to water loss in the plant and, consequently, to an increase in the sugar content of the stalk juice. The link between extended drying-off periods and enhanced sucrose content has often been demonstrated experimentally (Inman-Bamber et al. 2005a). However, this relationship is valid when the spectral variations of the canopy can be linked only to variations in the color of the leaves. This assumes that the vegetation canopy is fully developed (no soil visible) and that the structure of the canopy is not modified by any other factors.
y = -43.39x2 + 20.84x + 22.80 R2 = 0.75 ; n = 48 RMSE = 1.87% 5 10 15 20 25 30 0 0.2 0.4 0.6 0.8 SPOT NDVI B R IX ( % )
Figure 7. Relationship between BRIX values measured on sugarcane ratoon fields in Guadeloupe (solid symbols) and Reunion (open symbols) and field NDVI calculated from SPOT images. For each field, only the NDVI values acquired during or after the maximum NDVI were selected.
6. Conclusions
Until recently, remote sensing was less often used for sugarcane than for other gramineous crops mainly because sugarcane cycles are highly variable in time and space, and consequently difficult to capture on, and interpret from, single satellite images. Based on two examples in Reunion and Guadeloupe, and thanks to a large time series of high-resolution SPOT images, we were able to show that the variability was the result of the interaction between the sugarcane crop calendar (which is spread out over a period of several months), the phenology of the plant, and the climate. We linked these variations to crop variable dynamics, in particular LAI and leaf color, in order to derive a simple NDVI-based indicator of sugar yield (cane yield and sugar content). Our main finding is that understanding sugarcane physiology and cultural practices is crucial if remote sensing applications are to succeed in yield predictions. We wish to emphasize the importance of identifying the period in which the NDVI was acquired before interpreting and analyzing images.
In conclusion, the results obtained in this study should facilitate the assessment of satellite remote sensing for sugarcane yield forecast. The arrival of a new generation of high resolution satellites with a high capacity of revisit will surely help to develop remote sensing applications for sugarcane management.
Acknowledgments
o Most of the results presented here come from the SUCRETTE project funded by the French Ministry of Research
through the Earth and Space Program (RTE).
o CNES (Centre National d’Etudes Spatiales), in particular to Hélène De Boissezon, for access to the
ISLE-REUNION KALIDEOS data base which is a satellite image reference database developed for scientific studies.
o Many thanks to the students who participated in the data collection and processing, namely Marie Guitton,
Appendix A: List of SPOT images acquired over the Reunion site (KALIDEOS ISLE-Reunion).
Acquisition Date Satellite Mode (a) Incidence angle (b) Solar elevation Solar azimuth Phase angle
June 12, 2002 SPOT4 PXI 3.2 39.2 30.9 52.0
July 6, 2002 SPOT5 J+THX -25.1 40.4 28.9 42.0
Aug 8, 2002 SPOT4 PXI 10.7 44.3 36.3 51.3
Aug 14, 2002 SPOT4 PXI -19.2 43.6 41.7 39.1
Sept 9, 2002 SPOT4 PXI -19.2 51.6 48.9 29.8
Sept 22, 2002 SPOT5 J 25 67.7 96.6 43.1
Oct 9, 2002 SPOT4 PXI 24.8 65.7 54.6 45.4
Oct 18, 2002 SPOT5 J+THX 24.9 65.2 83.3 47.3
Jan 10, 2003 SPOT5 J -4.65 64.1 96.7 21.3
Feb 26, 2003 SPOT5 J -11.9 58.5 72.2 22.1
Mar 25, 2003 SPOT4 PXI 3.6 55.1 53.2 37.5
Apr 26, 2003 SPOT4 PXI -26.3 45.4 42.2 36.7
May 4, 2003 SPOT5 J 10.9 46.7 33.6 48.1
June17, 2003 SPOT4 PXI -26.2 37 34.5 46.9
July 21, 2003 SPOT5 J+THX 10.58 41.1 32.5 53.2
Aug 21, 2003 SPOT5 J 18.2 48.8 37.2 51.2
Oct 14, 2003 SPOT4 PXI -4.6 64.35 62.6 22.1
Nov 20, 2003 SPOT4 PXI -25.8 66.1 90.5 26.2
Dec 19, 2003 SPOT5 J -2.9 67.25 100.2 19.8
Mar 17, 2004 SPOT5 J -19.1 54.39 60.4 25.0
May 13, 2004 SPOT5 J+THX -11.83 42.79 34.96 43.9
June 18, 2004 SPOT5 J 3.25 38.97 30.57 52.1
Aug 19, 2004 SPOT5 J 17.96 48.44 37.16 51.3
Sept 11, 2004 SPOT4 PXI -12.0 53.7 48.1 34.5
Oct 26, 2004 SPOT5 J 3.3 68.00 70.66 24.9
(a)
J is the SPOT5 multispectral mode (10 m resolution); THX is the pan-sharpened mode (2.5 m resolution) of SPOT5 multispectral images; PXI is the pan-sharpened mode (10 m) of SPOT4 multispectral images.
(b)
Appendix B: List of SPOT images acquired over the Guadeloupe site.
Acquisition Date Satellite Mode (a) Incidence Angle (b) Solar elevation Solar Azimuth Phase Angle Sept 19, 2002 SPOT4 XI 6.9 67.2 127.8 29.0 Oct 24, 2002 SPOT5 J -6.8 52.1 143.3 31.7 Dec 6, 2002 SPOT4 XI 5.9 47.2 155.9 46.3 Jan 21, 2003 SPOT5 J -16.5 46.7 145.7 32.9 Feb 11, 2003 SPOT5 J -23.5 50.1 138.5 24.5 Mar 29, 2003 SPOT5 J 7.0 66.3 122.2 30.4 Apr 30, 2003 SPOT5 J -23.5 68.9 91.7 4.6 May 4, 2003 SPOT5 J 22.1 74.7 90.1 37.1 May 25, 2003 SPOT5 J 14.6 73.4 71.5 30.0 July 17, 200 SPOT4 XI 27.5 72.4 69.8 43.5 Sept 12, 2003 SPOT5 J -17.6 66.3 117.3 8.0 Nov 15, 2003 SPOT4 XI -24.8 50.7 150.6 30.2 Jan 4, 2004 SPOT5 J -2.2 45.9 151.0 42.7 Jan 24, 2004 SPOT5 J 27.7 49.8 151.0 61.8 Jan 31, 2004 SPOT4 XI 13.4 50.2 146.9 49.7 Apr 12, 2004 SPOT5 J -10.5 67.9 107.4 11.7 Apr 27, 2004 SPOT5 J 13.3 72.9 95.6 30.4 (a)
J is the SPOT5 multispectral mode (10 m resolution); XI is the SPOT4 multispectral mode (20 m resolution).
(b)
References
ABDEL-RAHMAN,E.M. and F.B.AHMED, 2008, The application of remote sensing technqiues to sugarcane
(Saccharum spp. hybrid) production: a review of the literature. International Journal of Remote Sensing, (in press).
ALMEIDA,T.I.R., C.R.DE SOUZA and R.ROSSETTO, 2006, ASTER and Landsat ETM+ images applied to
sugarcane yield forecast. International Journal of Remote Sensing, 27, 4057-4069.
BAPPEL,E., A.BÉGUÉ, J.F.MARTINÉ, A.PELLEGRINO and B.SIEGMUND, 2005, Assimilation in a sugarcane
yield forecasting model of biophysical parameter estimated by remote sensing using SPOT4&5 data. In Proceedings of the International Society of Sugar Cane Technologists (ISSCT), GUATEMALA, 25, pp. 260-264.
BASTIAANSSEN, W. G. M. and S. ALI, 2003, A new crop yield forecasting model based on satellite
measurements applied across the Indus Basin, Pakistan. Agriculture, Ecosystems and Environment, 94, 321-340.
BASTIDAS-OBANDO,E. and J.CARBONELL-GONZALEZ, 2007, Evaluating the applicability of MODIS data for
forecasting sugarcane yields in Colombia. In Proceedings of the International Society of Sugar Cane Technologists (ISSCT), Durban (South Africa), 26, pp. 4 p.
CLEVERS, J. G.P. W., O. W. WONDER, R. E.E. JONGSCHAAP, J.F. DESPRATS, C.KING, L.PRÉVOT and N.
BRUGUIER, 2002, Using SPOT data calibrating a wheat growth model under mediterranean conditions.
Agronomie, 22, 687-694.
DE BOISSEZON,H. and A.SAND, 2006, Reference remote sensing data bases: temporal series of calibrated and
orthorectified satellite images for scientific use. In Proceedings of the 2nd International Symposium on the Recent Advances in Quantitative Remote Sensing (RAQRS), Barcelona (Spain).
DU PLESSIS, W. P., 1999, Linear regression relationships between NDVI, vegetation and rainfall in Etosha
National Park, Namibia. Journal of Arid Environments, 42, 235-260.
EL HAJJ,M., A.BÉGUÉ, B.LAFRANCE, O.HAGOLLE, G.DEDIEU and M.RUMEAU, 2008, Relative radiometric normalization and atmospheric correction of a SPOT 5 time series. Sensors, 8, 2774-2791.
FAO, 2008, FAOSTAT. http://faostat.fao.org/.
GERS, C. J., 2003, Remotely sensed sugarcane phenological characteristics at Umfolozi, South Africa. In Proceedings of the International Geoscience And Remote Sensing Symposium (IGARSS), Toulouse (FR), pp. 3p.
HSIAO,T.C., 1973, Plant responses to water stress. Annual Review of Plant Physiology, 24 519-570.
HUMBERT,R.P., 1968, The Growing of Sugarcane. Elsevier, Amsterdam (NL).
INMAN-BAMBER,N. and D.SMITH, 2005a, Water relations in sugarcane and response to water deficits. Field
Crop Research, 92, 185-202.
INMAN-BAMBER, N. G., G. D.BONNETT, D. M. SMITH and P.J. THORBURN, 2005b, Sugarcane physiology:
Integrating from cell to crop to advance sugarcane production. Field Crops Research, 92, 115-117.
KRISHNA RAO, P. V., V. VENKATESWARA RAO and L. VENKATARATNAM, 2002, Remote sensing : A
technology for assessment of sugarcane crop acreage and yield. Sugarcane Technology, 4, 97-101. LAMB,D.W., 2000, The use of qualitative airborne multispectral imaging for managing agricultural crops - a
case study in south-eastern Australia. Australian Journal of Experimental Agriculture, 40, 725-738.
LEBOURGEOIS,V., A. BEGUE, P.DEGENNE and E.BAPPEL, 2007, Improving sugarcane harvest and planting
monitoring for smallholders with geospatial technology: the Reunion Island experience. International Sugar Journal, 109, 109-117.
LEE-LOVICK,G. and L.KIRCHNER, 1991, Limitations of Landsat TM data in monitoring growth and predicting yields in sugarcane. In Proceedings of the Australian Society of Sugar Cane Technologists, Bundaberg, 13, pp. 124-131.
MARTINE, J.-F., 2003, Modélisation de la production potentielle de la canne à sucre en zone tropicale, sous
conditions thermiques et hydriques contrastées - Application du modèle. Ph.D., Institut National d'Agronomie (INAPG), Paris-Grignon (F).
PINTER, P.J., J. L.HATFIELD, J.S.SCHEPERS, E. M.BARNES, M.S. MORAN, C.S. T.DAUGHTRY and D.R.
UPCHURCH, 2003, Remote Sensing for Crop Management. Photogrammetric Engineering & Remote
Sensing, 69, 647–664.
PRINCE, S. D. and C. J. TUCKER, 1986, Satellite remote sensing of rangelands in Botswana. II. NOAA
AVHRR and herbaceous vegetation
International Journal of Remote Sensing, 7, 1555-1570.
PROMBUROM,P., A.JINTRAWET and M.EKASINGH, 2001, Estimating sugarcane yields with Oy-Thai interface.
In Proceedings of the XXIVth Congress of the International Society of Sugar Cane Technologists (ISSCT), Brisbane (Australia), 24, pp. 81-86.
RICHTER,R., 1998, Correction of satellite imagery over mountainous terrain. Applied Optics, 37, 4004-4015.
RUDORFF, B. F. T. and G. T. BATISTA, 1990, Yield estimation of sugarcane based on
agrometeorological-spectral models. Remote Sensing of Environment, 33, 183-192.
SCHMIDT, E.J., G.NARCISO, P. FROST and C.GERS, 2000, Application of remote sensing technology in the
South African sugar industry : Review of recent research findings. In Proceedings of the 74th South African Sugar Technologists' Association (SASTA), Durban (South Africa), pp. 19 p.
SIMOES,M. D.S., J.V.ROCHA and R.A.C.LAMPARELLI, 2005a, Spectral variables, growth analysis and yield
of sugarcane. Scientia Agricola, 62, 199-207.
______, 2005b, Growth indices and productivity in sugarcane. Scientia Agricola, 62, 23-30.
THOMPSON, G. D., 1988, Comparison of the growth of a plant and a first ratoon crops at Pongola. In
Proceedings of the South African Sugar Cane Technologists (SASTA), 62, pp. 180-184.
TUCKER, C.J., 1979, Red and photographic infrared linear combinations for monitoring vegetation. Remote
Sensing of the Environment, 8, 127-150.
UENO,M., Y.KAWAMITSU, L.SUN, E.TAIRA and K.MAEDA, 2005, Combined applications of NIR, RS and GIS for sustainable sugarcane production. In Proceedings of the International Society of Sugar Cane Technologists (ISSCT), Guatemala, pp. 204-210.
XAVIER, A. C., B. F. T. RUDORFF, L. M. S. BERKA and M.A. MOREIRA, 2006, Multi-temporal analysis of