Publisher’s version / Version de l'éditeur:
2018 40th Annual International Conference of the IEEE Engineering in Medicine
and Biology Society (EMBC), pp. 303-306, 2018-10-29
READ THESE TERMS AND CONDITIONS CAREFULLY BEFORE USING THIS WEBSITE. https://nrc-publications.canada.ca/eng/copyright
Vous avez des questions? Nous pouvons vous aider. Pour communiquer directement avec un auteur, consultez la première page de la revue dans laquelle son article a été publié afin de trouver ses coordonnées. Si vous n’arrivez pas à les repérer, communiquez avec nous à PublicationsArchive-ArchivesPublications@nrc-cnrc.gc.ca.
Questions? Contact the NRC Publications Archive team at
PublicationsArchive-ArchivesPublications@nrc-cnrc.gc.ca. If you wish to email the authors directly, please see the first page of the publication for their contact information.
NRC Publications Archive
Archives des publications du CNRC
This publication could be one of several versions: author’s original, accepted manuscript or the publisher’s version. / La version de cette publication peut être l’une des suivantes : la version prépublication de l’auteur, la version acceptée du manuscrit ou la version de l’éditeur.
For the publisher’s version, please access the DOI link below./ Pour consulter la version de l’éditeur, utilisez le lien DOI ci-dessous.
https://doi.org/10.1109/EMBC.2018.8512230
Access and use of this website and the material on it are subject to the Terms and Conditions set forth at
Bioinformatics identification of drug gene modules: application to clear
cell carcinoma of the ovary
Tchagang, Alain B.
https://publications-cnrc.canada.ca/fra/droits
L’accès à ce site Web et l’utilisation de son contenu sont assujettis aux conditions présentées dans le site LISEZ CES CONDITIONS ATTENTIVEMENT AVANT D’UTILISER CE SITE WEB.
NRC Publications Record / Notice d'Archives des publications de CNRC:
https://nrc-publications.canada.ca/eng/view/object/?id=e9e93e6d-40a5-4851-a7fe-df388c864a69 https://publications-cnrc.canada.ca/fra/voir/objet/?id=e9e93e6d-40a5-4851-a7fe-df388c864a69
Abstract— Targeted therapy is a treatment that targets the cancer’s specific genes, proteins, or the tissue environment that contributes to cancer growth and survival. Identification of therapeutics targets is a very challenging problem in bioinformatics. An integrative and iterative approach for the identification of drug-gene modules (i.e. groups of genes and drugs such that genes in the same module may regulate each other and are targets of some of the drugs in the same module) is developed. Application to clear cell carcinoma of the ovary data reveals several drug-gene modules and a target network that may play important roles in treating this disease.
I. INTRODUCTION
Clear cell carcinoma (CCC) is known to be less sensitive to platinum-based treatment and to be associated with a worse prognosis than other subtypes of epithelial ovarian cancer (EOC) [1]. To improve the survival of patients with CCC, mechanisms governing carcinogenesis have to be better understood and novel treatment schemes and therapeutic targets developed.
Targeted therapies are currently the focus of much anticancer drug development, and represent a cornerstone of precision medicine. Many targeted cancer therapies have been approved by the Food and Drug Administration (FDA) to treat specific types of cancer. Recent studies have demonstrated that two-thirds of the failures across all therapeutic areas were attributable to a lack of efficacy [2]. Although ‘biologicals’ have enlarged the space of druggable molecules, the number of appropriate drug targets is still limited. The cost and time spent in searching for drug targets make it impossible to screen all possible molecules targeted by drugs in labs.
Under these conditions, some computational approaches have been proposed to identify or predict drug targets in silico. In particular, the accumulation of various types of omics data, such as gene expression (GE) and protein structure, makes it possible to develop more efficient computational methodologies to predict drug targets. Assuming that drugs with the same mechanism of action (MOA) will induce similar GE, [3] proposed a new way to identify drugs that may target the same proteins. Assuming that drugs with similar MOA bind to similar pockets on the protein surfaces, some methodologies have been developed
Research supported by the National Research Council of Canada. A. B. Tchagang: Digital Technologies Research Centre, National Research Council Canada, 1200 Montreal Rd, Ottawa, Ontario, K1A 0R6, Canada. Corresponding author: ABT, phone: 613-993-5716; e-mail: alain.tchagang@nrc-cnrc.gc.ca.
to predict drug-protein interactions by investigating the similarity between binding profiles of candidate ligands and known drugs [4]. Assuming that proteins with similar functions may be bound by same drugs while drugs with similar chemical structures possibly target same proteins, [5] proposed a novel model to predict drug-protein interactions by integrating chemical structure and genomic sequence information. These early methods have been developed to predict drug targets based on different kinds of omics and drug property data, and can be classified into three classes [6]: methods based on GE profiles, methods based on molecular networks, and methods based on drug effects. In this study, an iterative and integrative approach that combined three types of data and iterate among them for the identification of drug targets or drug-gene modules (i.e. subgroups of genes and drugs such that genes in the same module may regulate each other and some are targets of the drugs in the same module) is developed.
II. MATERIALS AND METHODS
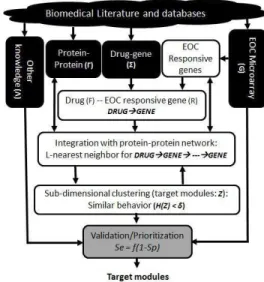
Promising therapeutic targets are identified in this study using an approach that can be divided into three steps: the Biomedical Literature and Databases Mining, the Transcriptomic Data Integration, and the Target Validation and Prioritization: Figure 1.
Figure 1: Model of the three steps algorithm
More precisely, OMICs data were compiled from the biomedical literature. From the healthy and CCC microarray data, the set of CCC responsive genes were identified. A gene was considered to be responsive in CCC if its
expression level did change by at least 0.5 in Log10 in any of
Application to Clear Cell Carcinoma of the Ovary
the five staging states of the disease. Each one of the ten randomly constructed GE matrices was then integrated with drug-gene, protein-protein interactions (PPI) and the subcellular location matrices for modules identification. The ten results from the ten GE matrices were then combined in a (70%) majority voting scheme to produce a single estimation of each target module.
A. Biomedical literature and databases mining (BLDM)
The goal of the BLDM (dark boxes of Figure 1) is to mine the rich and massive biomedical literature and databases for relevant CCC datasets: GE, drugs, drug-gene interactions, PPI, and any other biological knowledge relevant for CCC targets identification and prioritization. For this particular study, 147 cancer drugs approved by the FDA were compiled from the NIH-NCI [http://www.cancer.gov]. Well-known interactions among drugs and genes were taken from the Drug Gene Interaction Database [http://dgidb.genome.wustl.edu]. Interactions among proteins and the human annotations datasets were compiled from the BIOGRID database [https://thebiogrid.org]. The healthy ovaries and the CCC GE data were downloaded from the GEO database [https://www.ncbi.nlm.nih.gov/geo/]. They were all assayed using the Affymetrix GeneChip Human Genome U133A Array, pre-processed and normalized using quantile-normalization, and randomly organized into ten 2D matrices. Other biological knowledge such as the subcellular location of the protein was downloaded from [http://www.genecards.org/].
The outputs of the BLDM are four matrices A(|G|×|T|), Λ(|G|×|S|), Σ(|G|×|D|) and Γ(|G|×|G|) representing the GE, subcellular location, drug-gene interactions and PPI respectively. |G| = 22,283 is the number of probes/genes: G = {g1, …, gg, …, g|G|}, |T| = 5 the number of tumor stage:
T = {healthy, stage I, stage II, stage III, stage IV}, |S| = the number of subcellular location: S = {s1, s2, …, ss, …, s|S|}
and |D| = 147 the number of drugs: D = {d1, d2, …, dd, …,
d|D|}. The entries of Λ, Σ and Γ are either 1 (association) or 0
(no association), and that of G real numbers representing the GE levels: A(|G|×|T|) = [agt], where agt is the expression level
of the gth gene/probe in the tth tumor stage.
B. Transcriptomic data integration (TDI)
The TDI (white boxes Figure 1) takes as inputs Σ, Λ, Γ and A, and outputs subgroups of genes (Im) with similar
behavior with the known target genes, that are close to each other in the PPI network, their subcellular locations (Lm),
subset of drugs (Jm) that target some of these genes and its
p-value: Mm = {Im, Jm, Lm, p-value}. Mm is the set of target
modules or drug gene modules.
Mathematically, the goal is to solve the following equation:
h(Σ, Λ, Γ, A) = Mm = {Im, Jm, Lm, p-value}. (1)
The function h(.) is unknown and is defined by the proposed algorithm. Σ, Λ, Γ and A are known from the literature, and Mm = {Im, Jm, Lm, p-value} are unknown and correspond to
the set of solutions, i.e. the output of the algorithm.
Algorithm - defines the function h(.) --- Algorithm inputs
- A(|G|×|T|), GE matrix. Σ (|G|×|D|), drug-gene targets matrix. Γ(|G|×|G|), PPI matrix. Λ(|G|×|S|), subcellular location matrix. G = {g1, g2, …, gg, …, g|G|}, set of genes. T = {t1, t2, …, tt, …, t|T|}, set
of CCC states. D = {d1, d2, …, dd, …, d|D|}, set of drugs. S = {s1,
s2, …, ss, …, s|S|}, set of subcellular locations. L = integer that
defines the closeness in the PPI network. δ = mean square residue threshold.
Algorithm output
- M = {M1, M2, …, Mm, …, M|M|}, set of drug-gene modules, with
Mm = {Im, Jm, Lm, p-value} m = 1 to |M|
Algorithm steps
a- Identification of set Z = {z1, z2, , zz, , z|Z|}of CCC responsive genes.
b- Identification of the set Y = {y1, y2, …, yy, …, y|Y|} of genes known
to be associated with one or more drugs, and the set of drugs F = {f1, f2, …, ff, …, f|F|}, that target each one of these genes.
c- Identification of the initial reference list of genes R = {r1, r2, …, rr, …, r|R|} = Z∩Y.
d- Identification of drug-gene modules. For each gene rr in R, identify
other genes in Z with similar behavior as rr during the T tumor
stage, that are the L-NN of rr in the PPI network as followed:
1. Im = Z. Initialize Im with the genes responsive in CCC.
2. Refine genes in Im to only consider the ones that are the
L-NN of rr in the PPI network.
3. Define X(|Im|×|T|) the gene expression matrix of genes in
Im across the T staging tumor of CCC.
4. Construct X2 same dimension as X, with constant value
in columns using the expression level of gene rr.
5. Compute X2 = X-X1.
6. Refine Im to only consider genes with constant values in
X2. This is easily done by considering only genes
whose max(X2(n,:))-min(X2(n,:)) < ε, with ε 0 (See
proof below, n is a row of X2, and X2(n,:) is a row
element). This final list of genes Im is considered to be
the ones with similar behavior as rr.
7. The list of drugs Jm targeting some of these genes is
identified as followed: Jm = F(Im∩Y), and their
subcellular locations as Lm = S(Im).
8. Hypergeometric distribution is used to evaluate the statistical significance of the drug-gene module by computing its p-value using Fisher’s exact test.
9. Finally, the mth module is given by:
Mm = {Im, Jm, Lm, p-value}.
--- Similarity among genes in a module is defined using the minimum mean square residue (MMSR). That is, given the GE matrix of the mth module X(|Im|×|T|) = X[xit], its MMSR
is computed using Equation 2.
2 ,
)
(
|
||
|
1
)
(
T t I i T I t I iT it m m m mx
x
x
x
T
I
X
H
. (2)Genes in the same module will have similar behavior if their H(X) < δ, with δ 0. This metric is shown to yield more co-regulated genes compared to correlation [7]. Recall that in
Equation 1, Im is a subset of G. |Im| and |T| are the number of
genes and tumor stage in X respectively, xiT is the mean of
the ith GE level over all tumor stage, xIt is the mean of the t th
tumor stage over the Im GE levels, and xImT is the mean of all
the values (GE levels) of X. δ 0 is a given threshold defined by the user. In fact, one can easily show that H(X) = δ = 0 if X = [x(i,t)] = [ui + vt] = [ui] + [vt], where [ui] a
matrix with constant values on rows, and [vt] a matrix with
constant values on columns [7-8].
As described in the above pseudo-codes (Steps 3 to
d-6), genes with similar behavior are extracted from X(|Im|×|T|)
using the following approach. For a given reference gene, a new matrix X1 is constructed with constant values in its
columns. That is, all rows in X1 are identical to the
expression of the reference gene. Then X2 is calculated
as X2 = X - X1. Genes with similar behavior in X correspond
to the ones with constant values on rows in X2. This step is
easily performed by identifying the set of rows of X2 such
that max(X2 (n,:)) - min(X2 (n,:)) < δ, with δ → 0. For
simulation, let’s consider the matrix X in a 2D space, with coherent values cluster (genes with similar behavior) in it, corresponding to rows 1, 3 and 4 (Equation 3). By subtracting from X matrix X1 (constructed using the first row
of X: (1 3 5 2), used as the reference gene, a new matrix X2 is generated whose rows 1, 3 and 4 correspond to
the submatrix with constant values on rows.
1 2 0 2 1 7 1 2 2 5 3 1 2 5 3 1 2 5 3 1 2 5 3 1 3 3 3 3 3 2 2 3 2 1 1 1 1 1 3 3 3 3 0 0 0 0 2 5 3 1 1 4 2 0 5 8 6 4 2 5 3 1 X X X (3)
Note that, the same cluster can be obtained by using any of the rows 1, 3 and 4.
C. Target Validation and Prioritization (TVP)
Targets are validated (grey box of Figure 1) by computing the area under the curve of the receiver operating characteristic (ROC) of each module separately. That is for each member of a module and for the whole member of the group. The ROC function is defined as Se = f (1 - Sp). This function describes the relationship between the true-positive rate (sensitivity (Se)) and the false-positive rate (1 – specificity (Sp)) for different screening cutoff points.
III. RESULTS AND DISCUSSIONS
Analysis revealed 55 CCC target modules, potential drug-gene interactions and a target network that may find applications in CCC therapeutics and predictive markers for drugs resistance.
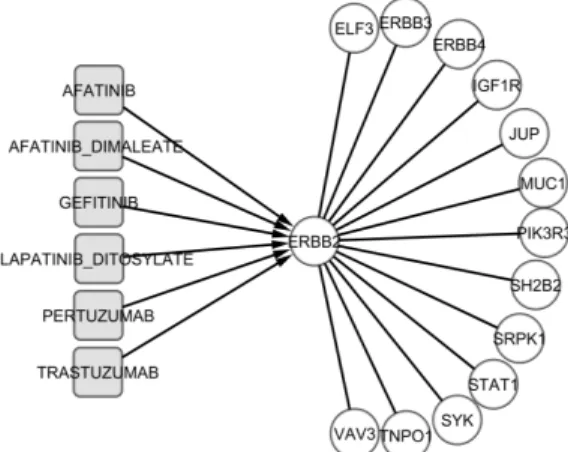
Figure 2: ERBB2 drug-gene module
Figure 2 shows example of the ERBB2 module identified
using ERBB2 as the reference gene, with H(ERRB2) < 1 and p-value < 1e-05. In this module, five drugs approved by FDA are shown to target ERBB2. ERBB2 is also shown to interact with 13 other genes in a co-regulation manner. Several genes in this module exhibit significant AUC (≥ 0.9). More details relative to this module are described in Table 1 below.
Interestingly and by design of our drug-gene modules, a module contains at least one gene that has been demonstrated experimentally to be the target of one or more drugs approved by FDA. Thus the druggability of the 55 identified modules is assured. Additionally, genes in the same module have similar behavior. They may either regulate each other or may be co-regulated. This is supported by the fact that they are close to one another in the protein-protein network. Co-regulated genes are often functionally (physically, spatially, genetically, and/or evolutionarily) related [9].
Such a priori known relationships can provide support for the fact that genes in the same modules may be induced directly or indirectly by some of the drugs in the respective modules. These target modules can then be used to design optimal compounds/drugs with control toxicity and side-effects. They can be used as predictive markers for drug sensitivity or drugs resistance, and can even be used to improve the functionalities of old drugs. For example, Gefitinib is the first selective inhibitor of epidermal growth factor receptor's (EGFR) tyrosine kinase domain that was designed to target the EGFR family of receptors [10]. But recent studies have shown that Gefitinib also induce the expression of several other genes including IGF1R, which can be used as a predictor for resistance to Gefitinib [11]. In this study, we showed that ERBB1, ERBB2, ERBB3, ERBB4 and IGF1R are part of the same module (ERBB2 module: Table 1).
Combination of the 55 modules yielded several motivating target networks, among which some interesting regulatory axes: MET—ALK—CBLC, AURKA—BIRC5— HIST1H2BG, TOP1—TOP2A—ISG15, IRF4—TOP1— HIST1H1C and IRAK1—SLC2A1—NEIL3—SMARCA4— HSPB1—TNF—CELSR2.In the regulatory axis AURKA— BIRC5—HIST1H2BG for example, the baculoviral inhibitor of apoptosis repeat-containing 5 (BIRC5) interacts with Cisplatin, Doxorubicin, Paclitaxel and Gemcitabine. BIRC5 is a member of the inhibitor of apoptosis family, and has been suggested to be a target for cancer therapy that would discriminate between transformed and normal cells [12]. Aurora A kinase (AURKA) a direct target of Paclitaxel is shown to interact with 47 genes. It has recently been shown that AURKA gene is highly expressed in ovarian cancer, and knockdown of AURKA significantly repressed ovarian cancer cell-induced angiogenesis in nude mice and may provide potential therapeutic target for the disease [13]. Interestingly AURKA interacts with BIRC5 and BIRC5 interacts with HIST1H2BG an extracellular protein which has only been recently associated with prostate cancer [14].
Table 1: ERRB2 drug gene module
Among the related pathways of HIST1H2BG is the ‘activated PKN1 stimulates transcription of androgen
receptor (AR) regulated genes KLK2 and KLK3’. It is well
known that EOC arises from ovarian surface epithelial cells, which express the androgen receptor, and androgen stimulation of ovarian surface epithelial cells results in increased proliferation and protection from apoptosis. These findings pending experimental validations, suggest that the regulatory axis AURKA—BIRC5—HIST1H2BG plays a very important role in CCC and represent potential therapeutic target.
IV.CONCLUSION
In this study an integrative and iterative approach was developed for biomedical applications. Using this method, it is shown that the integration of transcriptomics, drug-gene and PPI knowledge compiled from the biomedical literature and databases can lead to novel insights into the biology of CCC, and may be applicable to the discovery of CCC targets which may lead to robust drug design for therapeutic applications.
ACKNOWLEDGMENT
This work is supported by the National Research Council (NRC) of Canada. We would like to acknowledge Dr. Jennifer Hill, from the Human Health Therapeutics Portfolio of NRC for her constructive comments and suggestions.
REFERENCES
[1] W.E. Winter, D.L. Maxwell, C. Tian, et al., “Gynecologic Oncology Group Study Prognostic factors for stage III epithelial ovarian cancer: a Gynecologic Oncology Group Study,” J Clin Oncol., 2007;25:3621–3627.
[2] J. Arrowsmith, “Trial watch: Phase II failures: 2008–2010,” Nature
Reviews Drug Discovery, 2011;10:328-329.
[3] F. Iorio, R. Bosotti, E. Scacheri et al., “Discovery of drug mode of action and drug repositioning from transcriptional responses,” PNAS, vol. 107, no. 33, pp. 14621–14626, 2010.
[4] M. J. Keiser, V. Setola, J. J. Irwin et al., “Predicting new molecular targets for known drugs,” Nature, vol. 462, no. 7270, pp. 175–181, 2009.
[5] Y. Yamanishi, M. Araki, A. Gutteridge, W. Honda, and M. Kanehisa, “Prediction of drug-target interaction networks from the integration of chemical and genomic spaces,” Bioinformatics, vol. 24, no. 13, pp. i232–i240, 2008.
[6] Yan-Fen Dai and Xing-Ming Zhao, “A Survey on the Computational Approaches to Identify Drug Targets in the Postgenomic Era,”
BioMed Research International, vol. 2015, Article ID 239654, 9
pages, 2015. doi:10.1155/2015/239654.
[7] A.B. Tchagang, A.H. Tewfik, “DNA microarray data analysis: a novel biclustering algorithm approach,” EURASIP Journal on Applied
Signal Processing, 2006:60.
[8] A.B. Tchagang, K.V. Bui, McGinnis, P.V. Benos, “Extracting biologically significant patterns from short time series gene expression data,” BMC Bioinformatics, 2009;10:255.
[9] P. Michalak, “Coexpression, coregulation, and cofunctionality of neighboring genes in eukaryotic genomes,” Genomics, 2008;91:243-248.
[10] R. Sordella, “Gefitinib-Sensitizing EGFR Mutations in Lung Cancer Activate Anti-Apoptotic Pathways,” Science, 2004;305:1163-1167. [11] N. Peled, M. Wynes, N. Ikeda, et al., “Insulin-like growth factor-1
receptor (IGF-1R) as a biomarker for resistance to the tyrosine kinase inhibitor gefitinib in non-small cell lung cancer,” Cellular Oncology, 2013;36:277-288.
[12] L. Tracey, A. Pérez-Rosado, M. Artiga, et al., “Expression of the NF-κB targets BCL2 and BIRC5/Survivin characterizes small B-cell and aggressive B-cell lymphomas, respectively,” The Journal of
Pathology, 2005;206:123-134.
[13] C. Wang, Q. Yan, M. Hu, et al., “Effect of AURKA Gene Expression Knockdown on Angiogenesis and Tumorigenesis of Human Ovarian Cancer Cell Lines,” Targeted Oncology, 2016;11:771-781.
[14] L. Mengual, J. Lozano, M. Ingelmo-Torres, et al., “Using gene expression from urine sediment to diagnose prostate cancer: development of a new multiplex mRNA urine test and validation of current biomarkers,” BMC Cancer, 2016;16.