doi: 10.3389/fmicb.2019.02857
Edited by: Fred Asiegbu, University of Helsinki, Finland Reviewed by: Therese Ouellet, Agriculture and Agri-Food Canada (AAFC), Canada Thomas Miedaner, University of Hohenheim, Germany Christina Cowger, Plant Science Research Unit (USDA-ARS), United States *Correspondence: Ludovic Bonhomme ludovic.bonhomme@inra.fr
Specialty section: This article was submitted to Fungi and Their Interactions, a section of the journal Frontiers in Microbiology Received: 30 August 2019 Accepted: 25 November 2019 Published: 11 December 2019 Citation: Fabre F, Bormann J, Urbach S, Roche S, Langin T and Bonhomme L (2019) Unbalanced Roles of Fungal Aggressiveness and Host Cultivars in the Establishment of the Fusarium Head Blight in Bread Wheat. Front. Microbiol. 10:2857. doi: 10.3389/fmicb.2019.02857
Unbalanced Roles of Fungal
Aggressiveness and Host Cultivars in
the Establishment of the Fusarium
Head Blight in Bread Wheat
Francis Fabre1, Joerg Bormann2, Serge Urbach3, Sylvie Roche4, Thierry Langin1and
Ludovic Bonhomme1*
1Université Clermont Auvergne, INRAE, UMR 1095 Genetics, Diversity and Ecophysiology of Cereals, Clermont-Ferrand,
France,2Department of Molecular Phytopathology, Institute of Plant Science and Microbiology, University of Hamburg,
Hamburg, Germany,3Functional Proteomics Platform, Institute of Functional Genomics, CNRS UMR 5203 INSERM U661,
Montpellier, France,4INRAE, Unité Experimentale 1375, Phénotypage au Champs des Céréales (PHACC),
Clermont-Ferrand, France
Fusarium head blight (FHB), caused mainly by Fusarium graminearum, is the foremost destructive disease of cereals worldwide. Effector-like molecules produced by F. graminearum play key roles in the infection process and are assumed to be one of the essential components of the pathogen’s aggressiveness. However, their nature and role in the disease are still largely misunderstood. As a mean to provide relevant information about the molecular determinism of F. graminearum aggressiveness, we surveyed three F. graminearum strains on three wheat cultivars contrasted by their susceptibility to FHB. F. graminearum strains revealed large differences in aggressiveness which were mostly unchanged when facing hosts of contrasted susceptibility, suggesting that their behavior rely on intrinsic determinants. Surveying the fungal mass progress and the mycotoxin production rate in the spikes did not evidence any simple relationship with aggressiveness differences, while clues were found through a qualitative and quantitative characterization of the three strain proteomes established in planta especially with regards to early synthesized putative effectors. Independently of the wheat cultivar, the three F. graminearum strains produced systematically the same protein set during the infection but substantial differences in their abundance enabled the categorization of fungal aggressiveness. Overall, our findings show that the contrasts in F. graminearum aggressiveness were not based on the existence of strain-specific molecules but rather on the ability of the strain to ensure their sufficient accumulation. Protein abundance variance was mostly driven by the strain genetics and part was also influenced by the host cultivar but strain by cultivar interactions were marginally detected, depicting that strain-specific protein accumulations did not depend on the host cultivar. All these data provide new knowledge on fungal aggressiveness determinants and provide a resourceful repertoire of candidate effector proteins to guide further research.
Keywords: Fusarium graminearum, Gibberella zeae, aggressiveness, proteomics, effector proteins, plant-pathogen interactions, bread wheat
of pathogenicity and is defined as the degree of damage caused by the pathogen to the host (Van der Plank, 1968; Pariaud et al., 2009; Delmas et al., 2016). When a plant-pathogen interaction is established, proteins called effectors are synthesized to promote pathogenicity by suppressing the host’s immune response and inducing physiological manipulation of the plant (Kamoun, 2006). Effector proteins can be localized in the cell wall surface or secreted directly into the plant cells to target specific host functions (Kamoun, 2006; Lo Presti et al., 2015; Sperschneider et al., 2016; Jones et al., 2018). They can also play crucial roles in the degradation of complex compounds like the plant cell wall, in the initiation of infection and for obtaining nutrients from plant host reserves (Hao et al., 2019). Effector proteins are probably an essential component of the pathogen’s aggressiveness, nevertheless the molecular mechanisms underlying their functions are for the most part unknown, especially in fungus (Yi and Valent, 2013; van Schie and Takken, 2014; Jia and Tang, 2015; Lo Presti et al., 2015).
One relevant pathosystem for assessing the importance of pathogen’s aggressiveness during the interaction with the host is the relationship between bread wheat and Fusarium graminearum Schwabe (Hypocreales: Nectriaceae) (teleomorph: Gibberella zeae). F. graminearum is the most prominent causal agent of the FHB in Europe, Canada, and United States (McMullen et al., 1997; Brennan et al., 2003; Steiner et al., 2017). Severe outbreaks regularly result in significant yield losses (Parry et al., 1995; Xu and Nicholson, 2009; McMullen et al., 2012; Chen et al., 2019), as well as altering nutritional grain quality and inducing a major health problem throughout the food chainvia grain contamination by mycotoxins (Liu et al., 2019). DON is the most commonly found toxin in cereals (Placinta et al., 1999). Previous works showed that DON could have a role in fungal spread beyond the initial infection (Bai et al., 2002) by facilitating the spreading of F. graminearum from spikelets into the rachis which might induce the switch from biotrophy to necrotrophy (Bönnighausen et al., 2018). DON is also known to allow the inhibition of host protein synthesis (Walter et al., 2010), and is believed to be an aggressiveness factor rather than a pathogenicity factor (Proctor et al., 1995; Pasquet et al., 2016).
Although F. graminearum strains are not all identical in their ability to induce disease (Carter et al., 2002; Goswami and Kistler, 2005), the molecular mechanisms and life traits Abbreviations: ANOVA, Analysis of variance; Cv, Cultivar effect; DON, Deoxynivalenol; FDR, False discovery rate; FHB, Fusarium head blight; hpi, hours post-inoculation;S+Cv, Strain+Cultivar effect; S×Cv, Strain×Cultivar effect; S, Strain_effect.
differences in F. graminearum strain aggressiveness at the genome (Carter et al., 2002; Gale et al., 2002;Cumagun et al., 2004; Laurent et al., 2017, 2018) or at the transcriptome scale (Harris et al., 2016;Puri et al., 2016). Many other studies have also identifiedF. graminearum genes involved in pathogenicity and some appeared to have only a quantitative effect (i.e., aggressiveness-related genes) (Pariaud et al., 2009). These genes encode secreted proteins and effectors that may play roles in the infection course (Krijger et al., 2014;Lu and Edwards, 2015; Chetouhi et al., 2016;Fabre et al., 2019). Furthermore, previous genomics studies have identified more than 600 genes coding for secreted proteins (Brown et al., 2012; King et al., 2015). Some have been identified at the proteome level (Lowe et al., 2015;Fabre et al., 2019) suggesting thatF. graminearum could synthesize a large number of proteinous effectors.
In a previous study, we investigated the molecular dialogue dynamics taking place during the early stages of the FHB progress in bread wheat (Fabre et al., 2019). This has highlighted dual protein regulations between 48 hpi and 72 hpi both in F. graminearum and in wheat, emphasizing that regulated F. graminearum proteins could dynamically adjust to the plant physiological responses (Fabre et al., 2019). Fusarium graminearum effectors have been shown to be accumulated at specific stages of infection to achieve precise roles in the progress of the interaction, especially at 72 hpi during symptoms appearance (Fabre et al., 2019). However, this previous study was carried out on only one aggressive strain and one susceptible wheat cultivar. Evaluating the specificity of these proteome adjustments in hosts and pathogens contrasting for their susceptibility and aggressiveness, respectively, represents a powerful lever to identify the molecular determinants that drive the development of the disease.
The aim of this work is to question the potential links between the intrinsic characteristics of differentF. graminearum strain proteomes with their respective aggressiveness in planta, as well as the impact of different wheat genetic backgrounds on the accumulation of the pathogen proteins. The qualitative and quantitative characterizations of the threeF. graminearum proteomes at 72 hpi were performed with a special interest on effectors and proteins coded by known F. graminearum aggressiveness-related genes. In addition, three variables classically used for the F. graminearum aggressiveness determination were described, (i) the severity of symptoms induced by the strains, (ii) the fungal mass development in planta, and, (iii) the DON synthesis rate of each strain. The joint analysis of all these data provide new insights into the determinism ofF. graminearum aggressiveness at the early stage of the disease progress.
MATERIALS AND METHODS
Plant Growth and Fusarium
graminearum Inoculation
Experiments were conducted on three wheat cultivars of contrasting susceptibility to FHB, including in decreasing order of susceptibility cv. Recital, cv. Cadenza and cv. Renan as ranked from previous field observations. Recital and Renan are among the most contrasted cultivars of the french wheat collections (Gervais et al., 2003) while Cadenza is considered as intermediate. For each wheat cultivar, seeds were sown in buckets and kept at 20◦
C to allow germination. Vernalization was performed at 4◦
C for 8 weeks, then plantlets were transplanted in 4-L pots and transferred in a growth cabinet with optimal conditions to allow tillering and synchronized flowering. Twenty four plants per wheat cultivar were prepared for a total of 72 wheat plants divided in three randomized complete blocks in the growth cabinet and surrounded by additional plants to control any edge effects. Automatic watering was installed, and the daily photoperiod was set at 16-h daylight for a temperature of 20◦
C and 8-h darkness at 18◦
C. Relative humidity was maintain at 80% during day and night.
Fusarium graminearum strains MDC_Fg1, MDC_Fg13, and MDC_FgU1, all originating from France, were selected for their contrasting aggressiveness (based on field observations). The preparation of theF. graminearum inocula was performed as described in Fabre et al. (2019). The three strains were individually inoculated in six plants of each wheat cultivar i.e., six plants × 3 F. graminearum strains for a total of 18 plants per cultivar. For each cultivar, inoculation was performed at the mid-anthesis stage by depositing 10 µl of inoculum in the floral cavity of six contiguous spikelets located in the middle zone of three synchronized spikes per plant. The last six plants were inoculated with water and were used as control. For each cultivar×strain combination, the point-inoculated spikelets of the three spikes of three independent plants were specifically collected 72 h after the inoculation (hpi), while the ones of the three remaining plants were collected at 168 hpi. For each cultivar×strain combination, three biological replicates were designed at both time points; they corresponded to one individual plant which was characterized by the pool of all inoculated spikelets from three spikes. Fungal mass quantification in wheat spikes,F. graminearum DON synthesis rate and proteomics were performed on the same plant material.
Symptom and Fungal Development
Monitoring
Symptoms were monitored by visual inspection and scored every 24 h from 0 to 168 hpi (hours post-inoculation) using a 5-level rating scale (Figure 1). A score of 0 was given to spikelets which had no visible symptom, a score of 1 was given when the first yellowing spot appeared, a score of 2 when a brown spot was visible, a score of 3 when browning gained the whole spikelet and a score of 4 when aerial mycelium became visible. Until 72 hpi, symptom monitoring was profiled on the whole set of plants
(six plants for each cultivar×strain combination) while the range 96 hpi to 168 hpi was monitored from the remaining unsampled plants (three plants for each cultivar×strain combination).
Fungal mass was assessed at 72 and 168 hpi from the three biological replicates of each cultivar×strain combination, using qPCR method. For each biological replicate, the measurements made for each sample were performed nine times and were considered as technical replicates. Water-inoculated spikes were used as control. Frozen spikes from the same plant were mixed and finely ground under liquid nitrogen using pestle and mortar. The DNA-isolation was performed on 100 mg of ground material (i.e., 72 and 168 hpi) using CTAB buffer (100 mM Tris–HCl pH 8.0, 1.4 M NaCl, 20 mM EDTA and 2% cetyltrimethyl ammonium bromide). Samples were incubated at 65◦
C during 1 h and centrifuged at 10 000 g for 10 minutes at room temperature. DNA was recovered by adding 1 volume of chloroform and centrifuged as described above. Precipitation of the nucleic acids was performed using 1 volume of isopropanol and a centrifugation at 12 000 g for 20 minutes at 4◦
C. DNA has been cleaned with 70% ethanol and dissolved in 100 µL TE buffer (10 mM Tris HCl pH 8.0, 1 mM EDTA). The DNA concentrations of each sample were measured with the Tecan’s high performance Safire2TM microplate reader. Concentrations of each sample were normalized by dilution to 100 ng/µL, 1 µl was used for qPCR using Roche LightCycler R
480 SYBR Green I Master for each samples. Amplification was performed on theF. graminearumβ-tubulin
gene (Forward: TGCTGTTCTGGTCGATCTTG/Reverse:
GACGGAAGTTTGGACGTTG) as described in Nguyen et al. (2013). Fungal DNA mass was estimated using aF. graminearum DNA dilution range (0.1–100 ng).
DON Synthesis Rate by the Three
F. graminearum Strains
DON synthesis rate per fungal mass unit was measured following the methodology described by Nguyen et al. (2013). DON measurement was realized at 72 and 168 hpi from the three biological replicates of each cultivar×strain combination and using water-inoculated samples as control. Each measurement was repeated nine times as technical replicates. For each sample, 50 mg of fresh ground material was suspended in 500 µl of distilled water and the extract was vortexed and centrifuged. A volume of 50 µl of the supernatant was used for DON quantification using the DON ELISA technique (RIDAscreen DON kits; R-Biopharm AG, Darmstadt, Germany. Detection range: 0.2 ppm to 6 ppm) and following the manufacturer’s instructions. In order to estimate the DON synthesis rate by fungal mass unit, each DON quantity determined by the ELISA method was subsequently normalized with the mass of mycelium quantified in the sample. Milligrams of mycelium per gram of fresh ground sample were computed by referring to the number ofβ-tubulin gene copies per milligram mycelium of the F. graminearum DNA dilution range (0.1–100 ng) as described in Voigt et al. (2007).
FIGURE 1 | Determination of the symptom severity scale. (A) The picture represents spikelets with type-0 symptoms corresponding to asymptomatic spikelets. (B) Representation of type-1 symptoms on spikelet with the first yellowing spot. (C) The picture illustrates the type-2 symptoms characterized by a spikelet harboring the first browning spot. (D) The picture illustrates the type-3 symptoms characterized by a fully burnished spikelet. (E) The picture illustrates the type-4 symptoms characterized by a total drying of the spikelet with the visible mycelium outside the plant organ.
Protein Extraction and LC-MS/MS
Procedures
Denaturing protein extraction was achieved from the three biological replicates of each cultivar×strain combination collected at 72 hpi using the TCA/acetone procedure as described inBonhomme et al. (2012). Protein solubilization was performed in an urea-thiourea buffer [6 M urea; 2 M thiourea; 100 mM ammonium bicarbonate; 1% HaltTMProtease Inhibitor Cocktail 100X (Thermo Fisher Scientific 78429); 0.1% ProteaseMAXTM Surfactant (Promega V2071)] by following the ratio 10 µL per mg of dry matter. Protein digestion were performed as described in Fabre et al. (2019). Tandem mass spectrometry analyses were achieved using a nanoESI Q ExactiveTM HF-X Hybrid Quadrupole-OrbitrapTM Mass Spectrometer (Thermo Fisher Scientific 0726042) coupled with an Ultimate 3000 HPLC (Thermo Fisher Scientific). HPLC gradients and data acquisition parameters were set as described inFabre et al. (2019).
Identification and Quantification of
Peptides and Proteins From MS/MS Data
Database searches were performed using X!Tandem1;2010.01.01.4) specifying one possible miscleavage. Cys carboxyamidomethylation and Met oxidation were set as static and variable modification, respectively. Precursor mass and fragment mass tolerance were 10 ppm and 0.5 Da, respectively. Identifications were performed using a concatenated file including a contaminant database (trypsin, keratins, etc.), the MDC_Fg1 (13166 entries, 01/2019), MDC_Fg13 (13297 entries, 01/2019), and MDC_FgU1 (13014 entries, 01/2019) databases obtained from an in-lab re-sequencing of eachF. graminearum strain (Alouane et al., 2018). To prevent peptides derived from plant proteins from being assigned to fungal proteins, a wheat database (IWGSC, v1.0 269472 entries, 04/2017) was also used for the identification. Identified proteins were parsed and grouped using the X!TandemPipeline v0.2.35 c++ (Langella et al., 2017). Data filtering was achieved according to a peptide E-value < 0.05. Proteins were reported when they displayed at least two different peptides in the same sample and when the proteinE-value< 0.0001. The FDR (False Discovery Rate) at the
1http://www.thegpm.org/TANDEM/
peptide level assessed from searches against reversed amino acid sequences for each protein was smaller than 0.8 × 10⁻⁶. Protein and gene ontology annotations of the identifiedF. graminearum proteins were performed following the same methodology described inFabre et al. (2019). Secretion features, subcellular localization predictions and functional annotations of identified proteins were conducted as described in Fabre et al. (2019). Relative quantification of peptides was achieved using the MassChroQ software (Valot et al., 2011) by extracting ion chromatograms as described in Bonhomme et al. (2012). The normalization was performed by dividing ratios by the total peptide abundance value in each LC-MS/MS run. Subsequent statistical analyses were performed on log10-transformed normalized data.
Statistical Analyses
Results were analyzed with the R programing language v3.4.4 (R Core Team, 2018). For each time point and after validating the absence of any block/replicate effect, symptom severity monitoring were performed using generalized linear model following Poisson distribution:
log(Yijk) = µ + Si + Cvj + (Si × Cvj) + εijk, while fungal mass, DON synthesis rate and abundance variations ofF. graminearum proteins were traced using two-way ANOVA with following linear model, after checking the absence of any block/replicate effect:
Yijk = µ + Si + Cvj + (Si × Cvj) + εijk,
whereYijkrefers to individual values,µ is the general mean of the variable considered,Si is the effect of the F. graminearum strain inoculated,Cvjis the effect of the wheat cultivar infected, Si×Cvjis the interaction of the strain effect by the Cv, andεijk is the residual.
For each individual F. graminearum protein, p-values obtained from each effect were adjusted to control the FDR for independent test statistics (Benjamini and Hochberg, 1995). The FDR was < 0.05 corresponding, respectively, to p-values < 0.022, < 0.017, and < 0.00005 in the S, Cv and S×Cv effects, respectively. Fuzzy C-means clustering (Kumar and Futschik, 2007) ofF. graminearum proteins showing significant
abundance changes according to each effect tested (i.e., S and Cv) and their addition (i.e., S+Cv) was performed from Z-score transformed values and a fuzzification parameter of 2.
RESULTS
Fusarium graminearum Strains
Characterization Through Their Ability to
Induce Symptoms, to Produce DON and
Their Development in planta
In this work, the evaluation of the aggressiveness of three F. graminearum strains were at first measured via three parameters: (i) the induction of symptoms, (ii) the development of the fungus in spike tissues, and (iii) the DON synthesis rate. Overall, these three parameters distinguished the three strains. MDC_Fg1 strain induced systematically the most intense symptoms, MDC_Fg13 strain induced intermediate ones while MDC_FgU1 strain produced the weakest ones (Figure 2). The earliest significant difference between strains were observed at 72 hpi and concerned the symptom appearance (Supplementary Table S1). At this time, wheat samples inoculated with MDC_Fg1 strain showed more severe symptoms than MDC_Fg13 and MDC_FgU1 with an average score of 1.33, 0.32, and 0.31, respectively, while fungal mass monitoring by qPCR did not identify any significant difference between the three strains (Figure 3). Concerning DON synthesis rate, MDC_Fg1 strain appeared to be the highest producer at 72 hpi with an average of 21.48 g per kg−1 of mycelium, 11.81 and 1.18 g.kg−1
for MDC_Fg13 and MDC_FgU1, respectively (Figure 4). At the end of the experimentation, symptom severity was significantly different between the three strains with an average score of 3.44, 2.88, and 1.18 that were monitored for MDC_Fg1, MDC_Fg13 and MDC_FgU1, respectively (Figure 2). At this stage, fungal mass monitoring showed different mean fungal development with an average of 31.91, 10.96, and 2.45 ng of mycelium for MDC_Fg1, MDC_Fg13 and MDC_FgU1, respectively. DON synthesis rate was also significantly different with 2.85, 10.74, and 17.12 g.kg−1 for MDC_Fg1, MDC_Fg13 and MDC_FgU1, respectively (Figure 4).
In planta Characterization of the Three
F. graminearum Strain Proteomes
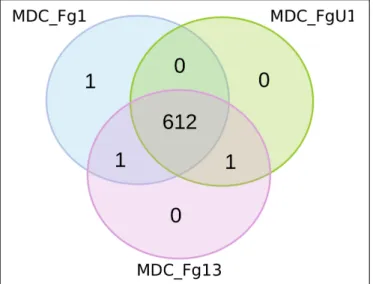
Proteomics analyses were performed at 72 hpi on the three wheat cultivars samples (i.e., Recital, Cadenza and Renan) inoculated with the threeF. graminearum strains thus forming 9 F. graminearum strain×wheat cultivar combinations. Considering all F. graminearum-inoculated wheat samples, this study identified 615 unique F. graminearum proteins. Among all the identified proteins, 612 were shared by the three strains (Figure 5), two were identified in two different strains and only one was strain specific: FG001_00345, predicted to be a thioredoxin. Noteworthy, this protein has been identified in very low abundance in only two biological replicates of Recital samples inoculated with strain MDC_FG1.
Previous work has shown co-variations of fungal and wheat protein abundances between 48 and 72 hpi, suggesting that F. graminearum proteins and especially effectors, could participate in molecular mechanisms determining the fate of the interaction (Fabre et al., 2019). In order to better understand the specificity of these molecular mechanisms, here we performed a proteomics analysis at the end of this turning point (i.e., 72 hpi) to identify the proteins produced by three F. graminearum strains contrasted by their aggressiveness with a particular interest for predicted F. graminearum effectors. In all infected-wheat proteomics data aggregated, a total of 493 fungal proteins (corresponding to nearly 80% of the total identified proteins) were already identified in our previous work (Fabre et al., 2019). Similarly, 61 of the 72 predicted effectors identified during this work are common to both experiments. Regarding protein quantification, 340 (≈55% of all identified proteins) displayed significant abundance differences between F. graminearum strains. Two-way ANOVA were computed to evaluate the contribution of the “Strain” and “Cultivar” factors on theF. graminearum protein abundances. Abundances that were deemed significant to each factor enabled a categorization of the proteins according to the factor(s) that drive(s) the abundance differences. This included: (i) F. graminearum proteins whose abundance differences were specifically explained by the genetic background of the strain (Strain factor, Strain_effect proteins), (ii) F. graminearum proteins whose abundance differences were only explained by the host plant (Cultivar factor, Cultivar_effect proteins), (iii) F. graminearum proteins whose abundance differences were explained by both factors (Strain+Cultivar_effect proteins), and (iv) F. graminearum proteins whose abundance differences observed between strains were dependent on the host cultivar (Strain×Cultivar_effect proteins). Considering each factor individually, a total of 138 Strain_effect proteins, 82 Cultivar_effect proteins and 117 Strain+Cultivar_effect proteins and 2 Strain×Cultivar_effect proteins were identified (Figure 6 and Supplementary Table S2).
How Does Fungal Genetics Shape the
Protein Abundance Patterns?
Two-way ANOVAs computed to evaluate the significant differences in protein abundance between strains allowed the identification of 255 proteins (i.e., Strain_effect proteins and Strain+Cultivar_effect proteins; Figure 6). Among these proteins, 24 matched with predicted secretion features, including 15 proteins harboring a plastid transit peptide (Supplementary
Table S2). In addition, 35 F. graminearum proteins were
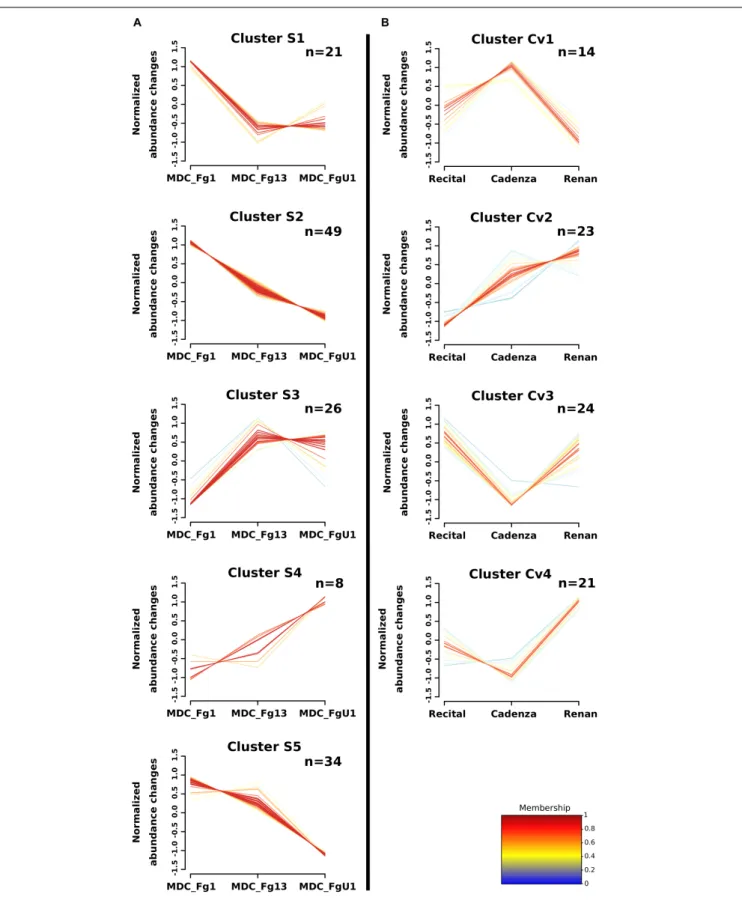
predicted to be effectors according to EffectorP2.0 among which three were also predicted to target the wheat chloroplast or vacuole. A fuzzy C-means clustering of the whole set of these proteins evidenced five consistent clusters (S1–S5; Figure 7A) including 8–49 proteins forStrain_effect proteins and six clusters including 7–40 proteins for the Strain+Cultivar_effect proteins (S+Cv1 to S+Cv6; Figure 8). Six clusters (i.e., Clusters S1, S2, S5, S+Cv1, S+Cv2 and S+Cv3) containing a total of 187 proteins (i.e., nearly 65%) showed abundance that was significantly higher in the strain MDC_Fg1 than in the two other strains. Clusters
FIGURE 2 | Symptom dynamics induced by the three F. graminearum strains on the three studied wheat cultivars (A) Recital, (B) Cadenza, and (C) Renan. Line plots show the course of the symptom severity observed for MDC_Fg1 (blue lines), MDC_Fg13 (pink lines), and MDC_FgU1 (green lines) on the three wheat cultivars. Values are means of six biological replicates until 72 hpi and means of three biological replicates from 96 hpi to 168 hpi. Each biological replicate was characterized from three spikes. Error bars indicate the confidence interval at 5% calculated for each time point independently.
FIGURE 3 | Fusarium graminearum strains development in infected wheat spikes. Fungal mass was assessed at 72 and 168 hpi in the cultivars Recital (A), Cadenza (B) and Renan (C), from the absolute quantification of the F. graminearumβ-tubulin gene using qPCR (Nguyen et al., 2013). Values were estimated with a standard curve of 10-fold dilutions (ranging from 0.01–100 ng) of F. graminearum DNA purification for MDC_Fg1 (blue bars), MDC_Fg13 (pink bars) and MDC_FgU1 (green bars). Values are means of nine biological replicates computed for three biological replicates at 72 hpi and at 168 hpi. Each biological replicate was characterized from three spikes. Error bars indicate the confidence interval at 5% calculated for each time point independently.
FIGURE 4 | Fungal DON synthesis rate in infected wheat spikes. Bar graphs represent DON synthesis rate (in g of DON per kg−1of fungal mycelium) in wheat
heads infected with MDC_Fg1 (blue bars), MDC_Fg13 (pink bars) and MDC_FgU1 (green bars) in the cultivars Recital (A), Cadenza (B), and Renan (C). Measurements were performed by enzyme-linked immunosorbent assay at 72 and 168 hpi, and normalized by the fungal mass quantified by qPCR. Values are means of nine biological replicates computed for three biological replicates at 72 hpi and at 168 hpi. Each biological replicate was characterized from three spikes. Error bars indicate the confidence interval at 5% calculated for each time point independently.
S2 and S+Cv2 appeared to be enriched in proteins involved in “translation,” “ribosome” and “Protein synthesis” functions and Cluster S5 in proteins involved in “ATP binding” and “carbohydrate metabolic process” functions. These three clusters were also enriched in predicted effector proteins. In all other
clusters, fungal protein abundances were lower in MDC_Fg1 than in the two others strains. Cluster S+Cv4 included proteins systematically of higher abundance for MDC_Fg13 while in the cluster S3 no significant difference was found between MDC_Fg13 and MDC_FgU1 protein abundances. No significant
FIGURE 5 | Number of fungal proteins identified for the three F. graminearum strains. For each quantified proteins, the Venn diagram represents the proteins that were strain-specific in the outer part of the circles and those quantified in samples inoculated with at least two different strains in the shared regions of the circles. MDC_Fg1, MDC_Fg13, and MDC_FgU1 proteomes are represented in blue, pink, and green color, respectively.
protein function enrichment was found in the cluster S+Cv4 while enrichments in “GTP binding,” “GTPase activity,” “ATP binding” and “protein binding” were found in cluster S3. Cluster S4 contained eight proteins whose abundance was the highest in MDC_FgU1, intermediate in MDC_Fg1 and the lowest in MDC_Fg13. No significant enrichment was found in this cluster.
Does the Host Cultivar Modulate Fungal
Protein Abundance Profiles?
Overall, in this experiment the wheat cultivar had a lower effect on the observed variances than the “Strain” factor. For symptoms severity, the percentage of the variance explained by the “Cultivar” factor was not significant regardless of the time point, while it was between 55 and 83% for the “Strain” factor (Supplementary Table S1). The same observation was made for fungal mass monitoring, when the strain genetic background used for infection accounted for 31 and 66.5% of the observed variance at 72 and 168 hpi, respectively, no significant differences between the three wheat cultivars were found with 1.4 and 5.8% of the explained variance (Supplementary Table
S1). Concerning DON synthesis rate, significant effects of the “Cultivar” factor were found with nearly 19.5 and 22% of the explained variance at 72 and 168 hpi, respectively (Supplementary Table S1). For these three variables, no specific interaction where found between F. graminearum strains and wheat cultivars (Supplementary Table S1).
At the proteomic scale, all proteins whose abundance variations were explained at least in part by the Cv were considered here. This allowed for the identification of 199 fungal proteins including 82 proteins whose abundance changes were explained only by the wheat cultivar (Cultivar_effect proteins) and 117 whose abundance changes were explained both by
FIGURE 6 | Number of F. graminearum proteins significantly impacted by the different effects in the two-way ANOVA. The Venn diagram shows the number of F. graminearum proteins whose abundance change was significant for each factor of the two-way ANOVA (Strain_effect proteins: FDR< 5%,
P-value< 0.022; Cultivar_effect proteins: FDR < 5%, P-value < 0.017; and Strain×Cultivar_effect proteins: FDR< 5%, P-value < 0.00005).
strain and cultivar genetic backgrounds (Strain+Cultivar_effect proteins, Figure 6). Two proteins showed an effect of the interaction (Strain×Cultivar proteins). Clustering of these proteins allowed the construction of four consistent clusters (Cv1 to Cv4; Figure 7B) including from 14 to 24 proteins for Cultivar_effect proteins and the six Strain+Cultivar_effect proteins clusters already described (S+Cv1 to S+Cv6; Figure 8). Analysis of the abundance changes revealed that clusters Cv2 and S+Cv6 groupedF. graminearum proteins whose abundances were maximal on the low susceptible cultivar Renan and minimal in the highly susceptible cultivar Recital. Clusters Cv1 and S+Cv5 contained F. graminearum proteins whose abundance was higher in the cultivar Cadenza than the two others. In contrast, all other clusters (i.e., Cv3, Cv4, S+Cv1, S+Cv2, S+Cv3, and S+Cv4) were characterized by proteins displaying weaker abundances in Cadenza samples than in the two others. Indeed, a total of 20 candidate effectors and 21 putative secreted proteins including 14 proteins harboring a plastid transit peptide were found in these protein clusters for which no significant enrichment was detected.
DISCUSSION
During this work, we evaluated the aggressiveness of three strains ofF. graminearum by analyzing three variables conventionally used to explain the disease severity (i.e., symptom severity, DON synthesis rate, and fungal mass) and by investigating their proteomes. For the three variables, significant differences between F. graminearum strains were found. This result was mostly discriminating for symptom severity monitoring which
FIGURE 7 | Clustering of F. graminearum Strain_effect and Cultivar_effect protein abundance patterns. Clustering was computed using the fuzzy C-means methods using Z-score transformed values to identify homogeneous patterns of protein abundance changes in (A) the Strain_effect proteins and in (B) the Cultivar_effect proteins. The number of proteins included in each cluster are specified in the right upper corner (n). The cluster membership of each protein profile is indicated by a color code from blue to red.
FIGURE 8 | Clustering of F. graminearum Strain+Cultivar_effect protein abundance patterns. Clustering was computed using the fuzzy C-means methods using Z-score transformed values to identify homogeneous patterns. For each cluster, the average profile was represented by the line plot with the wheat cultivar in x-axis and a color code for the F. graminearum strains (blue: MDC_Fg1; pink: MDC_Fg13, and green: MDC_FgU1). Ribbons indicate the confidence interval at 5% following the same color code than the line plot. The number of proteins included in each cluster are specified in the right upper corner (n).
allowed for the establishment of a clear ranking of our strains on the three wheat cultivars. However, neither the strain’s level of DON synthesis rate nor the fungal mass quantified in planta seems to explain the differences in symptom severity. For example, DON synthesis rate measured in the Recital samples inoculated with MDC_Fg13 was significantly higher than that measured in MDC_FgU1 samples while the symptom severity was not different at the same time. Several studies had already made the same observation (Bai et al., 2001; Birzele et al., 2002; Gilbert et al., 2002; Champeil et al., 2004; Alvarez et al., 2010; Hallen-Adams et al., 2011; He et al., 2019). We can also wonder about the links between the DON synthesis rate and symptom severity with the fungal mass present in the wheat spike. Previous studies showed a strong correlation between fungal biomass and DON production (Lamper et al., 2000; Bai et al., 2001) and between fungal development and symptom severity (Burlakoti et al., 2007) while other studies have not shown any obvious relationship between these parameters (Nicholson et al., 1998; Paul et al., 2005; Alvarez et al., 2010; Hallen-Adams et al., 2011). In this work, no clear correlation between fungal mass, DON
synthesis rate and symptom severity was found. The same fungal mass quantified in the three strains at 72 hpi produced different DON amount and induced different symptom severity in the three wheat cultivars. Moreover, in agreement with a previous study showing that the F. graminearum genes involved in DON synthesis were highly expressed in the early stages of fungus development (Hallen-Adams et al., 2011), our results suggest that in the most aggressive strain MDC_Fg1, a small amount of mycelium at 72 hpi produced a large amount of DON while a larger quantity of mycelium (168 hpi) resulted in a lower production. Individually, these parameters allow us to efficiently distinguish the different strains but they do not seem to be sufficient to explain their respective aggressiveness.
Fusarium graminearum Strains Express
the Same Genetic Program During
Wheat Infection
The study of proteins, molecules directly responsible for cell activity, is essential for understanding plant-pathogen
interactions (Quirino et al., 2010) and particularly the proteinous effectors that are known to be closely related to the infection success. They are defined as molecules that modify host cell structure and function, allowing the pathogen penetration into host tissues, inhibiting the plant immune responses and manipulating plant physiology for the pathogen’s benefit (Stergiopoulos and de Wit, 2009; Giraldo and Valent, 2013; Selin et al., 2016;Toruño et al., 2016). Comparison of proteins identified in this experiment with those identified in our previous work conducted with the most aggressive strain MDC_Fg1 (Fabre et al., 2019) showed that 85% of the total proteins including 80% of the effectors are common to both experiments. These results highlight the high reproducibility of this analytical method and suggest that there may be a core proteome expressed during the interaction with wheat. This assumption is supported by the fact that nearly 100% of the identified proteins were found in the theoretical proteomes of the three F. graminearum strains including all the predictedF. graminearum effectors. A similar observation was already made during the analysis of seven strain proteomes of Mycobacterium tuberculosis (Peters et al., 2016). This is an interesting result because it suggests that the three F. graminearum strains use the same protein set during the early stage of wheat infection and that differences in aggressiveness observed are probably not due to strain-specific proteins but could rather be due to differences in proteins accumulation.
Fusarium graminearum Aggressiveness
Could Be Linked to Protein Synthesis
and Accumulation During Wheat
Infection
Among all the fungal proteins quantified, nearly 76% showed significant abundance differences between the three F. graminearum strains. Fungal mass quantification by qPCR at this stage of infection did not identify any differences between the three strains implying that the variations in protein abundance observed are not due to differences in development but rather to a consequence of differential gene expression or protein synthesis. This hypothesis is supported by the significant enrichment in proteins involved in “Protein biosynthesis,” “Ribosome” and “translation” found in the clusters containing proteins whose abundance is maximal for MDC_Fg1. This suggests that the most aggressive strain could have a more efficient protein biosynthesis machinery than the other two strains, which could have a significant effect on the effector abundance produced by this strain. Observation of the predicted effector distribution in the different abundance pattern clusters supports this hypothesis since 67% of them were located in clusters whose abundance is maximal in the MDC_Fg1 strain, intermediate or weak in the MDC_Fg13 and always weak in the MDC_FgU1 strain (Supplementary
Table S2). In order to confirm the impact of protein abundance
variations on the F. graminearum strains aggressiveness, an additional search for proteins already described in the literature was carried out. A total of 16 proteins showing significant abundance changes were matched with proteins
encoded by genes known to have a role in F. graminearum aggressiveness toward bread wheat (Supplementary Table S2). Among them, all proteins whose abundance was significantly different between the three strains showed higher abundance in samples infected with the most aggressive strain MDC_Fg1 than with the two others strains (i.e., Clusters S1, S2, S+Cv2, and S+Cv3) with the exception of two proteins (FG001_12286 and FG001_06046; Cluster_S5) for which no difference in abundance was observed between MDC_Fg1 and MDC_Fg13. For example, FGSG_07329 included in cluster S2 is a glycogen synthase kinase involved in the activation of many stress-related genes. Mutation of this gene is known to cause a total loss of virulence in F. graminearum as well as many pleiotropic effects such as the inability to produce DON (Qin et al., 2015). The presence of this protein in the cluster S2 can be related to the DON synthesis rate results which showed that MDC_Fg1 was the one that globally had the highest production at 72 hpi. This is consistent with the presence of the protein FGSG_07896 in the cluster S5 known to be a Trichothecene 3-O-acetyltransferase involved in the DON self-protection mechanism in F. graminearum (Kimura et al., 1998; McCormick et al., 1999). These results agree with those obtained for the analysis of the effector distribution within the different clusters and show a strong correlation with the symptom severity and linked with the DON synthesis rate observed in planta. The differences in aggressiveness might not be explainable by strain-specific proteins, but rather by abundance differences in common proteins and effectors having a quantitative effect on theF. graminearum pathogenicity at the same development stage.
Host Cultivar Drives Part of the Fungal
Protein Regulations
While many studies have demonstrated that wheat cultivars could strongly differ in their response to FHB (Mesterházy et al., 1999; Mesterházy, 2002; Bai and Shaner, 2004), our results indicate that the fungal genetic background is the main factor explaining the differences in aggressiveness during the early disease development. At the molecular level, the additional power provided by proteomics has made it possible to identify a Cv on the abundance variations of 199 proteins (i.e., 82 Cultivar_effect proteins and 117 Strain+Cultivar_effect proteins). Concerning the Strain+Cultivar_effect proteins, the F. graminearum protein abundance level was mainly determined by the genetic background ofF. graminearum while differences were amplified when facing different host cultivars. The analysis of the diversity of the Cultivar_effect proteins did not reveal significant effector enrichment in the different clusters but five proteins known to be important for F. graminearum virulence were found in clusters Cv2 and Cv4. Among these five proteins, we found an arabinanase (FGSG_03598) known to enhance wheat susceptibility by suppressing plant immunity (Hao et al., 2019) and FgTRI14 protein (FGSG_03543) involved in DON synthesis (Dyer et al., 2005). Furthermore, no specific Strain×Cultivar interactions (called Strain×Cultivar_effect in this work) were found neither in symptom severity, DON
the same species (Woolhouse et al., 2002). Previous work done on the interaction between a generalist pathogen and cereals has shown that Strain×Cultivar interactions could have only a minor effect, for example in Puccinia coronata f. sp. avenae/Avena sativa interaction (Bruns et al., 2012), in Septoria tritici/Triticum aestivum interaction (van Ginkel and Scharen, 1988) or inFusarium graminearum/Triticum aestivum interaction (Bai and Shaner, 1996;Xue et al., 2004;Mesterházy et al., 2005). All together, these results indicate that the host cultivars similarly influence the threeF. graminearum proteomes and that strain-specific protein accumulations did not depend on the host cultivar.
CONCLUSION
This study expands our understanding of the determinants of F. graminearum aggressiveness during the early stage of bread wheat infection. ThreeF. graminearum strains express the same proteome in planta while differences were only detectable in protein abundance. Host background effect was only shown at the protein abundance level and in the DON synthesis rate without any change in the strain ranking. In addition, the absence of Strain×Cultivar specific interaction suggests a common infection strategy of the three strains and modulated identically by wheat cultivars of contrasted FHB susceptibility. Now, confirming these results using more strains and cultivars on a longer infection dynamics will be an additional work in order to understand the determinism of pathogen’s aggressiveness during the interaction.
TL and LB designed the research. FF and SR prepared the samples. FF, SU, and LB performed the proteomic experimentation. JB involved in deoxynivalenol synthesis rate measurements. FF and JB involved in qPCR measurements. FF and LB analyzed the data, prepared the figures, and wrote the manuscript. LB conceived and performed modeling.
FUNDING
This research and FF Ph.D. grant were supported by the Region Auvergne-Rhône-Alpes and the Fonds Européen de Développement Régional (FEDER support: Nouveau Chercheur 2016 program).
ACKNOWLEDGMENTS
We acknowledge Tarek Alouane, David Lopez, and Hélène Rimbert for their valuable help in bioinformatics. We thank Marie Dufresne (Institut of Plant Sciences – Paris-Saclay) for her helpful comments on our manuscript and Christopher Smith for his proofreading. We also thank Richard Blanc for his help in the plant cultivation.
SUPPLEMENTARY MATERIAL
The Supplementary Material for this article can be found online at: https://www.frontiersin.org/articles/10.3389/fmicb. 2019.02857/full#supplementary-material
REFERENCES
Alouane, T., Rimbert, H., Fabre, F., Cambon, F., Langin, T., and Bonhomme, L. (2018). Genome sequence ofFusarium graminearum strain MDC_Fg1, isolated from bread wheat grown in France.Microbiol. Resour. Announc. 7:e01260-18. doi: 10.1128/MRA.01260-18
Alvarez, C. L., Somma, S., Moretti, A., and Fernández Pinto, V. (2010). Aggressiveness ofFusarium graminearum sensu stricto isolates in wheat kernels in Argentina. J. Phytopathol. 158, 173–181. doi: 10.1111/j.1439-0434.2009. 01596.x
Bai, G.-H., Desjardins, A. E., and Plattner, R. D. (2002). Deoxynivalenol-nonproducingFusarium graminearum causes initial infection, but does not cause disease spread in wheat spikes.Mycopathologia 153, 91–98. doi: 10.1023/ A:1014419323550
Bai, G.-H., Plattner, R., Desjardins, A., Kolb, F., and McIntosh, R. A. (2001). Resistance to Fusarium head blight and deoxynivalenol accumulation in wheat. Plant Breed. 120, 1–6. doi: 10.1046/j.1439-0523.2001. 00562.x
Bai, G.-H., and Shaner, G. (1996). Variation inFusarium graminearum and cultivar resistance to wheat scab.Plant Dis. 80, 975–979. doi: 10.1094/PD-80-0975 Bai, G.-H., and Shaner, G. (2004). Management and resistance in wheat and barley
to Fusarium head blight.Annu. Rev. Phytopathol. 42, 135–161. doi: 10.1146/ annurev.phyto.42.040803.140340
Benjamini, Y., and Hochberg, Y. (1995). Controlling the false discovery rate: a practical and powerful approach to multiple testing.J. R. Stat. Soc. B 57, 289–300. doi: 10.2307/2346101
Birzele, B., Meier, A., Hindorf, H., Krämer, J., and Dehne, H.-W. (2002). Epidemiology ofFusarium infection and deoxynivalenol content in winter wheat in the Rhineland, Germany.Eur. J. Plant Pathol. 108, 667–673. doi: 10.1023/A:1020632816441
Bonhomme, L., Valot, B., Tardieu, F., and Zivy, M. (2012). Phosphoproteome dynamics upon changes in plant water status reveal early events associated with rapid growth adjustment in maize leaves.Mol. Cell. Proteomics 11, 957–972. doi: 10.1074/mcp.M111.015867
Bönnighausen, J., Schauer, N., Schäfer, W., and Bormann, J. (2018). Metabolic profiling of wheat rachis node infection byFusarium graminearum – decoding
deoxynivalenol-dependent susceptibility.New Phytol. 22, 459–469. doi: 10. 1111/nph.15377
Brennan, J. M., Fagan, B., van Maanen, A., Cooke, B. M., and Doohan, F. M. (2003). Studies onin vitro growth and pathogenicity of european Fusarium fungi. Eur. J. Plant Pathol. 109, 577–587. doi: 10.1023/A:1024712415326
Brown, N. A., Antoniw, J., and Hammond-Kosack, K. E. (2012). The predicted secretome of the plant pathogenic fungusFusarium graminearum: a refined comparative analysis.PLoS One 7:e33731. doi: 10.1371/journal.pone.0033731 Bruns, E., Carson, M., and May, G. (2012). Pathogen and host genotype differently
affect pathogen fitness through their effects on different life-history stages.BMC Evol. Biol. 12:135. doi: 10.1186/1471-2148-12-135
Burlakoti, R. R., Estrada, R., Rivera, V. V., Boddeda, A., Secor, G. A., and Adhikari, T. B. (2007). Real-time PCR quantification and mycotoxin production of Fusarium graminearum in wheat inoculated with isolates collected from potato, sugar beet, and wheat.Phytopathology 97, 835–841. doi: 10.1094/PHYTO-97-7-0835
Carter, J. P., Rezanoor, H. N., Holden, D., Desjardins, A. E., Plattner, R. D., and Nicholson, P. (2002). Variation in pathogenicity associated with the genetic diversity ofFusarium graminearum. Eur. J. Plant Pathol. 108, 573–583. doi: 10.1023/A:1019921203161
Champeil, A., Fourbet, J. F., Doré, T., and Rossignol, L. (2004). Influence of cropping system onFusarium head blight and mycotoxin levels in winter wheat. Crop Prot. 23, 531–537. doi: 10.1016/j.cropro.2003.10.011
Chen, Y., Kistler, H. C., and Ma, Z. (2019).Fusarium graminearum trichothecene mycotoxins: biosynthesis, regulation, and management. Annu. Rev. Phytopathol. 57, 15–39. doi: 10.1146/annurev-phyto-082718-100318 Chetouhi, C., Bonhomme, L., Lasserre-Zuber, P., Cambon, F., Pelletier, S.,
Renou, J.-P., et al. (2016). Transcriptome dynamics of a susceptible wheat upon Fusarium head blight reveals that molecular responses to Fusarium graminearum infection fit over the grain development processes. Funct. Integr. Genomics 16, 183–201. doi: 10.1007/s10142-016-0476-1
Cumagun, C. J. R., Bowden, R. L., Jurgenson, J. E., Leslie, J. F., and Miedaner, T. (2004). Genetic mapping of pathogenicity and aggressiveness ofGibberella zeae (Fusarium graminearum) toward wheat. Phytopathology 94, 520–526. doi: 10.1094/PHYTO.2004.94.5.520
Delmas, C. E. L., Fabre, F., Jolivet, J., Mazet, I. D., Richart Cervera, S., Delière, L., et al. (2016). Adaptation of a plant pathogen to partial host resistance: selection for greater aggressiveness in grapevine downy mildew.Evol. Appl. 9, 709–725. doi: 10.1111/eva.12368
Dyer, R. B., Plattner, R. D., Kendra, D. F., and Brown, D. W. (2005).Fusarium graminearum TRI14 is required for high virulence and DON production on wheat but not for DON synthesisin vitro. J. Agric. Food Chem. 53, 9281–9287. doi: 10.1021/jf051441a
Fabre, F., Vignassa, M., Urbach, S., Langin, T., and Bonhomme, L. (2019). Time-resolved dissection of the molecular crosstalk driving Fusarium head blight in wheat provides new insights into host susceptibility determinism.Plant Cell Environ. 42, 2291–2308. doi: 10.1111/pce.13549
Gale, L. R., Chen, L.-F., Hernick, C. A., Takamura, K., and Kistler, H. C. (2002). Population analysis ofFusarium graminearum from wheat fields in eastern China.Phytopathology 92, 1315–1322. doi: 10.1094/PHYTO.2002.92.12.1315 Gervais, L., Dedryver, F., Morlais, J.-Y., Bodusseau, V., Negre, S., Bilous, M.,
et al. (2003). Mapping of quantitative trait loci for field resistance to Fusarium head blight in an European winter wheat.Theor. Appl. Genet. 106, 961–970. doi: 10.1007/s00122-002-1160-5
Gilbert, J., Abramson, D., McCallum, B., and Clear, R. (2002). Comparison of canadian Fusarium graminearum isolates for aggressiveness, vegetative compatibility, and production of ergosterol and mycotoxins.Mycopathologia 153, 209–215. doi: 10.1023/A:1014940523921
Giraldo, M. C., and Valent, B. (2013). Filamentous plant pathogen effectors in action.Nat. Rev. Microbiol. 11, 800–814. doi: 10.1038/nrmicro3119
Goswami, R. S., and Kistler, H. C. (2005). Pathogenicity andin planta mycotoxin accumulation among members of theFusarium graminearum species complex on wheat and rice.Phytopathology 95, 1397–1404. doi: 10.1094/PHYTO-95-1397
Hallen-Adams, H. E., Wenner, N., Kuldau, G. A., and Trail, F. (2011). Deoxynivalenol biosynthesis-related gene expression during wheat Kernel colonization byFusarium graminearum. Phytopathology 101, 1091–1096. doi: 10.1094/PHYTO-01-11-0023
Hao, G., McCormick, S., Vaughan, M., Naumann, T., Kim, H.-S., Proctor, R. H., et al. (2019).Fusarium graminearum arabinanase (Arb93B) enhances wheat head blight susceptibility by suppressing plant immunity.Mol. Plant Microbe Interact. 32, 888–898. doi: 10.1094/MPMI-06-18-0170-R
Harris, L. J., Balcerzak, M., Johnston, A., Schneiderman, D., and Ouellet, T. (2016). Host-preferentialFusarium graminearum gene expression during infection of wheat, barley, and maize.Fungal Biol. 120, 111–123. doi: 10.1016/j.funbio.2015. 10.010
He, X., Dreisigacker, S., Singh, R. P., and Singh, P. K. (2019). Genetics for low correlation between Fusarium head blight disease and deoxynivalenol (DON) content in a bread wheat mapping population.Theor. Appl. Genet. 132, 2401– 2411. doi: 10.1007/s00122-019-03362-9
Jia, L.-J., and Tang, W.-H. (2015). The omics era ofFusarium graminearum: opportunities and challenges.New Phytol. 207, 1–3. doi: 10.1111/nph.13457 Jones, D. A., Bertazzoni, S., Turo, C. J., Syme, R. A., and Hane, J. K. (2018).
Bioinformatic prediction of plant–pathogenicity effector proteins of fungi. Curr. Opin. Microbiol. 46, 43–49. doi: 10.1016/j.mib.2018.01.017
Kamoun, S. (2006). A catalogue of the effector secretome of plant pathogenic oomycetes.Annu. Rev. Phytopathol. 44, 41–60. doi: 10.1146/annurev.phyto.44. 070505.143436
Kimura, M., Kaneko, I., Komiyama, M., Takatsuki, A., Koshino, H., Yoneyama, K., et al. (1998). Trichothecene 3-O-acetyltransferase protects both the producing organism and transformed yeast from related mycotoxins. Cloning and characterization of Tri101.J. Biol. Chem. 273, 1654–1661. doi: 10.1074/jbc.273. 3.1654
King, R., Urban, M., Hammond-Kosack, M. C. U., Hassani-Pak, K., and Hammond-Kosack, K. E. (2015). The completed genome sequence of the pathogenic ascomycete fungusFusarium graminearum. BMC Genomics 16:544. doi: 10.1186/s12864-015-1756-1
Krijger, J.-J., Thon, M. R., Deising, H. B., and Wirsel, S. G. R. (2014). Compositions of fungal secretomes indicate a greater impact of phylogenetic history than lifestyle adaptation.BMC Genomics 15:722. doi: 10.1186/1471-2164-15-722 Kumar, L., and Futschik, M. E. (2007). Mfuzz: a software package for soft clustering
of microarray data.Bioinformation 2, 5–7. doi: 10.6026/97320630002005 Lamper, C., Téren, J., Bartók, T., Komoróczy, R., Mesterházy, Á, and Sági, F.
(2000). Predicting DON contamination inFusarium-infected wheat grains via determination of the ergosterol content.Cereal Res. Commun. 28, 337–344. Langella, O., Valot, B., Balliau, T., Blein-Nicolas, M., Bonhomme, L., and Zivy, M.
(2017). X!TandemPipeline: a tool to manage sequence redundancy for protein inference and phosphosite identification.J. Proteome Res. 16, 494–503. doi: 10.1021/acs.jproteome.6b00632
Laurent, B., Moinard, M., Spataro, C., Ponts, N., Barreau, C., and Foulongne-Oriol, M. (2017). Landscape of genomic diversity and host adaptation inFusarium graminearum. BMC Genomics 18:203. doi: 10.1186/s12864-017-3524-x Laurent, B., Palaiokostas, C., Spataro, C., Moinard, M., Zehraoui, E., Houston,
R. D., et al. (2018). High-resolution mapping of the recombination landscape of the phytopathogen Fusarium graminearum suggests two-speed genome evolution.Mol. Plant Pathol. 19, 341–354. doi: 10.1111/mpp.12524
Liu, Y., Li, M., Bian, K., Guan, E., Liu, Y., and Lu, Y. (2019). Reduction of deoxynivalenol in wheat with superheated steam and its effects on wheat quality.Toxins 11:E414. doi: 10.3390/toxins11070414
Lo Presti, L., Lanver, D., Schweizer, G., Tanaka, S., Liang, L., Tollot, M., et al. (2015). Fungal effectors and plant susceptibility.Annu. Rev. Plant Biol. 66, 513–545. doi: 10.1146/annurev-arplant-043014-114623
Lowe, R. G. T., McCorkelle, O., Bleackley, M., Collins, C., Faou, P., Mathivanan, S., et al. (2015). Extracellular peptidases of the cereal pathogenFusarium graminearum. Front. Plant Sci. 6:962. doi: 10.3389/fpls.2015.00962
Lu, S., and Edwards, M. C. (2015). Genome-wide analysis of small secreted cysteine-rich proteins identifies candidate effector proteins potentially involved inFusarium graminearum-wheat interactions. Phytopathology 106, 166–176. doi: 10.1094/PHYTO-09-15-0215-R
McCormick, S. P., Alexander, N. J., Trapp, S. E., and Hohn, T. M. (1999). Disruption of TRI101, the gene encoding trichothecene 3-O-acetyltransferase, fromFusarium sporotrichioides. Appl. Environ. Microbiol. 65, 5252–5256.
McMullen, M., Bergstrom, G., De Wolf, E., Dill-Macky, R., Hershman, D., Shaner, G., et al. (2012). A unified effort to fight an enemy of wheat and barley: Fusarium head blight.Plant Dis. 96, 1712–1728. doi: 10.1094/PDIS-03-12-0291-FE
wheat resistance to Fusarium head blight and the role of deocynivalenol for breeding.Plant Breed. 118, 97–110. doi: 10.1046/j.1439-0523.1999.118002097.x Nguyen, T., Kröger, C., Bönnighausen, J., Schäfer, W., and Bormann, J. (2013). The ATF/CREB transcription factor Atf1 is essential for full virulence, deoxynivalenol production, and stress tolerance in the cereal pathogenFusarium graminearum. Mol. Plant Microbe Interact. 26, 1378–1394. doi: 10.1094/MPMI-04-13-0125-R
Nicholson, P., Simpson, D. R., Weston, G., Rezanoor, H. N., Lees, A. K., Parry, D. W., et al. (1998). Detection and quantification ofFusarium culmorum and Fusarium graminearum in cereals using PCR assays. Physiol. Mol. Plant Pathol. 53, 17–37. doi: 10.1006/pmpp.1998.0170
Pariaud, B., Ravigné, V., Halkett, F., Goyeau, H., Carlier, J., and Lannou, C. (2009). Aggressiveness and its role in the adaptation of plant pathogens.Plant Pathol. 58, 409–424. doi: 10.1111/j.1365-3059.2009.02039.x
Parry, D. W., Jenkinson, P., and McLeod, L. (1995).Fusarium ear blight (scab) in small grain cereals - a review.Plant Pathol. 44, 207–238. doi: 10.1111/j.1365-3059.1995.tb02773.x
Pasquet, J.-C., Changenet, V., Macadré, C., Boex-Fontvieille, E., Soulhat, C., Bouchabké-Coussa, O., et al. (2016). ABrachypodium UDP-Glycosyltransferase confers root tolerance to deoxynivalenol and resistance toFusarium infection. Plant Physiol. 172, 559–574. doi: 10.1104/pp.16.00371
Paul, P. A., Lipps, P. E., and Madden, L. V. (2005). Relationship between visual estimates of Fusarium head blight intensity and deoxynivalenol accumulation in harvested wheat grain: a meta-analysis.Phytopathology 95, 1225–1236. doi: 10.1094/PHYTO-95-1225
Peters, J. S., Calder, B., Gonnelli, G., Degroeve, S., Rajaonarifara, E., Mulder, N., et al. (2016). Identification of quantitative proteomic differences between Mycobacterium tuberculosis lineages with altered virulence. Front. Microbiol. 7:813. doi: 10.3389/fmicb.2016.00813
Placinta, C. M., D’Mello, J. P. F., and Macdonald, A. M. C. (1999). A review of worldwide contamination of cereal grains and animal feed withFusarium mycotoxins.Anim. Feed. Sci. Technol. 78, 21–37. doi: 10.1016/S0377-8401(98) 00278-8
Proctor, R. H., Desjardins, A. E., McCormick, S. P., Plattner, R. D., Alexander, N. J., and Brown, D. W. (2002). Genetic analysis of the role of trichothecene and fumonisin mycotoxins in the virulence ofFusarium. Eur. J. Plant Pathol. 108, 691–698. doi: 10.1023/A:1020637832371
Proctor, R. H., Hohn, T. M., and McCormick, S. P. (1995). Reduced virulence of Gibberella zeae caused by disruption of a trichothecene toxin biosynthetic gene. Mol. Plant Microbe Interact. 8, 593–601. doi: 10.1094/MPMI-8-0593 Proctor, R. H., Hohn, T. M., and McCormick, S. P. (1997). Restoration of
wild-type virulence to Tri5 disruption mutants ofGibberella zeae via gene reversion and mutant complementation. Microbiology 143, 2583–2591. doi: 10.1099/ 00221287-143-8-2583
Puri, K. D., Yan, C., Leng, Y., and Zhong, S. (2016). RNA-Seq revealed differences in transcriptomes between 3ADON and 15ADON populations ofFusarium graminearum in vitro and in planta. PLoS One 11:e0163803. doi: 10.1371/ journal.pone.0163803
Qin, J., Wang, G., Jiang, C., Xu, J.-R., and Wang, C. (2015). Fgk3 glycogen synthase kinase is important for development, pathogenesis, and stress responses in Fusarium graminearum. Sci. Rep. 5:8504. doi: 10.1038/srep08504
Quirino, B. F., Candido, E. S., Campos, P. F., Franco, O. L., and Krüger, R. H. (2010). Proteomic approaches to study plant–pathogen interactions. Phytochemistry 71, 351–362. doi: 10.1016/j.phytochem.2009.11.005
R Core Team, (2018).R: A Language and Environment for Statistical Computing. Vienna: R Foundation for Statistical Computing.
Saville, R. J., Gosman, N., Burt, C. J., Makepeace, J., Steed, A., Corbitt, M., et al. (2012). The “Green Revolution” dwarfing genes play a role in disease resistance
et al. (2016). EffectorP: predicting fungal effector proteins from secretomes using machine learning.New Phytol. 210, 743–761. doi: 10.1111/nph.13794 Steiner, B., Buerstmayr, M., Michel, S., Schweiger, W., Lemmens, M., and
Buerstmayr, H. (2017). Breeding strategies and advances in line selection for Fusarium head blight resistance in wheat.Trop. Plant Pathol. 42, 165–174. doi: 10.1007/s40858-017-0127-7
Stergiopoulos, I., and de Wit, P. J. G. M. (2009). Fungal effector proteins.Annu. Rev. Phytopathol. 47, 233–263. doi: 10.1146/annurev.phyto.112408.132637 Toruño, T. Y., Stergiopoulos, I., and Coaker, G. (2016). Plant-pathogen effectors:
cellular probes interfering with plant defenses in spatial and temporal manners. Annu. Rev. Phytopathol. 54, 419–441. doi: 10.1146/annurev-phyto-080615-100204
Valot, B., Langella, O., Nano, E., and Zivy, M. (2011). MassChroQ: a versatile tool for mass spectrometry quantification.Proteomics 11, 3572–3577. doi: 10.1002/ pmic.201100120
Van der Plank, J. E. (1968).Disease Resistance in Plants. New York, NY: Academic Press.
van Ginkel, M., and Scharen, A. L. (1988). Host-pathogen relationships of wheat andSeptoria tritici. Phytopathology 78, 762–766. doi: 10.1094/Phyto-78-762 van Schie, C. C. N., and Takken, F. L. W. (2014). Susceptibility genes 101: how to be
a good host.Annu. Rev. Phytopathol. 52, 551–581. doi: 10.1146/annurev-phyto-102313-045854
Vizcaíno, J. A., Csordas, A., Del-Toro, N., Dianes, J. A., Griss, J., Lavidas, I., et al. (2016). 2016 update of the PRIDE database and its related tools.Nucleic Acids Res. 44, D447–D456. doi: 10.1093/nar/gkv1145
Voigt, C. A., von Scheidt, B., Gácser, A., Kassner, H., Lieberei, R., Schäfer, W., et al. (2007). Enhanced mycotoxin production of a lipase-deficientFusarium graminearum mutant correlates to toxin-related gene expression. Eur. J. Plant Pathol. 117, 1–12. doi: 10.1007/s10658-006-9063-y
Walter, S., Nicholson, P., and Doohan, F. M. (2010). Action and reaction of host and pathogen during Fusarium head blight disease.New Phytol. 185, 54–66. doi: 10.1111/j.1469-8137.2009.03041.x
Woolhouse, M. E. J., Webster, J. P., Domingo, E., Charlesworth, B., and Levin, B. R. (2002). Biological and biomedical implications of the co-evolution of pathogens and their hosts. Nat. Genet. 32, 569–577. doi: 10.1038/ng1 202-569
Xu, X., and Nicholson, P. (2009). Community ecology of fungal pathogens causing wheat head blight.Annu. Rev. Phytopathol. 47, 83–103. doi: 10.1146/annurev-phyto-080508-081737
Xue, A. G., Armstrong, K. C., Voldeng, H. D., Fedak, G., and Babcock, C. (2004). Comparative aggressiveness of isolates ofFusarium spp. causing head blight on wheat in Canada.Can. J. Plant Pathol. 26, 81–88. doi: 10.1080/ 07060660409507117
Yi, M., and Valent, B. (2013). Communication between filamentous pathogens and plants at the biotrophic interface.Annu. Rev. Phytopathol. 51, 587–611. doi: 10.1146/annurev-phyto-081211-172916
Conflict of Interest:The authors declare that the research was conducted in the absence of any commercial or financial relationships that could be construed as a potential conflict of interest.
Copyright © 2019 Fabre, Bormann, Urbach, Roche, Langin and Bonhomme. This is an open-access article distributed under the terms of the Creative Commons Attribution License (CC BY). The use, distribution or reproduction in other forums is permitted, provided the original author(s) and the copyright owner(s) are credited and that the original publication in this journal is cited, in accordance with accepted academic practice. No use, distribution or reproduction is permitted which does not comply with these terms.