An Analytical Framework for Long Term Policy for Commercial Deployment and Innovation in Carbon Capture and Sequestration Technology in the United States
By
Michael Roberts Hamilton B.S., Mechanical Engineering Georgia Institute of Technology (2007) Submitted to the Engineering Systems Division In Partial Fulfillment of the Requirements for the Degree of
Master of Science in Technology and Policy At the
Massachusetts Institute of Technology February 2010
02010 Massachusetts Institute of Technology. All rights reserved.
ARcHWs
M~ASSACHUSMTS INST E. OF TECHNOLOGYJUN 2
3
2010
LIBRARIES
Signature of Author... ...Technology and Policy Program, Engineering Systems Division
December 1 8th, 2009
ii
/17<7
Certified by... ... -..
Howard Herzog Senior Resear En ineer, MIT Energy Initiative
Thesis Supervisor
Certified by ...-
...-Richard Lester Professor of Nuclear Science and Engineering Head, Department Nuclear Science and Engineering Thesis Supervisor
Accepted by ... ... ...
Dava Newman
Professor of Aeronautics and Astronautics and Engineering Systems Director, Technology and Policy Program
An Analytical Framework for Long Term Policy for Commercial Deployment and Innovation in Carbon Capture and Sequestration Technology in the United States
By Michael Hamilton
Submitted to the Engineering Systems Division on December 1 8th 2009
In Partial Fulfillment of the Requirements for the Degree of Master of Science in Technology and Policy Abstract
Carbon capture and sequestration (CCS) technology has the potential to be a key CO2 emissions mitigation technology for the United States. Several CCS technology options are ready for immediate commercial-scale demonstration, but three obstacles to commercial
deployment remain: the lack of a clear legal and regulatory framework for sequestration, the lack of a demonstration phase, and most importantly, the lack of a market for CCS.
A successful demonstration phase will achieve the goal of technology readiness. The demonstration phase should be organized so as to share costs and risks between public and private actors. Project selection responsibility should be assigned to a dedicated private board and project management responsibility to private companies. This analysis recommends a combination of the Boucher Bill proposal for a CCS demonstration phase, as incorporated in the American Clean Energy and Security Act (ACES Act) of 2009, and a continuation of the DOE Clean Coal Power Initiative program. This combined approach can provide productive
competition between public and private demonstration programs.
Achieving technology readiness will not on its own lead to commercial deployment of CCS. Two additional policy objectives for the commercial deployment phase are considered: market penetration and cost reduction. Market penetration can be ensured through strong market pull policies, but this may be a very expensive policy approach in the long run. A more prudent goal is long-term cost reduction of CCS. Unlike the market penetration goal, the cost reduction goal will not guarantee that CCS will become a major contributor to carbon emissions
mitigation, but it will provide a more cost-effective path. Achieving the cost reduction goal will require strong market pull policies for the short and medium term, together with a focus on technology push policies over the entire period. In the long term, market pull policies for CCS should be eliminated; if CCS is not economically competitive with alternative technologies, it should not be deployed on a significant scale.
The ACES Act provides a good policy framework to achieve technology readiness through a demonstration phase and to pursue the long-term goal of cost reduction for commercial deployment of CCS technology. This approach will provide a cost-effective strategy for
ensuring that CCS, a major scalable option for carbon emissions mitigation, is given the best chance of success in the long term.
Thesis Supervisor: Howard Herzog
Senior Research Engineer, MIT Energy Initiative Thesis Supervisor: Richard Lester
Acknowledgements
Thank you to my wife Priscilla for loving me, for the infinite support in good times and bad, and for the great experiences we had together building a life the last few years. Thank you for working and living in the cold, wet, and dark Northeast. I love you, and I am so excited to join you in the warm, dry, and sunny Southern California!
I would like to thank my research sponsors, the MIT Carbon Sequestration Initiative and the Doris Duke Charitable Foundation, that have allowed me to matriculate, perform research, and live the grad student lifestyle while here at MIT. This work would not have been possible without your support. Also, as the beneficiary of such philanthropy, it has inspired me to seek to give back to science and arts when I make money some day.
I would like to thank my research supervisors and mentors Richard and Howard for all the support and guidance over the last couple of years. The opportunity to work with both you has been a real honor and a major learning experience. I thank you for the support of both my academic progress but also for my extracurricular interests in the Cycling Team and Energy Club, through which I have gained valuable leadership experience and some of the most amazing memories of my tenure at MIT.
Howard, you gave me so many important firsts, my first trip to the west coast for the Forum at Stanford, my first conference presentation, and my first citation. Working with you has been very rewarding, and I thank you for the time and resources you have devoted to me the past few years. You have helped me learn the values of diligence and brevity, and I am now ready to enter the professional world armed with the experiences we have had together.
Richard, every time we speak, I know to expect a fresh perspective, which is a rare quality in people. My work with you has shown me the importance of asking the right questions and
exploring the fundamentals; I thank you for inviting me onto your team and showing me that refraining a previously explored argument in a useful logical way can be a real contribution to the policy discussion. Also, your prowess in written and verbal communication has been a real
inspiration, and is something I aspire to improve in myself.
I would like to thank Rohit Sakhuja for being a wonderful sounding board and research mentor. You helped me move forward when I felt stuck on this project, and your contributions and willingness to discuss and brainstorm have ensured a much higher quality project.
I would like to thank my parents Brian and Lucy, and my little sister Lindsey, for all the support and love they have given me the past 6+ years while I have been in school. This education would not have been possible without you. I hope that my life choices will make you proud. I would like to thank my student colleagues that have been great friends and enhanced my intellectual experience. Thanks especially to Gary Shu and Ashleigh Hildebrand for being there for me in E-40 and E- 19 and for being sounding boards for some of those crazy ideas I get in my head. Also thank you to Ashley Finan and Phech Colatat for welcoming me to the IPC, and for the valuable discussions on the energy innovation challenge. Also thank you to Manya Ranjan,
Jonas Nahm, the Joint Program student lunches, and the Energy Policy group lunches for our conversations and experiences together.
Thank you to John Parsons and the Sloan 15.401 course for helping come to a realistic and practical understanding of finance and business decisions in the real world.
Thank you to Don and Kate MacKenzie for hosting and befriending me these past few months when I have been out of home.
Thank you to Adam Lyons for being a true "best man" after this unexpected confluence of residence the past two years in Cambridge, MA.
Thank you to Olga Parkin, Mary Gallagher, and Anita Kafka for the amazing administrative support and friendship. So many stressful situations were made easy with your help. Keep on keepin' on.
Table of Contents
. Introduction... 12
1.1. The Challenge ... 13
1.2. This Thesis ... 17
2. CCS Technology and the Cost G ap ... 19
2.1. Capture Technology O verview ... 19
2.1.1. Post-Com bustion Capture ... 19
2.1.2. Pre-com bustion Capture... 21
2.1.3. O xy-fuel Com bustion... 22
2.1.4. Comparison of Three Major Capture Approaches... 24
2.1.5. Retrofit A pplication ... 24
2.1.6. CCS for O ther Industrial Sources ... 25
2.2. CC S Costs ... 26
2.2.1. The Cost of CCS Today... 26
2.2.2. A M odel for Future CCS Cost R eduction... 34
2.3. Cost M odel... 38
2.3.1. M odel Inputs ... 38
2.3.2. M odel O utput... 44
2.3.3. M odel Scenarios and Results... 47
3. Barriers to CC S D eploym ent ... 49
3.1. Legal and Regulatory Fram ew ork... 49
3.2. D em onstration Phase... 49
3.3. A M arket for CC S ... 50
4. The Innovation System ... 51
4.1. SO 2 Em issions Control: A Brief Case Study ... 51
4.1.1. 1950s-1966 Era... 51
4.1.2. 1967-1976 Era... 52
4.1.3. 1977-1989 Era... 54
4.1.4. 1990-Current Era ... 55
4.1.5. Enhancing Innovation through Technology Exclusion... 55
4.1.6. Conclusions on Policy and Innovation in FGD technology... 56
4.2. The Innovation Life-Cycle... 58
4.2.1. M ajor Risks for CCS Projects... 60
4.2.2. Research and D evelopm ent... 61
4.2.3. The D em onstration Phase ... 64
4.2.4. Com m ercial D eploym ent ... 66
4.3. Policy and the Innovation System for CC S... 68
4.3.1. M arket pull policies can support innovation... 68
4.3.2. Technology push policy can support commercial deployment... 70
4.3.3. A n Innovation System M odel... 73
5. The D em onstration Phase ... 76
5.1. W hat is a dem onstration phase?... ... . . 77
5.2. W hy pursue a dem onstration phase for CC S?... 77
5.3. Why can't private industry do a demonstration phase by itselP ... 80
5.4.2. Public ... 82
5.4.3. Cost and Risk Sharing... 82
5.5. H ow should project selection be organized?... ... 84
5.5.1. Single Private Com pany ... 84
5.5.2. Private Coalition ... 85
5.5.3. Public ... 85
5.5.4. Private Board ... 89
5.6. H ow should project m anagem ent be organized?... ... ... 90
5.6.1. Single Private Com pany ... 90
5.6.2. Public ... 90
5.6.3. Private Coalition ... 92
5.7. Policy Proposals for Cost and Risk Sharing... 92
5.7.1. D OE Traditional... 93
5.7.2. FutureG en Structure... 94
5.7.3. "Boucher Bill" Trust Fund and Private Demonstration Board ... 95
5.7.4. Energy Technology Corporation... 97
5.7.5. Subsidies ... 98
5.7.6. Cost Pass-through ... 98
5.8. Conclusions ... 98
6. Com m ercial D eploym ent... 101
6.1. What are the policy objectives for commercial deployment policy?... 101
6.1.1. M arket Penetration Goal... 102
6.1.2. Cost Reduction Goal... 102
6.2. What are the policy options available to achieve these objectives?... ... ... 103
6.2.1. M arket pull... 103
6.2.2. Technology push... 112
6.2.3. Analysis... 113
6.3. W hat is the right goal for com m ercial deploym ent of CCS?... 114
7. Conclusions... 117
8. Appendix... 119
8.1. A bbreviations and A cronym s... 119
8.2. The M IT Expert W orkshop on CCS Innovation ... 120
8.3. Cost M odel D etails... 121
8.4. Past G overnm ent D em onstration Program s Com parison... 122
8.5. D etails of Policy Proposals for Com m ercial D eploym ent ... 125
8.5.1. Carbon Pricing ... 125
8.5.2. M andates... 125
8.5.3. Subsidies ... 127
8.6. Sum m ary of CCS Provisions in A CES Act of 2009 ... 132
8.6.1. Cap and Trade A llow ance A llocation- Sec. 321 ... 132
8.6.2. Carbon Storage Research Corporation (CSRC) -Sec. 114... 132
8.6.3. Bonus A llow ance D eploym ent Support - Sec 115 ... 133
8.6.4. Em issions perform ance standards - Sec. 116... 133
8.6.5. Storage Regulation Guidance - Sec. 111-113 ... 134
8.7. Current CCS Projects Study... 134
8.7.2. Tenaska Energy's Trailblazer Project... 135
8.7.3. Tenaska Energy's Taylorville Project... 136
8.7.4. Babcock & Wilcox's Oxy-Fuel Demonstration Project ... 137
8.7.5. Southern Company's Kemper County Project... 137
Table of Figures
Figure 1.1. Point Sources of CO2 Worldwide ... 14
Figure 1.2. The Socolow and Pacala wedges... 15
Figure 1.3. Electricity generation in the United States since 1950 ... 16
Figure 2.1. Process flow diagram for post-combustion capture on a pulverized coal plant. ... 20
Figure 2.2. Post-combustion solvent capture system... 21
Figure 2.3. Process flow diagram for IGCC plant with pre-combustion capture. ... 22
Figure 2.4. Process diagram for oxy-fuel combustion... 23
Figure 2.5. Cost and Price Indices since 2000... 27
Figure 2.6. Representative Costs of CCS from McKinsey paper. . ... 33
Figure 2.7. Example of learning-by-doing cost reduction in Wet FGD NOx reduction techn o logy ... 3 5 Figure 2.8. Plot of technology cost curve with logarithmic regression. ... 37
Figure 2.9. Cost model inputs showing FOAK and NOAK costs. ... 39
Figure 2.10. Adoption path input for case. ... 41
Figure 2.11. Projected carbon prices for recent US cap and trade policy analyses... 42
Figure 2.12. Carbon price inputs with comparison to ACES Act... 43
Figure 2.13. Sample cost model input showing the cost gap... 44
Figure 2.14. Annual and cumulative cost gap for Scenario #1... 45
Figure 2.15. Annual and cumulative cost gap for Scenario #3... 46
Figure 4.1. Decreases in FGD capital cost and increases in FGD efficiency as a function of world w et installed FG D capacity... 57
Figure 4.2. A model of the technology innovation process... 59
Table of Tables
Table 2.1. Updated Costs for Nth Plant SCPC Generation... 28
Table 2.2. Current costs for new fossil power projects... 31
Table 2.3. First- and Nth- of-kind cost CCS cost estimates in $/tCO2 avoided... 33
Table 2.4. Relevant technologies used for estimation of technological learning. ... 36
Table 2.5. Learning curves for post-combustion capture. ... 36
T able 2.6. C C S cost cases... 38
Table 2.7. Cost model output... 47
Table 4.1. DOE budget (in Millions) for CCS R&D from FY 1999 to FY2010 request. ... 62
Table 4.2. Fossil RD&D Energy Spending under the 2009 Stimulus Bill. ... 63 Table 6.1. Summary of policy categories and specific mechanisms for commercial deployment. ... 10 4 T able 8.1. C ost input details. ... 12 1
1. Introduction
Anthropogenic emissions of CO2 and other greenhouse gases are contributing to global climate change. Authoritative scientific assessments have concluded that continued high emission rates could lead to significant ecological and economic consequences (Metz et al., 2007). A
significant portion of these emissions come from the coal-dominated US power sector. Carbon capture and sequestration (CCS) technology offers a scalable solution to provide carbon
emissions mitigation from the power sector. Public policy will have to create a market for low-carbon technologies such as CCS, but it seems increasingly likely that any low-carbon pricing scheme that is politically feasible will not provide sufficient incentive for private industry to invest in low-carbon technologies such as CCS; therefore, other policy options are being considered so that significant commercial deployment of CCS technology can be achieved. This thesis seeks to develop a better framework for thinking about the different policies that will be required to make CCS a significant contributor to carbon emission mitigation in the US. This framework will consider the many facets of the innovation system for CCS technology, including the current state of CCS technology, the barriers to CCS investment in the US power sector, and how different policies support innovative activities at different stages in the innovation process. Using this framework, an analysis of policy options for a demonstration phase and for long-term commercial deployment of CCS technology is carried out.
.1. The Challenge
Anthropogenic emissions of CO2 and other greenhouse gases are contributing to global climate
change. Authoritative scientific assessments have concluded that continued high emission rates could lead to significant ecological and economic consequences (Metz et al., 2007). One
illustrative example of the costly consequences of climate change is the potential effect on water supplies in Asia if the Tibetan glacier melts; if this glacier disappears, the primary regulator of water supplies for one third of the world's population will be eliminated, leading to health, environmental, and economic problems in some of the world's poorest nations.
facilities. Figure 1.1 shows the number of major point sources of CO2 worldwide and the amount
of CO2 emissions from these sources.
Process Number of sources Emissions
(MtCOg yr'
Fossil fuels
Power 4,942 1.0539
Cement production 1,175 932
Refineries 638 798
Iron and steel industry 269 646
Petrochemical industrv 470 379
Oil and gas processing Not available 50
Other sources 90 33
Biomass
Bioethanol and bioeneigy 303 91
Total 7,887 13.466
Fi ,u 1.. Point Sources ( (O \\ orlwI ide (I N-1 P 2100.
Carbon capture and sequestration (CCS) technology can in principle be applied to many of these stationary sources. In CCS operation, CO2 is removed from the system, compressed, and sent
through a pipeline to a permanent storage location, usually in an underground geologic reservoir such as a deep saline formation.
Many billions of tons of CO2 emissions will have to be prevented if the worst effects of climate
change are to be averted. Socolow and Pacala identified several scalable "wedges": options that could, if deployed on a large scale, avoid the release of 1 gigaton of carbon (GtC) per year by 2050. Seven of these wedges would be needed if global carbon emissions in 2050 were to remain at today's level, as shown in Figure 1.2.
16 ~ 14 e 12 10 6 2000 2010 2020 2030 2040 2050 2060 Year
Figure 1.2. The Socolow and Paca wi edges. (Picala i nd Socolow, 2004)
Three of the potential fifteen wedges identified by Socolow and Pacala involve CCS in different sectors: coal-burning power plants, hydrogen plants, and synthetic fuels plants (Pacala and Socolow, 2004). This wedge model only accounts for stabilizing carbon dioxide emissions from now to 2050, but according to the IPCC and most experts, worldwide carbon dioxide emissions will need to be reduced by 15-25% by 2050 to avoid the most severe effects of climate change, making the scale of the challenge even more severe.
As a recent paper by Lester and Finan shows, the innovation challenge for low-carbon energy technologies is unprecedented, and no technology option can be excluded (Lester and Finan, 2009). There are relatively few currently available, scalable, low-carbon options for the US power sector, including CCS, wind, solar, nuclear fission, geothermal, and hydroelectric, and each of these comes with its own difficulties in reaching significant commercial scale
deployment. The result of their analysis is significant: even with an unprecedented rate of installation of each of these low-carbon electricity options, to maintain a reasonable economic growth rate, the required gains in energy efficiency of the US would be unprecedented and perhaps unattainable. If any one of these technologies were not available, the carbon emission reductions would likely have to come at the price of economic growth foregone. This
underscores the importance of pursing a serious effort in innovation in many technology options, so that the odds of being able to meet such emissions reduction targets without large reductions in economic growth are improved.
The United States has two major reasons to support the commercialization of CCS technology. One reason is that CCS is a scalable solution for reducing carbon dioxide emissions from a US power sector that today derives about 50% of annual electricity generation from coal-fired power plants (see Figure 1.3). The technology is highly compatible with the existing coal fuel and water infrastructure, and the potential for retrofitting some existing coal-fired power plants makes CCS a suitable option for application to the US power industry. Additionally, many large
industrial sources of CO2 such as cement, steel, and petrochemical facilities are potential candidates for CCS. 4.5 -Other 4.0 Generation ydro 3: 3.0- Nucl. 2 25 Gas 2.0- Petro. 1.5 1.0 - Coal 0.5 0.0
Figure 1.3. Electricity generation in the United States since 1950. Data: (US Energy Information Administration 2008);
Figure: (MIT Energy Club Factsheet 2008)
A second major reason for supporting commercialization of CCS is the domestic energy security provided by the hundreds of years of coal reserves known to exist on the North American
continent. With a recent history of significantly increasing imports of petroleum for
transportation energy supply, the US energy security strategy places a high value on the domestic supplies of traditional oil, gas, and coal resources as well as potential renewable energy
resources. CCS can play a vital part in continued energy security in the face of the challenge to drastically reduce carbon dioxide emissions over the next several decades.
To achieve this goal of CCS deployment, a market for the technology must be created by public policy. Whether through simple regulation and pricing of CO2 emissions, or through a more
complex package of regulations, subsidies, and other policies, public policy will be key to creating a market for CCS technology. Through these means, rapid adoption of CCS technology
will be made possible at a scale large enough to make a significant contribution to CO2
mitigation (e.g., > 1 GtCO2/year).
1.2. This Thesis
This thesis explores the possibilities of deploying CCS technology at commercial scale over the next several decades, and presents a framework for analyzing the policy options to achieve this goal. This framework is used to evaluate the options for promoting both demonstration and commercial deployment of CCS in the context of a CCS innovation system, including the presence of a market for the technology, the role of innovation in enhancing this market, and how policies supporting this system can accelerate commercial deployment of CCS.
To achieve this objective, this thesis will:
Explore the current state of CCS technology -Several major approaches to carbon capture technology will be introduced to show the technological variety in CCS. The current cost and future cost outlook for the technology will also be explored. Combined with certain assumptions about an eventual carbon pricing scheme, a cost model will be created to explore the "cost gap" for CCS that is the primary barrier to private investment in CCS, and this model will quantify the level of policy support needed to bridge this cost gap, create the market, and deploy CCS
technology at scale.
Explore the obstacles to large-scale deployment of CCS - Three major obstacles to
deployment of CCS exist today, including the absence of a clear legal and regulatory framework, the lack of an at-scale demonstration phase, and the absence of a market for CCS technology. Explore the innovation system for CCS technology- A short study of the history of S02
emissions control technology provides the motivation for describing the innovation system for CCS technology. A description of an innovation system is presented, connecting the current state of CCS technology and US power sector, both "market pull" and "technology push" policies, how these policies support different types of innovation, how innovation leads to cost reduction, and how commercial deployment is supported by this system. Finally, this system underscores the primary importance of "market pull" policies in the creation of a market and
CCS; additionally, this system underscores the need for a "technology push" strategy for CCS technology as complimentary to innovation after initial commercialization.
Explore the options for organizing demonstration projects, and evaluate the policy
proposals to achieve an effective demonstration phase - A framework for thinking about the organization of a demonstration phase is presented, including discussion of cost and risk
allocation between public and private actors, as well as project selection and management responsibilities. The current policy proposals for a demonstration phase are considered in the context of this framework, and recommendations are made where prudent. This analysis is supported by evidence from two additional sources: expert feedback on the effectiveness of the policy options for CCS provided at the MIT Expert Workshop on CCS Innovation (see Appendix Section 8.2 for details), as well as several interviews with project managers of current CCS projects.
Explore the potential policy goals for commercial deployment of CCS, and evaluate the combination of "technology push" and "market pull" policies required to achieve each goal in the context of an innovation system for CCS- Achieving the two different goals for
commercial deployment of CCS of market penetration and cost reduction will require a different mix of technology push and market pull policy. Using the lessons from the innovation system model, and considerations of economic efficiency, this analysis seeks to conclude which is the best goal to choose, and which policy proposals might best support its achievement.
2. CCS Technology and the Cost Gap
This section explores the current state of carbon capture technology, showing the current range of technologies and the lack of any clear technology winner. The costs of the complete CCS system will then be explored, including a discussion of recent cost escalation and a model of future cost reduction. Finally, a cost model shows the existence and quantifies the magnitude of a "cost gap" for the technology, stemming from the relatively high costs of the technology compared with a politically feasible carbon pricing system for the US. The policy implications of this cost gap are then discussed.
2.1. Capture Technology Overview
Conceptually, the task of avoiding emissions of CO2 from power plants is straightforward: collect the hot flue gas emitted by the plant, compress it, and inject it into permanent geological
storage. The flue gas from a traditional coal plant consists mostly of N2, with CO2
concentrations in the range of 10-15%. The major problem with compressing and storing this untreated flue gas is the prohibitively expensive energy requirement for compressing such massive volumes of gas to the high pressures suitable for deep geological storage. The engineering solution to this problem is to separate out the CO2 at some point during the plant process. The three main technological approaches to CO2 separation are: post-combustion
capture, which is primarily a N2-CO2 separation process added to the back-end of a pulverized coal (PC) or natural gas combined cycle (NGCC) plant, pre-combustion capture, which is an H2
-CO2 separation process embedded in an integrated gasification combined cycle (IGCC) plant, and oxy-fiel combustion, which is an 02-N2 separation to provide high-purity oxygen for
combustion to avoid the dilution of the flue gas by nitrogen. 2.L.1. Post-Combustion Capture
Post-combustion capture technology is an approach that is potentially suitable for many industrial applications, including both new and existing pulverized coal power plants, cement factories, oil refineries, steel plants, and natural gas power plants (UN-IPCC, 2005). As the name indicates, the goal of this type of system is to capture the CO after the fossil fuel has been
burned. A diagram describing this approach as applied to a pulverized coal power plant is shown in Figure 2.1.
Flegs SRClean flue Solv To
Coal_.- o scube
Boiler.:
superheatel
Flue ga SCR ESP FGg
HP steam Steam turbine. Solvent
electrical Condenser -4 regen Loc2
2enerator
LP steam FlyashR eturn water
Fig1u1irc 2.1. Proce s fihm diag rai for1 post-combution capture o -,I a pulIerized coal 1)11111 (H1oh in, 2006)
Before entering the carbon dioxide scrubber, the flue gas is cleaned of particulate matter, nitrogen oxides, and sulfur oxides to comply with existing environmental regulations and to minimize contamination of the CO2 capture system. The leading approach for the
post-combustion CO2 capture system is chemical absorption using a liquid solvent (JN-IPCC, 2005).
This approach is shown in Figure 2.2.
SCR - Selective Catalytic Reduction NO. removal technology; ESP -Electrostatic Precipitator particulate matter removal technology; FGD - flue gas desulfurization SO,, removal technology.
Figure 2.2. Post-combustion solvent capture system (U' N-IPC(., 2005)
The flue gas in post-combustion systems is typically between 3 and 15% CO2, with the higher
fraction typical of coal combustion and the lower fraction in a natural gas combined cycle plant (UN-IPCC, 2005). A C0 2-lean solvent is allowed to contact this C02-rich flue gas, and this
solvent chemically reacts with the CO2, removing it from the flue gas stream. The C0 2-depleted
flue gas is then sent to the plant stack, and the C0 2-rich solvent is sent to a regeneration unit. A
large amount of thermal energy is required to release the CO2 from the C0 2-rich solvent, since
the regeneration is a temperature-swing process. This energy is usually supplied by diverting a portion of the steam that would normally be used by the steam turbines in the power block. The released CO2then exits in a fairly pure form, and can then be compressed, dehydrated, and
transported for sequestration (UN-IPCC, 2005). The resulting C0 2-lean solution is recycled to
the absorber.
2.1.2. Pre-combustion Capture
Pre-combustion CO2 capture is typically used in facilities processing a hydrocarbon fuel into a
synthesis gas for further processing. In a power plant configuration, such a plant is called an integrated gasification combined cycle (IGCC) plant, since the fuel is first gasified to produce synthesis gas, which is then burned in a gas turbine as shown in Figure 2.3.
t
C02 to Compression and Drying
-Water-- Water 2-Stage Clean Gas
Gasifier -Syngas Shift Acid Gas Turbine &
Air Separation -Oygn Removal Syngas Generator
Unit Oxygen
Flue Gas Air Nitrogen
Steam Heat
Condenser +- Turbine & HP Recovery _Flue Gas,
Gnrtr Steam Steam To Stack
Generator Generator
Return Water
I
H re 2. Procen 1om diagram for ( 0( pilau w ith pre-combustion captie. ( Bohtn. 2006)
The pre-combustion capture system consists of both an initial reactor stage, the gasifier, followed by a gas separation step. The gasifier produces a hot, high-pressure synthesis gas consisting
mostly of H2 and CO. The CO in the synthesis gas is further converted to H2 and CO2 by
reaction in a water-gas shift reactor, after which the remaining gas is mostly H2 and CO2. This
gas is then treated in the CO2 capture process, which commonly involves physical solvent
absorption, rather than the chemical solvent absorption used for post-combustion capture. This pre-combustion capture system requires significantly less energy than a post-combustion chemical absorption system. Since the partial pressure of CO2 in the pre-combustion gas is two
orders of magnitude greater than in the post-combustion flue gas, a reversible physical reaction using pressure-swing regeneration is employed rather than an energy-intensive chemical reaction requiring a temperature-swing regeneration (UN-IPCC, 2005). Note that even though the CO2 separation process is significantly less energy-intensive for an IGCC plant compared to a PC plant, the water-gas shift reactor requires a significant energy input in the form of steam. This leaves the IGCC plant with pre-combustion capture with only a modest energy efficiency advantage when compared to a PC plant with post-combustion capture.
2.1.3. Oxy-fuel Combustion
The oxygen-fired or "oxy-fuel" combustion approach refers to a variety of combustion processes where the separation system is in the oxygen plant, where an 02-N2separation occurs, and the
high-purity oxygen is used for combustion in the power system, therefore reducing the dilution effect of nitrogen in the resulting flue gas. One major oxy-fuel approach is the modified
pulverized coal power plant, which burns coal in high-purity oxygen instead of air. This process is shown in Figure 2.4.
The oxygen comes from an air separation unit, sometimes called an oxygen plant, to create a high-purity stream of oxygen. Many oxy-fuel systems will use a boiler that is very similar to a traditional air-fuel pulverized coal boiler. When the coal is burned in oxygen instead of air, the heat transfer characteristics in the boiler change, so a flue gas recirculation stream is sometimes used to modify the heat transfer and avoid abnormally high boiler-wall temperatures (Bohm, 2006). The flue gas is then treated for environmental pollutants such as SO2 in the FGD unit and
particulate matter in the ESP unit2, and since the remaining gas contains mostly steam and carbon dioxide, the compression step will condense most of the steam leaving high-purity CO2gas ready for transportation and sequestration.
Flue Gas Recirculation
Nitrogen
compesion
Air Oxygen and pipeline
separation Boiler/
unit superheater H
FFulya ESsFG
steam Steam turbine/:
--- --- electrica Condenser
tCoal -- erto
Air
Fly ashi Return wvater
Figure 2.4. Process dia-ram for oy-fiuel combustion . Bohm, 2006)
2.1.4. Comparison of Three Major Capture Approaches
Comparing the three leading carbon capture approaches above, there is no clear technology winner from a cost, performance, or reliability perspective. These latter factors may prove to differentiate CCS technology, but the differences are not apparent today:
" Cost: The cost estimates for each of these capture technologies vary widely and often overlap when including reasonable uncertainty bounds (see Section 2.2).
" Performance: All technologies can achieve 85%+ emissions reduction versus reference, though some differences in net plant efficiency may exist (UN-IPCC, 2005).
* Reliability: All three capture technologies have little operations experience, making comparison difficult. However, there is much more experience with PC plants than IGCC plants, and early experience for IGCC demonstrations has shown availability problems for the technology (Javetski, 2006).
Long-term cost, performance, and reliability differences may well appear, and commercial-scale demonstration projects will be useful in revealing these differences; as of today, there is no evidence of a clear carbon capture technology winner. Additionally, the market for CCS will be heterogeneous (due to different coal types or geographic locations), so multiple technologies could be "winners", depending on the specific nature of the plant.
2. .5. Rletrofit Application
Most of the cost analyses for CCS performed over the past several years have focused on the application of CCS technology to new plants, but there is a large potential for retrofit of existing coal-fired power plants using post-combustion capture technology. If deep cuts in US carbon
emissions are to become a reality, either retrofitting CCS to existing coal plants or
decommissioning them will be necessary, since the existing fleet of US coal power plants emits nearly 2.4 GtCO2 annually (Dalton, 2008). Some experts believe that perhaps 60% of the current
US coal fleet could be potentially retrofitted with post-combustion CO2capture, but to date, no
exhaustive analysis of the retrofit potential on actual commercial plants has been performed (MIT Expert Workshop, 2009). Coal power plants in the US have traditionally been built by
engineering, procurement, and construction contractors as one-off projects with every project slightly different from the next. The Electric Power Research Institute (EPRI) has noted some of the important issues in determining the retrofit applicability to an existing plant (Dalton, 2008):
* Space: Perhaps 6 additional acres will be needed to retrofit a 500 MW plant. Has the installation of other environmental control technologies like flue-gas desulfurization (FGD) and selective catalytic reduction (SCR) left enough space for a capture plant? * Steam: Can the low-pressure steam for solvent regeneration be accessed and
transported where needed?
* Lost Capacity: How will the generating capacity sacrificed to power the capture system be offset?
* Cost: How much more will CCS retrofit cost than a CCS installation on a new plant? It is worth noting that retrofit FGD systems cost 1.2-1.8 times more than new plant FGD systems.
* CO2 Storage: Can the CO2 be transported and sequestered? The existing plant may be located quite far from suitable sequestration geology, thus increasing the cost of transport significantly.
This thesis will not focus on policy mechanisms specifically dealing with existing power plants such as retrofit CCS or retirement of older coal power plants. Some of the policy mechanisms analyzed are valid for either new plants or retrofits.
2.L6. CCS for Other Industrial Sources
As shown above in Figure 1.1, there are many large stationary sources of CO2 outside of the power sector where CCS could potentially be applied. The main industrial sources for CCS are natural gas sweetening operations, steel plants, cement plants, and petrochemical refineries (UN-IPCC, 2005). In some parts of the world, natural gas comes out of the ground with a high percentage of C0 2, and must be "sweetened" to make the gas pipeline-quality. A carbon capture
process is used to clean the gas of CO2. In fact, several large carbon sequestration projects are
currently using natural gas sweetening as the CO2 source. These include projects such as Statoil-Hydro's Sleipner and BP's. In Salah which are two of the major carbon sequestration
blast furnace plants as well as electric-arc mini-mill plants. This would help reduce the
emissions from the steel industry from the estimated 1400 MtCO2 emitted annually worldwide in 1995. In cement production, fossil fuels are used to drive the energy-intensive limestone
calcination process, producing a flue gas potentially suitable for a post-combustion CO2 capture approach. In the petrochemical processing industry, oil refineries and ethylene and ammonia plants are major sources of CO2 emissions, and a large carbon capture potential also exists here.
While these industrial CCS approaches are not the major focus of this report, they will be considered in later sections of this thesis where they are relevant to the public policy discussion.
2 2. CCS Costs
This section explores the current costs of CCS and presents a model of future reductions in CCS cost through technological learning.
2.2. 1. The Cost of CCS Today 2 .2.) LL Recent Cost Volatility
The cost of power plant technologies has increased significantly since the year 2003, although there are recent signs that this trend has leveled off. This cost escalation has mostly affected
capital costs, but fuel costs have also risen. To account for this recent cost escalation, this work updates the CCS cost estimates originally presented in The Future of Coal (Moniz and Deutch, 2007). Figure 2.5 shows several cost and price indices from 2000 to 2009 to illustrate this recent price volatility.
210
-HS/CERA Power Capital Cost
190 Index (excluding nuclear)
o0--Chemical Engineering Plant Cost
II
170 Indexo - Producer Price Index Steel Mill
o 150 Products
X 130 - Consumer Price Index
E 110 --- Average US Free-on-Board Coal
Price Index
90
2000 2001 2002 2003 2004 2005 2006 2007 2008 2009 2010
Figure 2.5. Cost and Price Indices since 2000. (Bureau of Labor Statistics, 2008b, Bureau of Labor Statistics, 2008a. Chemical Engineering Magazine, 2000-2009, Encrgy Information Administration, 2008, 1IS/CE RA, 2008)
There are several reasons for the recent escalation in capital and fuel costs (Chupka and Basheda, 2007):
e Capital
-o Increasing gl-obal demand f-or the raw materials, such as steel, cement, c-opper, and nickel, required to build new plants.
o High global demand for plant components, such as turbines, boilers, and scrubbers, has increased prices due to vendor capacity limitations. o Engineering, labor, and construction costs have increased as well.
Engineering, procurement, and construction (EPC) contractor backlogs became more common during this period.
" Fuel -Coal fuel price has almost doubled since 2000, and continues to increase in the US, probably as a result of increasing demand under rail shipping capacity constraints and increased US coal exports.
The MIT Future of Coal report, published in March 2007, includes a cost estimate for new coal plants (Moniz and Deutch, 2007). This original cost estimate was derived from an extensive review of plant design studies from 2000-2004, then standardized for capacity factor, capital
This information was combined with expert opinion and reviewed by technology providers and others to arrive at a final cost estimate. Cost escalation since 2000 was acknowledged in the original report, but was not accounted for in the final cost estimate.
22. 12. U pdite of MI TPost-combuistion CS Costs
This cost update focuses on post-combustion CCS on a supercritical pulverized coal (SCPC) plant, since the recent literature and discussion with industry experts support these new
estimates. Because of a lack of raw data, new cost estimates for pre-combustion capture on an IGCC plant and oxy-fuel combustion technology are not presented here. Significant uncertainty about this updated cost estimate must be acknowledged; while this update attempts to account for recent cost escalation in a transparent manner, this attempt is akin to trying to hit a moving target; the market remains highly volatile and costs are constantly changing.
The estimate of costs for an Nth-of-a-kind3 (NOAK) SCPC power plant, both with and without post-combustion CCS, has been updated to a 2007$ basis according to estimates of recent escalation in capital, operating, and fuel costs. The updated cost estimate is shown in Table 2.1.
3 NOAK means the Nth plant built where N is less than 10; this assumes significant cost reduction through
I able 2.1. Updaled Costs for Nth P'lant S(IP( (Generationl
Reference Plant Units SCPC
Total Plant Cost (1)5 $/kWe 1910
CO2 emitted kg/kWh 0.830
Heat Rate (HHV) Btu/kWh 8868 Thermal Efficiency (HHV) (2) 38.5% Capital (3) $/MWh 38.8 8 Fuel $/MWh 15.9 8 O&M $/MWh 8.0 Total $/MWh 62.6 Post Combustion CO2 Capture Plant
Total Plant Cost (1) $/kWe 3080 CO2 emitted @ 90% Capture kg/kWh 0.109
Heat Rate (HHV) Btu/kWh 11652 Thermal Efficiency (HHV) (2) 29.3% Capital (3) $/MWh 62.4 5 Fuel $/MWh 20.9 8 O&M $/MWh 17.0 Total $/MWh 100.3 $/tonne CO2 avoided vs. SCPC (4) $/tonne 52.2
The capital costs were escalated with the IHS/CERA Power Capital Costs Index (PCCI) for Coal Power (IHS/CERA, 2008). The original values were deflated from 2005$ to 2002$ using a CPI index as reported in Table A-3.C.5 in The Future of Coal (Moniz and Deutch, 2007). The values were then escalated to 2007$ using the CERA PCCI, from 112 in 2002 to 177 in 1st quarter of 2009. This represents an increase of 44% in capital costs as compared to the original data. The fuel costs for bituminous Illinois #6 coal have also increased from $1.50/MMBtu delivered cost to $1.79/MMBtu in 2007. This data was collected from the quantity-weighted average price of delivered coal from the Illinois basin in 2007 from FERC Form 423 data. This represents an increase of 19% in fuel price as compared to the original data.
4 Cost Estimate Details: 500 MWe plant net output; 85% capacity factor; Illinois # 6 coal (61.2% wt C, 10,900 Btu/lb HHV, $1.79/MMBtu); for Oxy-PC CO2 for sequestration is high purity; for IGCC, GE radiant-cooled gasifier for no-capture case and GE frill-quench gasifier for capture case; 20-year payback period.
I Table 1 Notes: (1) Assume Nth plant where N is less than 10 (assumes significant cost reduction from learning in construction/operation); (2) Efficiency = 3414 Btu/kWe-h /(Heat rate in Btu/kWe-h); (3) Annual carrying charge of
15.1% from EPRI-TAG methodology, based on 55% debt @ 6.5%, 45% equity @ 11.5%, 38% tax rate, 2%
The operations and maintenance (O&M) costs were scaled by the CPI index from 195.3 in 2005 to 207.3 in 2007. The CPI data is from the US Bureau of Economic Analysis. This represents an increase of 6% in O&M costs since 2005.
22.. 13. Capital Cost Coiparison
Table 2.2 compares this updated capital cost estimate with several publicly available sources, including design studies as well as actual plant estimates from recent press releases and PUC filings from 2007 and 2008. The capital cost numbers are presented in $/kW on a total plant cost (TPC) basis where possible, except for the actual plant estimates which are on an unknown cost basis.
The following general conclusions were drawn from the cost estimation study:
" This updated cost estimate for SCPC is within the range of recently reported design studies, but is consistently lower than each of the actual plant estimates, which is expected since this estimate is for an NOAK design.
" Our updated cost estimate is generally lower than the S&P and CERA estimates, but higher than the NETL estimate. Note the large variance in the cost data within each plant type; this variance supports the fact that there is no current consensus on power plant costs.
* With few exceptions, the actual plant estimates report costs significantly higher than the design study estimates.
Total Plant Cost ($/kW) (where possible)
Fuel Estimate Estimate Name Date SCPC SCPC IGCC IGCC Oxy-PC
Type Type w/CCS w/CCS MIT Update CERA (Jones, 2008)6 NETL (2007) S&P (Venkataraman, 2007)7 NETL GE (2007)
NETL Conoco Phillips (2007) NETL Shell (2007)
Duke - Cliffside, NC Duke -Edwardsport, IN AEP -Mountaineer, WV Tampa Electric -Polk Co., FL
Mar 2008 May 2007 May 2007 May 2007 May 2007 May 2007 May 2007 May 2008 June 2007 July 2007 $1,910 $2,300 $1,575 $2,216 $3,080 $4,150 $2,870 $3,071 $2,800 $4,230 $2,541 $1,813 $1,733 $1.977 $4,230 $2,895 $2,950 $2,390 $2,431 $2,668 $3,000 $3,730 $3,545 $2,554 EPRI (2006) Oct 2006 $1,950 $3,440 $2,390 $3,630 BERR/CPCC (2007)8 Mar 2007 $2,618 $4,445 $4,586
S&P (Venkataraman, 2007) May 2007 $2,659 $3,068
AEP/SWEPCO -Hempstead,
Sunflower -Holcomb, KS AMP Ohio -Meigs Co. OH Tenaska -Sweetwater Co., TX Southern Co. -Kemper Co.,
Dec 2006 Sep 2007 Jan 2008 Feb 2008 Dec 2006 $2,800 $2,572
$3,300 - note uses both bit. and PRB coal
$5,000
$3,000
The actual plant estimates for SCPC generally show much higher costs than the design study estimates, which is perhaps unexpected. These plants use mature technology with significant construction and operating experience, and EPC contractor guarantees for cost and performance are common. Despite this, it would seem that the effects of materials cost escalation and high market demand for new plant construction have outstripped estimates of cost escalation published in even the most recent studies.
6 Adjusted downward from all-in capital cost (which includes owner's costs, etc.) assuming all-in cost is 30%
greater than total plant cost per EPRI TAG methodology.
7 Adjusted downward from all-in capital cost assuming all-in cost is 10% greater than engineering, procurement,
00
-0
2d 0
- U'6
,
2 .1 Rer-esentative Costs for CCS
Given the high uncertainty surrounding CCS cost estimation, two recent CCS cost studies have provided likely ranges for CCS costs, both for first-of-a-kind (FOAK) plants and Nth-of-a-kind (NOAK) plants (2008, Al-Juaied and Whitmore, 2009).
The first study is from the Harvard Kennedy School's Energy Technology Innovation Policy program. The avoided cost for FOAK plants is estimated to be approximately $120-$180/tCO2
in 2008$, and the estimated avoided cost for NOAK plants are much lower at $35-70/tCO2.10 These estimates do not include the costs of transportation and storage of C0 2, which are
estimated here as $1 /tCO2 avoided. This is within the range estimated by the IPCC Special
Report on CCS and the MIT Future of Coal Study.
The second study from McKinsey and Company also presents some representative costs of CCS. These costs include capture, transportation, and permanent geological storage and are shown in Figure 2.6. This thesis assumes the demonstration phase estimate is essentially a FOAK
estimate, and the early commercial phase cost is essentially a NOAK estimate.
9 A FOAK costs estimate includes costs faced by first movers due to initial errors and miscalculations in building
engineering projects; as several iterations of the technology are built, these first-mover costs come down significantly, eventually reaching the NOAK cost level.
10 This thesis will define all references to a ton to mean a "metric" ton and all references will be to CO2 and not C
40 E 0 < 0 00 0 0 $140 $120 $100 $80
$60
$20 $0 2010) $129L $
86
Demonstration
$72
$64
Phase (2015) $50 $43Early Commercial Mature Commercial
Phase (2020) Phase (2030+)
2015 2020 2025 2030 2035
Year
Figure 2.6. Representative Costs of CS from N ekinse. paper, ida pted"I from (2008).
In summary, the FOAK and NOAK cost estimates are shown in Table 2.3.
Table 2.3. First- aId Nth- of-kind CCS cost estillates inl S (CO, axoided.
McKinsey Lower Upper
$86 $129
$50 $72
Harvard12 Representative
Lower Upper Cost
$130 $190 $126
$45 $80 $63
Using the MIT Cost Estimate from Table 2.1, along with the context of the data from the McKinsey and Harvard studies, a representative cost of CCS was chosen to be $52.2 (from the MIT post-combustion CCS cost-estimate in Table 2.1) + $10 (additional for transportation and storage of C0 2) $63 for the NOAK cost and, double this quantity, $126 for the FOAK cost. These representative costs will be combined with the following section on future CC cost reduction as an input to the cost model presented in Section 2.3.
FOAK NOAK
2.2.2. A Model for Future CCS Cost Reduction
This section uses the current costs of CCS along with empirical estimations of technological learning to develop a model for future CCS cost reduction.
In the past, costs for other major energy and environmental control technologies have shown an initial increase followed by a decrease in costs. The costs increase as pre-commercial
technology studies are updated to reflect increasing knowledge about limitations on design or performance of the technology. These costs increase to some peak known as a first-of-a-kind
(FOAK) cost.13 This peak is then followed by cost reduction in two phases; an initial quick cost reduction phase after building a few facilities reduces costs to the nth-of-a-kind (NOAK) cost level followed by some slower rate of continued cost reduction as the installed capacity of the technology increases. The cost reductions following the FOAK cost peak come from experience in design, construction, and operation; collectively these cost reductions are known as
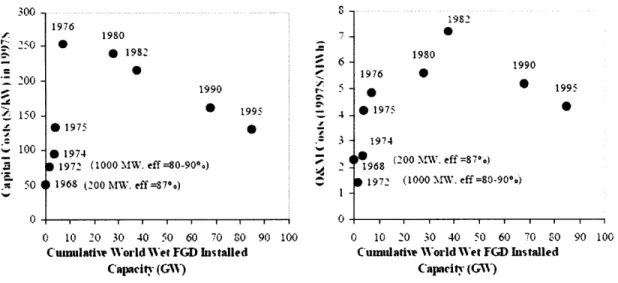
technological learning, which include "learning-by-doing" and "learning-by-using" (these mechanisms for cost reduction are explored further in Section 4.3.1). The initial peak and subsequent reduction of cost through technological learning are evidenced by the major differences in FOAK and NOAK costs presented in Section 2.2.1.2. Additionally, Figure 2.7 shows the historical capital and operation costs for wet FGD SO2 reduction technology; the costs
increase initially due to underestimation in pre-commercial studies, followed by a cost peak after commercial projects are built, and continued reduction of costs over time due to technological learning.
13 Due to the high uncertainty and lack of retrospect in current CCS cost estimates, we cannot know if current
pre-commercial cost estimates, such as what is presented in Section 3.1, can be truly representative of FOAK or NOAK
3100-1982 1976 1980 ~20 1982 1980 200 -1990 199-6 1990 S 0091975 3 -91974 0 972 (1000 MW. eff =80-90) 968 (200 MW. eff =87*) 50 4 1968 (200 MW. eff =870.) 1972 (1000 MW. eff =80-90 0 ) 0 , , i, , ,1, , , 0 i i 0 10 20 30 40 50 60 70 80 90 100 0 10 20 30 40 50 60 70 50 90 100 Cumulatiw World Wet FGD Installed Cumulati'w World Wet FGD Installed
Capacity (GW) Capacity (GW)
Figure 2.7. Exa mple of lea rnin-bN -doing cost red uct ion in W ct F G ) SO' reduction tech n olog ( A G reenhouse ( Gas R&D Programme, 211006).
Ignoring the initial cost increases from pre-commercial studies (see footnote 13 for explanation), this thesis assumes that CCS technology will show similar cost reductions through technological learning over time, given that the technology in this case is similar to these mature technologies. A study by the IEA Greenhouse Gas R&D Programme and Carnegie Mellon University
quantitatively estimated technological learning for CCS systems through empirical experience curves, such as the data shown in Figure 2.7 (IEA Greenhouse Gas R&D Programme (IEA GHG), 2006). The experience curves for seven relevant technologies, for both capital cost and operations and management (O&M) cost, were calculated from empirical data. Table 2.4 shows the seven relevant technologies and which part of the CCS system they are relevant to.
I It, 2.4 eIIil I techno ovies se( foI r vstina titn th ter o i I nIicaI ng.:I I, Adapted r m (II ( reeF hxoue I II Gas IR&. D
Progran It I IHGC),1 e E G 20060
Technology Relevance to CCS System
Flue gas desulfurization (FGD) Post-combustion capture
Selective catalytic reduction (SCR) Post-combustion capture
Pulverized coal (PC) boilers Oxy-fuel combustion
Natural gas combined cycle (NGCC) Pre-combustion capture Liquefied natural gas (LNG) production CO2 liquefaction
Oxygen production Oxy-fuel and pre-combustion capture
Steam methane reforming (SMR) Pre-combustion capture
The authors then considered the three main CCS capture approaches: post-combustion capture on a PC plant, pre-combustion capture on an IGCC plant, and oxy-fuel combustion. Here we assume that the model for post-combustion capture on a PC plant is representative of CCS technology.
First, the plant's capital and O&M costs were split up by the relative contribution of each plant subsystem to the overall cost. Each plant subsystem was then assigned an empirically-derived learning rate for the relevant existing technology. The costs were then aggregated to estimate an aggregate plant learning rate and experience curve. The log-linear experience curve model is shown as Equation 2.1:
Technology Cost = Starting Cost * (Installed Capacity) -b (2.1)
And the learning rate, the estimated cost reduction for each doubling of installed technology capacity, is defined as Equation 2.2:
(2.2) Learning rate = 1-2-b
The important results from the IEA GHG study are shown in Table 2.5.
V Thk Ixarnin(_ con es I')r pos t-comhwoio (J11tlfr.
COE No Capture ($/MWh) COE With Capture'($/MWh)
b -.018 -.04
Learning rate 1.2% 2.7%
The two learning curves were then combined to yield a learning curve best-fit equation for cost as a function of built capacity for the post-combustion capture case; this best fit-equation will be the primary model for CCS cost and technological learning in the cost model. Equation 2.3 shows the formula for calculating the avoided cost per tonne CO2of CCS technology:
Avoided Cost = COEcapture-COEno capture
emission rateno capture-emission ratecapture
Where COE is the cost of electricity in $/MWh (represented by the learning curve from Table 2.5) and emission rates are the CO2 emission rates in tCO2/MWh as presented in the MIT
post-combustion CCS cost update in Table 2.1. The avoided cost of CO2 was then calculated as a
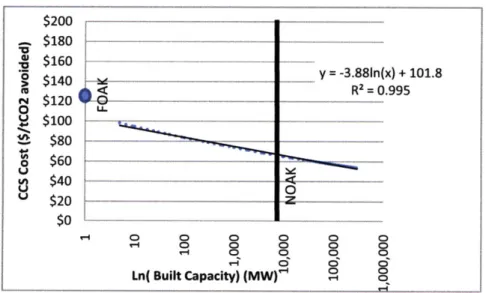
function of built capacity. The regression of the avoided cost as a function of built capacity yields a logarithmic learning curve, or technology cost curve, the result of which is shown as Figure 2.8.
Figure 2.8. Plot of technology cost curve with logarithmic regression.
This technology cost curve is used as the basis for the cost input in the cost model constructed in the next section.
(2.3) $200 $180 .5 $160 - y = -3.881n(x) + 101.8 N $120 $100 S$80 0' $260__ _ $202 $0 '- 0 0 0 0 0 0 - 0 0 0 0 Ln( Built Capacity) (MW)r '
2.3. Cost Model
The section establishes the existence of a "cost gap" for early investment in CCS and presents a cost model to quantify the innovation challenge resulting from this cost gap. This innovation challenge is the "above-market"14 investment required to deploy CCS by 2050. First, the three major inputs to the model are described. Next the sample output and behavior of the cost model
are explained. Finally, several scenarios and the output results of these scenarios are presented and discussed.
2.3.L. Model Inputs
.3. 1.L. Costs
The first major input is the CCS technology represented by a technology cost curve, modeled as CCS avoided cost (in $/tCO2avoided) as a function of built capacity (in MW). The technology
cost curve represents the trajectory of CCS costs from the demonstration phase to the commercial deployment phase. The base case curve was derived from the regression model results for cost reduction through technological learning, as presented in Figure 2.8.
Additionally, a high and a low cost case were developed by adjusting the NOAK costs to $100/tCO2 for the high case and $50/tCO2 for the low case; the cost curve was simply shifted upward by $100-$63=$37 and downward by $63-$50=$13, respectively. An example of the cost model input is shown as Table 2.6 and Figure 2.9.
Case NOAK Cost FOAK Cost
($/tCO2avoided) ($/tCO2avoided)
Base 63 126
High 100 163
Low 50 113
14 An "above-market" cost is simply referred to as a cost above and beyond the carbon market price that must be
$200 $180 $160 $140 0 $120 * $100 $80 $60 $40 $20 $0 0( 0 0 Ln( Built Capacity) (MW) . Base ---- High -Low 0--Z 00 00 0 0 0 0 8- 8 0 O -O 0 O O'O
Figure 2.9. (ost model inputs showing FOAK and NOAK costs.
Note the gap in the curve at low values of built capacity; due to the asymptotic behavior of logarithmic functions, the learning curve cost model only approximates the starting FOAK value, which turns out not to be important because the function is only utilized at values of 10 MW built capacity and greater.
2.3.1.2. Adoption Rate
The second major input is an adoption path for an assumed rate of CCS deployment in the United States, which is primarily based on the deployment goal derived above. The path is modeled as built capacity (in GW) as a function of time (in years). A base case, a high case, and a low adoption case are created.
First, the model assumes that 10GW of demonstration and initial commercial projects will take X years from a 2010 start. The base case assumes X is 10 years, the high case assumes 8 years, and the low case assumes 20 years. This is represented in the model as a straight line increase from (zero years, zero GW) to (X years, 10 GW). This period is needed for technological learning to reduce the cost from the FOAK level to the NOAK level, which is consistent with discussions in the Harvard (Al-Juaied and Whitmore, 2009) and McKinsey (2008) cost studies explored earlier
in Table 2.3.
-U
U