HAL Id: cea-02972126
https://hal-cea.archives-ouvertes.fr/cea-02972126
Submitted on 20 Oct 2020
HAL is a multi-disciplinary open access
archive for the deposit and dissemination of
sci-entific research documents, whether they are
pub-lished or not. The documents may come from
teaching and research institutions in France or
abroad, or from public or private research centers.
L’archive ouverte pluridisciplinaire HAL, est
destinée au dépôt et à la diffusion de documents
scientifiques de niveau recherche, publiés ou non,
émanant des établissements d’enseignement et de
recherche français ou étrangers, des laboratoires
publics ou privés.
Performance evaluation for co-channel coexistence
between ITS-G5 and LTE-V2X
Pierre Roux, Valerian Mannoni
To cite this version:
Pierre Roux, Valerian Mannoni. Performance evaluation for co-channel coexistence between ITS-G5
and LTE-V2X. VTC2020-Fall - The 2020 IEEE 92nd Vehicular Technology Conference„ Nov 2020,
Victoria, Canada. �cea-02972126�
Performance evaluation for co-channel coexistence
between ITS-G5 and LTE-V2X
Pierre Roux
1, and Valerian Mannoni
21 CEA, LIST, Saclay Nano-INNOV, Bˆat 862 - PC 173, 91191 Gif-sur-Yvette, France 2 CEA, LETI, Minatec Campus, 17 rue des Martyrs, 38054 Grenoble, France
{pierre.roux, valerian.mannoni}@cea.fr
Abstract—Two technologies are currently competing for pro-viding Vehicle-to-Everything (V2X) communication services in Europe and in the 5.9 GHz ITS band. The oldest one is known as ITS-G5 and specified by ETSI, and the new comer is standardized in 3GPP and derived from LTE technology. It is now conjectured that both technologies will coexist in the deployment phase, at least during a transition period. Several coexistence scenarios are currently under study. Some of them are even considering the option to share a 10 MHz radio channel in the 5.9 GHz band among both technologies under the same geographical area. This approach is called co-channel coexistence. New mechanisms are currently explored and assume some modifications of the standards aimed at minimizing the performance losses. This co-channel coexistence scenario requires a careful assessment, and this article proposes the first performance evaluation in this particular context of coexistence between ITS-G5 and LTE-V2X standards. It presents a simulation work that has been carried out with the purpose of assessing performance of mixed deployments, and also assessing the efficiency of one possible coexistence mechanism. It is based on system level simulation which is itself relying on physical layer performance assessment pertaining to both technologies. The simulation methodology is presented and evaluation results are provided and commented.
Index Terms—vehicle communications, coexistence, mobility, performance evaluation
I. INTRODUCTION
Vehicle-to-Vehicle (V2V) and Vehicle-to-Infrastructure (V2I), commonly referred to as Vehicle to Everything (V2X), are wireless systems currently under development to address several Intelligent Transport Systems (ITS) standardization and regulatory initiatives worldwide. Two standards are emerging in Europe as candidates for V2X operation, namely ITS-G5 and LTE-V2X.
ITS-G5 has been developed by the European Telecommu-nications Standards Institute (ETSI) and relies on the IEEE 802.11p standard for vehicular networks [1].
On the other hand, LTE cellular systems are evolving towards vehicular communications applications. 3GPP Release 14 has brought two new modes at the so-called PC5 interface that describes V2X communications: modes 3 and 4. In this paper, we focus on PC5 mode 4, which is purely based on sidelink autonomous and distributed resource selection algorithm, and does not require support or control from a cellular eNodeB.
Both technologies are now promoted and competing for the same ITS band, located at 5.9 GHz [2]. With strong supporting stakeholders for both standards, it is unlikely that a single wining technology will emerge soon. It is likely on the contrary that both technologies will coexist in the 5.9 GHz band in some geographical areas. It is even possible that both technologies will share the same 10 MHz radio channel in this band, which is referred to as co-channel coexistence. Of course, the simultaneous usage of the same RF channel by
both technologies will result in mutual influence, which might affect the performance of both systems.
Due to the heterogeneous nature of both Physical (PHY) and MAC layers, it is important that the situation of having vehicles equipped with different technologies, operating in a common road infrastructure, is characterized and well under-stood.
In anticipation of loss of performances due to coexistence, several mechanisms are currently under study [3] with the aim to reduce such performance losses. We have selected the most relevant of these mechanisms to be addressed in terms of efficiency. This mechanism assumes no modifica-tion regarding ITS-G5 vehicles. However, PC5 mode 4 radio systems are modified to send an ITS-G5 preamble and its associated header before transmitting its PC5 mode 4 sub-frames. With this modification, since ITS-G5 devices perform Clear Channel Assessment (CCA) before transmission, this evolution makes them more sensitive to detect activity from surrounding modified PC5 mode 4 devices.
In this paper, we give the first co-channel coexistence evaluation addressing the issue of simulating coexistence scenarios in a given geographical area, assuming a single 10 MHz channel in the 5.9 GHz ITS band shared between ITS-G5 and PC5 mode 4 vehicles. For simplicity, we only consider a mix of vehicles with half of them using ITS-G5 and the other half using PC5 mode 4. Every vehicle is broadcasting regular Context Awareness Messages (CAM) to be received by neighbor vehicles of the same technology. As an outcome of the simulation, we observe average CAM decoding success ratio among neighbors as a function of the maximum neighboring distance.
This simulating approach is referred to as ”system level simulation” [4] and it is detailed in Section III. However this approach also requires physical layer simulations to be carried out, as described in Section II. The output of physical layer simulations serve as an input to the system level simulation. It is made of a set of physical layer performance curves providing decoding success ratio for different configurations. Section III evaluates the performance of the system level simulation and finally a conclusion is made in Section IV.
II. V2X PHYSICAL LAYER PERFORMANCE ASSESSMENT
To evaluate the performance of the considered co-channel coexistence approach using system level simulations and to compare the resulting performance with the legacy approach, it is first necessary to make valid assumptions on the perfor-mance of the V2X physical layer. These are divided into two groups:
• The performances of the physical channels for both
TABLE I
IEEE 802.11P VERSUSC-V2X, PHYLAYER MAIN TYPICAL PARAMETERS
IEEE 802.11p LTE-V2X Sampling Frequency, Fe(Fe) 10MHz 15.36MHz
Tone Spacing, ∆f 156.25kHz 15kHz FFT Size, NF F T 64 1024
Symbol Duration, Ts 8µs 66.67 µs
Number of data subcarriers, Nu 48 12×RB
Cyclic Prefix Size, Ncp 16 (1.6µs) 72 (4.7µs)
Modulation QPSK QPSK / 16QAM Forward Error Correction CC TC
Coding Rate, Rc ½ from MCS
Transmit power 23dBm 23dBm
(PER) as a function of the signal to noise ratio (SNR) for different radio configurations [5].
• The evaluation of the functionalities allowing the imple-mentation of the coexistence method and/or impacting the state machine of the ITS-G5 transceiver. This state machine defines the transmission (Tx) and reception (Rx) periods. Because V2X communication technologies are half duplex, time in Tx or Rx modes has a strong impact on system-level performance, in particular in a coexistence context.
The IEEE 802.11p physical layer uses Orthogonal Fre-quency Division Multiplexing (OFDM) combined with con-volutional code [1]. To provide performance under rapidly varying channels, the time domain parameters have been doubled, while the frequency domain parameters have been halved. A description of the IEEE 802.11p physical layer can be found in [1]. The LTE-V2X physical layer defined in [6] is based on Single Carrier Frequency Division Multiplexing Access (SC-FDMA) and supports 10 or 20 MHz channels. Each channel is divided into sub-frames, Resource Blocks (RBs) and sub-channels. The typical parameters are given in Table I for both technologies.
The results in this section are provided in terms of PER versus the SNR. Throughout the paper, we consider the 3GPP Extended Vehicular A Model EVA channel model as defined in [7]. Several configurations are considered for LTE-V2X as given in Table II. It should be noted that in this paper we consider perfect channel estimation for both technologies. Fig. 1 gives the physical layer performance for LTE-V2X and ITS-G5 for the considered configurations (Table II). The throughput ranges from 1.6 Mb/S to 4.8 Mb/S for LTE-V2X depending of the Transport block size and the Modulation Coding Scheme (MCS), and around 5.5 Mb/s for ITS-G5. We can then observe that the SNR for a P ER = 10−2varies from 2.8 to 8.1 dB for LTE-V2X and is equal to 10.6 for ITS-G5. That is mainly explained by the difference in data rate but also because channel coding for LTE-V2X is more complex and robust than for ITS-G5.
In a co-channel coexistence scenario, ITS-G5 stations may perceive the last LTE OFDM symbol as free and so transmit a message (only with a high level of priority like Decentralized Environmental Notification Message DENM or high priority DENM) with a possible collision if the next LTE subframe is occupied by at least one LTE user. This phenomenon can be mitigated by inserting of an ITS-G5 header [3], which indicates to the ITS-G5 radios that the LTE-V2X waveform
Fig. 1. ITS-G5 and LTE-V2X performance with the evolution of the PER as a function of the SNR through EVA channel.
is lasting 1ms. Therefore, if the IEEE 802.11p signaling field (included in the header) is correctly decoded, ITS-G5 stations would anticipate that the duration of the LTE signal is 1ms, and would therefore refrain from using the channel during that period, even if the last LTE symbol appears empty.
If the ITS-G5 device wants to transmit a message, the state machine of the ITS-G5 transceiver switches to ”Tx mode”, otherwise it remains in ”Rx mode”. The device can be locked in the ”Rx mode” for a period defined in the PHY header of the ITS-G5 when an ITS-G5 PHY Preamble is detected. This period should be set to 1 ms to avoid a message transmission involving a possible collision with LTE-V2X. The performance of preamble detection and header decoding are then required to complete the system level simulations.
ITS-G5 Header can be inserted in the last symbol of the previous LTE-V2X subframe by the device that sends a new packet in a given subframe. For the reservation of a fixed length time slot (for LTE-V2X e.g. 1 ms subframe) this ITS-G5 header can be “prerecorded” so that no additional computational effort is required. The ITS-G5 header signal can be delivered to the upconverter by the same digital to analog converter as the LTE signal. Figure 2 gives the performance with first the evolution of the detection probability of the preamble as a function of the SNR, together with the evolution of the false alarm (i.e. a detection when no preamble is transmitted). Figure 2 also gives the PER of the ITS-G5 header signaling for the 1 ms locking. Due to the header structure and its integrity check (1 parity bit and 6 bits for the tail biting [1]), a non-negligible header false alarm can also be observed. This false alarm is observed when, after decoding the header, we obtain a header signal that matches with the header structure (i.e. with the parity bit and the 6 bits set to 0 for the tail bits). These results have a significant impact on the efficiency of the considered coexistence method and are fed into the system-level simulation presented in the next section.
III. SYSTEM LEVEL SIMULATION
A. Simulation specifications
TR 36.885 proposes a methodology for evaluating perfor-mances regarding vehicular communications [8]. It involves simulating vehicles which are moving on urban area lanes (urban scenario) or freeway lanes (freeway scenario). In this article, only the urban scenario is considered.
A typical Manhattan-like urban area is considered for the urban scenario [8] (Road configuration for urban case). Nine
Fig. 2. ITS-G5 header and preamble detection performance on EVA channel.
buildings are arranged into a 3 by 3 matrix, with 4 lanes going through the roads between the buildings (a pair of lanes in one direction and another pair of lanes in the opposite direction). Though several options regarding vehicle speed and density are considered according to [8], we only consider here a vehicle speed equal to 60 km/h and a number of vehicles present in the area which is equal either to 800 vehicles or 1600 vehicles. As proposed in [8] we also assume that when a vehicle is crossing a road, it has a probability equal to 0.5 of going straightforward and an equal probability of 0.25 of turning left or right.
We assume that each vehicle sends periodical Context Awareness Messages (CAM) every 0.47 seconds. Each vehicle assumes its own initial time offset for sending CAM which is randomly set at simulation initialization. However the CAM size (in bytes) is not constant. The CAM size is drawn randomly for each new message, according the probabilities defined in table II. The mentioned duration also includes packet preamble and header.
Regarding PC5 mode 4, several strategies can be proposed for accommodating CAMs of different sizes into transport blocks. It is not recommendable to adapt the MCS as a function of the CAM size because we may obtain different performances for each CAM size. Instead, we propose to fix a single MCS and to derive the required number of Transmission Time Intervals (TTI) as a function of the CAM size. It is also assumed that we use 48 Resource Blocks (RBs) for each Transport Block (TB) (with 2RBs for signaling), so that we accommodate only one TB per TTI, given that we use a 10 MHz radio channel. Table II defines how many TTIs are required for each possible CAM size. In this paper, we have considered the use of MCS3 only.
TABLE II CAMSIZE ACCOMMODATION
Size (B) Prob. ITS-G5 (µs) MCS3 MCS4 MCS5 MCS6 200 0.29 312 1 1 1 1 300 0.22 440 1 1 1 1 400 0.17 576 2 1 1 1 500 0.2 712 2 2 1 1 600 0.11 840 2 2 2 1 700 0.01 976 3 2 2 2
We also need to clarify how to manage the Sensing-Based Semi-Persistent Scheduling (SB-SPS). Because we have regular CAM transmission every 0.47 seconds, we propose
to maintain a single SPS with an interval equal to 100 ms for each vehicle. A new SPS is re-established as soon as the former one is over (through the resource re-selection process) in order to maintain one transmission opportunity every 100 milliseconds on average. The re-selection process follows the so called Sensing Based Semi-Persistent Scheduling as standardized in 3GPP release 14 [5]. Of course, this scheme introduces some waste of reserved resources that can however not be avoided because of the variable size of CAM messages. If we have mostly large CAM (e.g. CAM of length 700 bytes), then most of the transmission opportunities will be exploited. However, short messages of length 200 or 300 bytes are typically dominant [5], then the rate of unexploited transmission opportunities may be significant.
This mechanism introduces latency as well, in particular for large CAMs. When a large CAM is received from the application layer for transmission over the air, we may have to wait for 3 transmission opportunities before completing its transmission, leading to 300 milliseconds of additional latency. As recommended in [8] we use the Winner B1 path loss model (see [9]) in order to evaluate path losses between vehicles. This model differentiates between Line Of Sight (LOS) conditions and Non Line Of Sight (NLOS). When a building is located between two vehicles, the propagation conditions turn to NLOS.
The simulation process mainly consists in tracking vehi-cles transmitting packets, and deciding about which receiving vehicles are able to receive such packets, by computing a Signal to Noise plus Interference ratio (SINR) at the receiver. The performances of Section II are used to decide about the decoding success, given the SINR.
For ITS-G5, the Carrier Sense Multiple Access with Colli-sion Avoidance (CSMA/CA) algorithm is added to decide if the packet can actually be sent on the channel. Only one packet for a CAM message is involved here. However the packet decoding requires 3 successive decision: Preamble detection, Header decoding, and finally CAM message decoding.
For PC5 mode 4, the CAM message decoding may involve several TTI transmissions, each of them carrying a Sidelink Control Information combined with a Transport Block (TB). For each SCI+TB, the simulator first checks that the SCI decoding is successful by computing the SINR and using the SCI performance curve of Section II. Then if it is successful, a second performance curve is used to decide whether the TB is successfully decoded. Finally, a CAM is successfully decoded if all the TBs used for this CAM have been successfully decoded.
The outcome of the simulation is typically made of a set of curves showing CAM Packet Delivery Ratio (PDR) versus maximum distance between CAM sending vehicles and CAM receiving vehicles. For a given distance used in the x-axis the value provided on the y-axis represents the PDR averaged over all potential receivers located at a distance not greater than the x-axis distance.
If a mix of technologies is simulated then separate curves are given for each technology, however each curve reflects the possible loss of performances due to the presence of foreign vehicles.
B. ns-3 based implementation
ns-3 has been used for all simulations and new ns-3 mod-ules have been developed to perform co-channel coexistence
simulations
• for managing the lane based mobility of urban scenario
• and for instantiating vehicles that follows either ITS-G5 or PC5 mode 4 technology in the context of an hybrid deployment
This last module exploits the C++ inheritance concept. A generic vehicle class contains all properties and functions of vehicles common to both technology. As an example, the computation of SINR with respect to a sending vehicle is part of the common functions. Then two classes inherit from this abstract class:
• A first class is used to instantiate ITS-G5 vehicles and it
adds specific variables and functions for ITS-G5
• A second class is used to instantiate PC5 mode 4 vehicles
and adds specific variables and function as well, for PC5 mode 4 (e.g. the ”reselection()” function).
C. Performance comparison in the absence of coexistence Figure 3 gives the performance derived out of 4 independent simulation configurations:
• 800 ITS-G5 vehicles (yellow curve).
• 1600 ITS-G5 vehicles (green curve), • 800 PC5 mode 4 vehicles (blue curve), • 1600 PC5 mode 4 vehicles (red curve).
Fig. 3. Performance comparison with no coexistence
If we compare the curve in yellow for 800 ITS-G5 vehicles, to the curve in blue for 800 PC5 mode 4 vehicles, we observe that ITS-G5 outperforms PC5 mode 4 up to a given distance of around 50 meters where the PDR is above 0.9. For higher distances, PC5 mode 4 outperforms ITS-G5. Now if we do the same comparison with 1600 vehicles instead of 800 we observe that ITS-G5 outperforms PC5 mode 4 up to an increased range of about 60 meters. We also observe higher resistance to traffic density on the ITS-G5 side.
These observations can be understood if we remind that we have selected a relatively robust MCS for PC5 mode 4 (MCS3). It provides good performances for long distances however it also reduces the number of resources for SB-SPS (only one resource per TTI) so that the collisions become an issue whatever the distance we have between sending vehicles and receiving vehicles.
If we refer to Table II we can infer that the average channel occupancy duration per CAM message is equal to 529 µs for ITS-G5 while it is equal to 1500 µs for PC5 mode 4 with
MCS3. The use of MCS3 provides good transmission range, however it generates many packet collisions.
D. Performance evaluation with co-channel coexistence Figure 4 shows the performances of ITS-G5 vehicles in a co-channel coexistence scenario. The yellow curve shows the performances for 800 ITS-G5 vehicles in the presence of 800 PC5 mode 4 vehicles. For comparison, we also give the performances for 1600 ITS-G5 vehicles and no PC5 mode 4 vehicle (in red) and the results with 800 ITS-G5 vehicles and no PC5 mode 4 vehicle (in blue). We observe a noticeable degradation of ITS-G5 performances due to the presence of PC5 mode 4 vehicles. This is the case, of course, if we consider as a reference performances of ITS-G5 only with 800 vehicles. But it is still the case if we consider performances of ITS-G5 only vehicles with 1600 vehicles. To illustrate the loss, we may consider a target PDR equal to 0.9. Then the reference distance for this target is equal to around 56 meters if we have 800 ITS-G5 vehicles, around 54 meters if we have 1600 ITS-G5 vehicles, and around 48 meters if we have 800 ITS-G5 vehicles and 800 PC5 mode 4 vehicles.
Fig. 4. ITS-G5 performance with coexistence
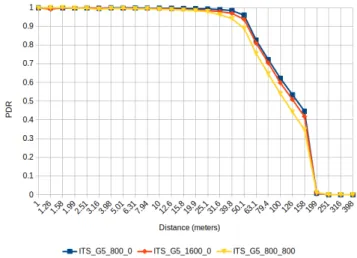
Figure 5 shows the performances of PC5 mode 4 vehicles for the same co-channel coexistence scenario.
The coexistence performances are shown in the yellow curve with 800 PC5 mode 4 vehicles and 800 ITS-G5 vehicles. We also give for reference the PC5 mode 4 only scenario performances with respectively 800 PC5 mode 4 vehicles (blue curve) and 1600 PC5 mode 4 vehicles (red curve).
Not surprisingly the best performances are obtained with 800 PC5 mode 4 vehicle alone. However if we compare the performances of 800 PC5 mode 4 vehicles in the presence of 800 ITS-G5 vehicles to the performances of 1600 PC5 mode 4 vehicles alone, we observe that the coexistence is beneficial in terms of performances. In other words it is better for a PC5 mode 4 vehicle to face interference issued from an ITS-G5 vehicle rather than interference issued from another PC5 mode 4 vehicle. This should not be a surprise if we remind that the average channel occupancy per CAM is much larger in case of PC5 mode 4 (1500 µs) as compared to ITS-G5 (529 µs). In such conditions, PC5 mode 4 interfering vehicles cause more harm than ITS-G5 interfering vehicles.
However Sensing Based Semi-Persistent Scheduling (SB-SPS) should introduce compensation, because it is meant to avoid collisions even in high channel occupancy conditions. It
has been observed that the SB-SPS algorithm has a relatively poor efficiency, mainly for the 2 following reasons:
• The variable size of CAM messages introduces over-reservation in SB-SPS,
• And the selection of a robust but not spectral-efficient MCS (MCS3) reduces the number of resource sets for SB-SPS re-selection process.
Fig. 5. PC5 mode 4 performance with coexistence
E. Performance evaluation in case of coexistence method Figure 6 shows system performances in the co-channel coexistence scenario when a coexisting method is applied, as described in sections I and II. All the curves assume a mix of vehicles with 800 PC5 mode 4 vehicles and 800 ITS-G5 vehicles:
• The blue curve shows PC5 mode 4 performances with coexistence and without coexisting method applied,
• The red curve shows ITS-G5 performances with coexis-tence and without coexisting method applied,
• The green curve shows PC5 mode 4 performances with
coexistence and with coexisting method applied,
• And the yellow curve shows ITS-G5 performances with coexistence and with coexisting method applied. On the ITS-G5 side, we observe that applying the coexis-tence method is beneficial, even though the improvement is not drastic.
On the PC5 mode 4 side, we observe a performance degradation due to applying the coexistence method. This can be explained due to the constraints in terms of resources selection. By constraining PC5 mode 4 to using only half of the TTIs (with the other half being reserved for ITS-G5) we divide by 2 the number of resources available for selection in the SB-SPS process. This turns into more packet collisions.
IV. CONCLUSION
We have investigated here the performance losses due to co-channel coexistence between LTE-V2X and ITS-G5 tech-nologies. This evaluation was never done before.
We have assessed the loss of ITS-G5 performances when ITS-G5 vehicles coexist with PC5 mode 4 vehicles, and we have confirmed and evaluated the possible benefit of coexistence mechanisms, in order to reduce this loss.
On the other hand we have observed PC5 mode 4 perfor-mance improvements, when PC5 mode 4 vehicles face ITS-G5
Fig. 6. PC5 mode 4 performance with a coexistence method applied
interference, rather than interference from other PC5 mode 4 vehicles.
Both observations are influenced by the choice of an MCS for PC5 mode 4. We have selected MCS3, which is a relatively robust modulation scheme that brings good performances in terms of achievable communication ranges. On the other hand, this modulation is not spectrally efficient such that it does not exploit the full benefits of Sensing Based Semi Persistent Scheduling.
Future work should consider more spectrally efficient MCS modes for PC5 mode 4, in order to update these conclusions.
REFERENCES
[1] “IEEE Standard for Information technology-Telecommunications and information exchange between systems. Local and metropolitan area networks-Specific requirements. Part 11: Wireless LAN Medium Access Control (MAC) and Physical Layer (PHY) Specifications,” LAN/MAN Standards Committee of the IEEE Computer Society, Dec. 2016. [2] Commission Decision, 5 August 2008, on the harmonised use of radio
spectrum in the 5 875-5 905 MHz frequency band for safety-related applications of Intelligent Transport Systems (2008/671/EC)
[3] European Telecommunications Standards Institute (ETSI), technical body: ERM TG37, work item: DTR/ERM-TG37-273, Document num-ber: TR 103 766 (early draft at paper writing date)
[4] P.Roux, S. Sesia, V. Mannoni, Eric Perraud, “System Level Analysis for ITS-G5 and LTE-V2X Performance Comparison”, 16th IEEE In-ternational Conference on Mobile Ad-Hoc and Smart System (MASS), 2019
[5] V. Mannoni, V. Berg, S. Sesia and E. Perraud, “A Comparison of the V2X Communication Systems: ITS-G5 and C-V2X,” in 2019 IEEE 89th Vehicular Technology Conference, Kuala Lumpur, Malaysia, April 2019. [6] “3rd Generation Partnership Project; Technical Specification Group Radio Access Network; Evolved Universal Terrestrial Radio Access (E-UTRA); Physical channels and modulation,” Release 15, 3GPP TS 36.211, v 15.2.0. June 2018.
[7] “User Equipment (UE) Radio Transmission and Reception.” 3rd Gener-ation Partnership Project; Technical SpecificGener-ation Group Radio Access Network; Evolved Universal Terrestrial Radio Access (E-UTRA),” 3GPP TS 36.101.
[8] TR 36.885 v14.0.0 Annex A; 3rd Generation Partnership Project; Technical Specification Group Radio Access Network; Study on LTE-based V2X Services;(Release 14) June 2016
[9] IST-4-027756 WINNER II, “WINNER II Channel Models” D1.1.2 v1.2, February 2008.