HAL Id: tel-00665526
https://tel.archives-ouvertes.fr/tel-00665526
Submitted on 2 Feb 2012
HAL is a multi-disciplinary open access
archive for the deposit and dissemination of sci-entific research documents, whether they are pub-lished or not. The documents may come from teaching and research institutions in France or abroad, or from public or private research centers.
L’archive ouverte pluridisciplinaire HAL, est destinée au dépôt et à la diffusion de documents scientifiques de niveau recherche, publiés ou non, émanant des établissements d’enseignement et de recherche français ou étrangers, des laboratoires publics ou privés.
Inference of a dictionnary of cortical folding
Zhongyi Sun
To cite this version:
Zhongyi Sun. Inference of a dictionnary of cortical folding. Other [cond-mat.other]. Université Paris Sud - Paris XI, 2011. English. �NNT : 2011PA112067�. �tel-00665526�
Zhongyi SUN
SUJET:
Inférence d’un dictionnaire des motifs des plissements
corticaux
Soutenance prévu 7 Juin 2011, devant les membres du jury :
Cachia Arnaud Rapporteur
Colliot Olivier Examinateur
Durand Emmanuel Examinateur
Malandain Grégoire Rapporteur
Mangin Jean-François Directeur de thèse
iii
Cette thèse vise à faire émerger de nouvelles descriptions de la variabilité des
plissements du cortex humain en s’appuyant sur des techniques de fouilles de données. L’objectif principal est la conception d’algorithmes permettant de découvrir des motifs de plissement spécifiques à une sous-population d’individus. Le but final est de réaliser un dictionnaire de ces motifs et de les associer à des particularités cognitives ou architecturales, voire à des pathologies. Deux stratégies de « clustering » sont proposées pour mettre en évidence de tels motifs. La première repose sur des
descripteurs de formes globaux correspondant aux invariants de moment 3D, la seconde repose sur l’estimation d’une matrice de distances entre chaque paire d’individus. Un algorithme de clustering dédié est conçu pour détecter les motifs les plus fréquents de manière robuste. Une technique de réduction de dimension est utilisée pour mettre en évidence les transitions entre motifs au sein de la population. Les méthodes
algorithmiques proposées sont utilisées pour étudier la forme du cortex sensori-moteur d’une population de gauchers contrariés. Des résultats originaux sur le lien entre la forme du sillon central et la latéralité manuelle sont mis en évidence. Les méthodes développées sont ensuite utilisées pour construire le premier dictionnaire des motifs observés dans les plissements corticaux issu d’une approche algorithmique.
iv
Abstract
This thesis aims at proposing new descriptions of the variability of the folding of the human cortex using data mining. The main objective is the design of algorithms detecting folding patterns specific to a sub-population. The long term goal is the constitution of an exhaustive dictionary of all the folding patterns enriched with links to cognitive or architectural specificities, or to pathologies. Two clustering strategies are proposed to detect such patterns. The first one is based on global shape descriptors called the 3D moment invariants, the second one implies the computation of a pairwise distance matrix. A dedicated clustering algorithm is designed for robust detection of the most frequent patterns. A dimension reduction strategy is proposed to study the transition from one pattern to another across the population. The proposed framework is applied to the study of the shape of the sensori-motor cortex of a population of left-handers forced to write with the right hand. Original discoveries relating the shape of the central sulcus to handedness are achieved. The framework is finally used to build the first computerized dictionary of the cortical folding patterns.
v
Chapter One: Cortical Folding and Cortical Morphology ...1
1.1 SUMMARY ...1
1.2 INTRODUCTION ...1
1.3 THE STUDY OF CORTICAL FOLDING PATTERNS ...3
1.3.1 Gyri and Sulci ...5
1.3.2 Development of the cerebral cortex and gyrogenesis ...6
1.3.3 Relation of architectonic and function to gyrus...10
1.3.4 Cortical Connections...11
1.3.5 Pathological gyral and sulcal patterns ...12
1.3.6 Comparative and developmental studies ...14
1.3.7 Explanation of gyrification and fissuration ...15
1.4 COMPUTATIONAL MORPHOMETRY OF CORTICAL FOLDING ...17
1.4.1 Cortical morphology and the modeling of cortical folding ...18
1.4.2 Approaches in the study of cortical folding...20
1.4.3 Applications of cortical morphology ...22
1.4.4 Organizational framework of cortical folding and future work...25
1.5 DISCUSSION ...28
Chapter Two: Clusters of folds ...29
2.1 SUMMARY ...29
2.2 INTRODUCTION TO THE ANALYSIS OF CORTICAL FOLDING...29
2.2.1 Clustering algorithms...31
2.2.2 Clustering analysis on cortical folding ...35
2.3 THE SHAPE DESCRIPTOR...36
2.3.1 The initial effort ...37
2.3.2 3D Moment invariants as sulcal shape descriptors ...40
2.4 THE CLUSTERING ALGORITHM FOR SULCAL PATTERN DISCOVERY...45
2.4.1 Agglomerative hierarchical clustering...45
2.4.2 Merging of clusters: tight-head join...47
2.4.3 The stopping rule based on competition ...50
2.4.4 Bagging and final clusters...52
2.4.5 The PCBB algorithm ...54
2.5 VALIDATION OF THE ALGORITHM...57
2.5.1 Simulated datasets...57
vi
2.6.1 The cingulate sulcus...63
2.6.2 The inferior precentral sulcus ...65
2.6.3 The calcarine, collateral and central sulcus ...66
2.7 DISCUSSION ...67
Chapter Three: Patterns of folds ...69
3.1 SUMMARY ...69
3.2 INTRODUCTION ...69
3.3 SEARCHING FOR A FRAMEWORK OF PATTERNS...71
3.3.1 The Similarity measure: ICP...71
3.3.2 Algorithm to handle high dimensional data: Isomap...73
3.4 VALIDATION OF THE ICP-ISOMAP APPROACH...75
3.4.1 The suitability of ICP-Isomap for cortical pattern analysis: real dataset...76
3.4.2 The suitability of ICP-Isomap for cortical pattern analysis: simulated dataset ....77
3.5 HOW TO LOOK: THE CLUSTERS OF SULCI ...80
3.6 WHERE TO LOOK: THE SELECTION OF FOLDS ...80
3.7 RESULTS ...81
3.7.1 The Cingulate region ...81
3.7.2 The Central Sulcus...83
3.7.3 The inferior frontal region ...83
3.8 DISCUSSIONS...84
Chapter Four: Handedness in the folds...87
4.1 SUMMARY ...87
4.2 INTRODUCTION ...88
4.3 MATERIAL AND METHODS ...94
4.3.1 Datasets ...94
4.3.2 Sulcal similarity measure...96
4.3.3 Dimension reduction with Isomap ...97
4.3.4 Visualization of the forms using weighted SPAM ...97
4.4 RESULTS ...98
4.4.1 Distance matrix composition ...98
4.4.2 Outlier selection ...99
4.4.3 The choice of K...100
4.4.4 Results in terms of the position of the hand knob...100
vii
4.5 DISCUSSION ...112
4.5.1 Insights in Neuroscience ...112
4.5.2 Insights on approaches and methods ...118
4.5.3 Future work...120
Chapter Five: Sample Dictionary of Folds ...123
5.1 SUMMARY ...123
5.2 DICTIONARY OF PATTERNS ...123
5.3 ANALYSIS AND CLUSTERING METHODS...123
5.4 THE REGION OF THE CENTRAL SULCUS ...125
5.5 THE REGION OF THE CINGULATE SULCUS...137
5.6 THE REGION OF THE SUPERIOR TEMPORAL SULCUS...146
5.7 THE BROCA’S AREA...152
5.8 THE PREFRONTAL REGION ...155
5.8.1 The smaller superior frontal region ...155
5.8.2 The larger superior frontal region ...157
5.9 THE COMBINATIONS: CS AND CINGULATE...160
Chapter Six: Discussion on Folding Analysis ...163
6.1 SUMMARY ...163
6.2 INTRODUCTION ...163
6.3 THE IMPLICATIONS OF SULCAL ANALYSIS ...164
6.3.1 Sulcal analysis and brain development ...164
6.3.2 Algorithmic development and knowledge discovery ...166
6.4 THE MAIN FACTORS IN THE ANALYSIS OF CORTICAL FOLDING...166
6.4.1 Folding groups and region of interest ...166
6.4.2 Shape descriptor and Similarity definition ...168
6.4.3 Clustering algorithms and approaches ...170
6.4.4 ICP ...176
6.4.5 Datasets ...176
6.5 FUTURE DIRECTIONS ...177
6.6 CONCLUSION...181
viii
A Résumé : Trouver des motifs dans les plissements corticaux ……….…...193 B Etat des Publications ...………...229
ix
Fig 1.1. The variability of cortical folding... 2
Fig 1.2: The brain of different species ... 4
Fig 1.3 Gyri and Sulci, an example of the text book presentation of nomenclature... 6
Fig 1.4 Development of the human brain ... 7
Fig 1.5Critical periods of human development... 9
Fig 1.6Prenatal development of neurons in the prefrontal cortex... 10
Fig 1.7 Map of the cerebral cortex in man... 11
Fig 1.8Callosal agenesis... 13
Fig 1.9 The sulcal roots... 26
Fig 1.10 The sulcal pits ... 27
Fig 2.1 The variability in brain folding patterns ... 29
Fig 2.2 Compact and Chained clusters ... 33
Fig 2.3 Different types of clustering methods ... 34
Fig 2.4 Cluster data using partitional algorithm ... 34
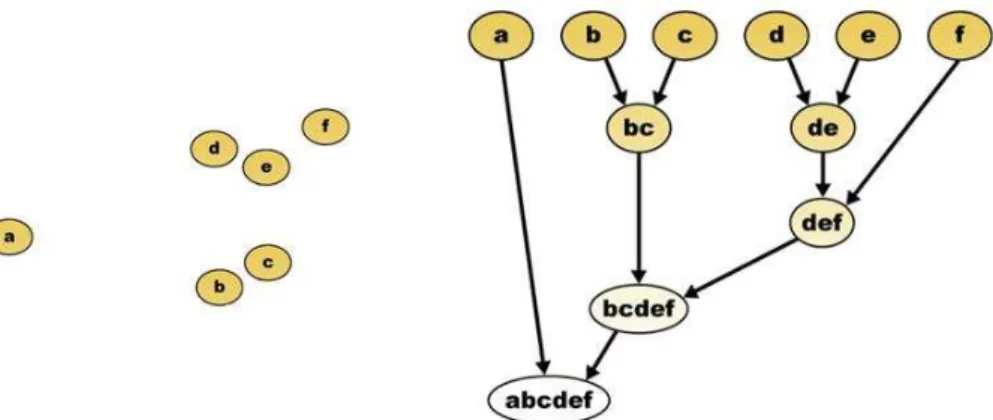
Fig 2.5 Sample data distribution and the formation of agglomerative clustering tree... 35
Fig 2.6 The Central Sulcus (red) and the Sylvian fissure (blue), highlighted on brain surfaces ... 37
Fig 2.7 The variation of moment invariants corresponding to the change in 3D shape ... 42
Fig 2.8. Variation of moment invariants corresponding to the change in the 3D shape of the objects ... 42
Fig 2.9. The variation of the moment invariants corresponding to the fine change in the 3D shape of the objects ... 43
Fig 2.10 The distribution of different sulci ... 43
Fig. 2.11 The distribution of different sulci, with the sample shapes ... 45
Figure 2.12 Typical clustering result of complete-linkage and average-linkage... 46
x
Fig 2.15. Sample distribution A and B ... 50
Fig 2.16 Resulting clusters on bootstrap samples ... 53
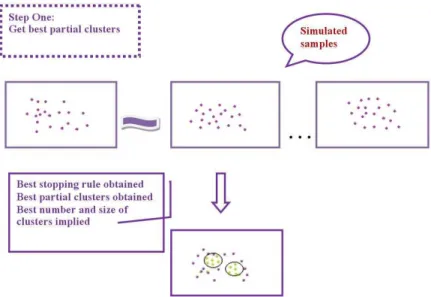
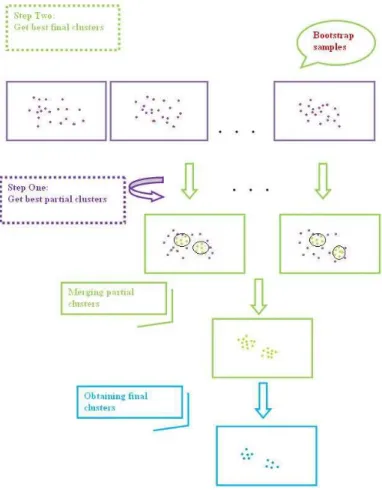
Fig 2.17A Obtaining the best partial clusters... 55
Fig 2.17B Obtaining the best final clusters... 56
Fig 2.18 The comparison of performances ... 59
Fig 2.19 The clusters of the cingulate sulcus ... 60
Fig 2.20 The clusters found on three different datasets ... 61
Fig 2.21 The three patterns detected for the left cingulate sulcus ... 64
Fig 2.22 The patterns of the inferior precentral sulcus ... 65
Fig 2.23 The patterns of the calcarine, collateral and central sulcus ... 66
Fig 3.1: An example of the similarity measure... 72
Fig 3.2 The comparison of dimension reduction methods... 76
Fig 3.3 The simulated central sulcus... 78
Fig 3.4 The comparison of dimension reduction methods on final clusters ... 78
Fig 3.5 Comparison of algorithms: effect on the estimation of the number of clusters ... 79
Fig 3.6 Comparison of algorithms: clusters found... 80
Fig 3.7 The clusters found on the Cingulate region... 82
Fig 3.8 The inferior frontal region ... 84
Fig 4.1aThe functional organization of the central region... 91
Fig 4.1b The structure model of the central sulcus ... 92
Fig 4.2A negative cast of the central sulcus of three subjects ... 93
Fig 4.3 Data distribution before and after outlier removal and correction ... 99
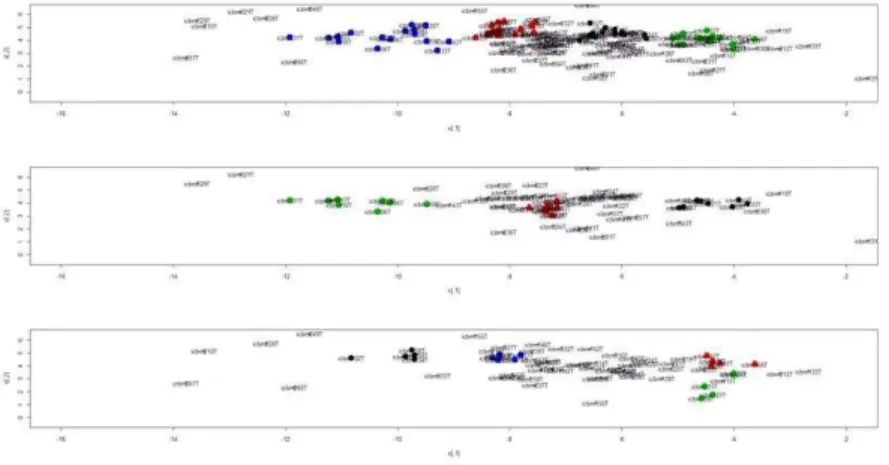
Fig 4.4Thecentral sulci aligned along the Isomap axis... 101
xi
Fig 4.7Population localization along the Isomap axis ... 104
Fig 4.8Population localization along the Isomap axis for dataset One and Two combined... 105
Fig 4.9The 2D weighted SPAM... 106
Fig 4.10The analysis of form of the central sulcus of the three groups on the two hemispheres... 107
Figure 4.11 Neighbourhood size and p-value ... 110
Fig 4.12 Examples of central sulcus interruptions... 117
Fig 5.1 The nomenclature of the sulci ... 125
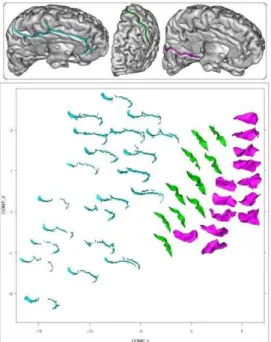
Fig 5.2 The Isomap of the central sulcus ... 127
Fig 5.3 The clusters of the central sulcus... 128
Fig 5.4 The SPAM of the whole dataset ... 130
Fig 5.5 The comparison of the two hemispheres of the central sulcus ... 130
Fig 5.6 The SPAM and fold distribution of the precentral gyrus ... 131
Fig 5.7 The SPAM of the precentral region with the corresponding sulcal forms ... 132
Fig 5.8 The clusters of the precentral gyrus... 133
Fig 5.9 Global form of the precentral gyrus ... 134
Fig 5.10 The two hemispheres of the precentral gyrus ... 135
Fig 5.11 The variability model of the precentral region ... 136
Fig 5.12 The cingulate sulcus and the surrounding functional organizations... 138
Fig 5.13 The Isomap of the cingulate region ... 139
Fig 5.14 The SPAM of the cingulate region with the corresponding sulcal forms ... 141
Fig 5.15 The clusters of the cingulate region... 141
Fig 5.16 The variability model for the cingulate region ... 142
xii
Fig 5.19 Clusters found on the left hemisphere ... 145
Fig 5.20 The sulcal roots and “plis de passage” of the STS complex ... 146
Fig 5.21 The isomap of the superior temporal sulcus... 148
Fig 5.22 The clusters of the superior temporal sulcus ... 149
Fig 5.23 The left and right hemisphere of the superior temporal sulcus ... 150
Fig 5.24 The variability model of the superior temporal sulcus ... 151
Fig 5.25 The definition of the sulci of the Broca’s area ... 152
Fig 5.26 The analysis of the sulci around the region of Broca’s area... 153
Fig 5.27 The clusters of the sulci of the Broca’s area... 154
Fig 5.28 The definition of the smaller and larger superior frontal region ... 155
Fig 5.29 The analysis of the sulci around the region of the superior frontal area ... 156
Fig 5.30 The clusters of the superior frontal area ... 157
Fig 5.31 The analysis of the bigger superior fontal region ... 158
Fig 5.32 Variability models for the superior frontal region... 159
Fig 5.33 The combination of central sulcus and the cingulate region ... 160
Fig 5.34 The Isomap analysis of the combination of the central sulcus and the cingulate region... 161
Fig 5.35 The clustering and asymmetry analysis of the combination of the central sulcus and the cingulate region ... 162
Fig 5.36 The variability model of the central sulcus with the cingulate region... 162
Fig 6.1 The diagram of the interaction among domains ... 163
Fig 6.2 The analysis of the central sulcus of a dataset containing 972 adult sulci ... 178
Fig 6.3 The isomap of the central sulcus of a dataset of infants... 178
Fig 6.4 Functional activation SPAM superimposed on central sulcus SPAM along the Isomap axis of the central sulcus ... 180
xv
A perfection of means, and confusion of aims, seems to be our main problem.
Chapter One:Cortical Folding and Cortical Morphology
1.1Summary
The primary goal of the thesis work is applying computational methods to analyze the cortical folding patterns. In this chapter, a general overview is given to the fundamental subjects of concern: the phenomenon of cortical folding and the computational
morphometry of cortical folding. The computational morphometry provides the general framework where the thesis work fits in. Within this framework, the cortical folding patterns are studied applying computational methods using magnetic resonance imaging data.
The rest of the thesis is organized as follows: Chapter One gives an introduction to the subjects the most relevant to this work; Chapter Two introduces the approach of using clustering algorithms on selected morphometrical features of cortical folding; Chapter Three further explores various approaches of finding comprehensive information in cortical folding; Chapter Four applies the methods developed to a real dataset,
illustrating the exciting potentials of such analysis; Chapter Five presents the summary of the detailed dictionary of cortical folding patterns and Chapter Six concludes the thesis work.
1.2Introduction
As of all the work combining different fields, in this case, neuroscience and computer science, it is of pivotal importance to gain sufficient understanding of the fields involved. The questions asked need to be well understood before the right solutions can be found. Consequently, this thesis work begins by understanding the neuroscience issues behind. The computational methods then need to be selected or designed to answer these specific neuroscience questions. In this work, the journey starts with the cortical folding process.
The cortex of the brain folds during development. The folding process, mysterious and fascinating, is not yet well understood. Does the cortical folding contain some
information on the functional organization of the human brain? From the folds alone can we observe a pattern characteristic of a certain neurological disease? There exists a wealth of knowledge on the subject. Thanks to recent advances in software dedicated to automatic recognition of cortical sulci (Fillard et al., 2007; Le Goualher et al., 1999; Lohmann and von Cramon, 2000; Riviere et al., 2002; Welker, 1988) issues regarding cortical folding can now be tackled using large brain databases (Mangin et al., 2004b).
Each brain looks different and none of them looks exactly like the ones in the text books. Refer to Fig 1.1, examples of individual folding patterns are shown. It can be observed that huge amount of folding variability exists.
Fig 1.1.Thevariability of cortical folding
Right hemispheres of three individuals, the cortical folds of the frontal lobe are highlighted according to the traditional nomenclature.
Current studies of this variability focus mainly on simple morphometric features, such as the length or the depth of the standard sulci or gyri. Unfortunately, the standard naming system cannot always account for the folding pattern variability. Hence some of the standard sulci can be difficult to define or to measure. This weakness of the nomenclature imposes difficulties on both morphometric studies and the pattern recognition software dedicated to automatic recognition of the sulci.
The most detailed description of the sulcus variability has been proposed in the atlas of Ono (Ono et al., 1990). This atlas is not based on one single individual but on twenty
different brains. For each sulcus, the authors propose a list of possible patterns and their frequencies. These patterns are defined for instance from the variability of the sulcus interruptions. In a way, the initial goal of the thesis work is to automate the work
performed by Ono. We want to discover folding patterns that can be observed for a subset of the population. Furthermore, we want to find links between folding patterns and
function.
An overview of the study of brain cortical folding patterns is discussed in the next section. The field of computational cortical morphometry is discussed further in section 1.4, the focus is on the analysis of cortical folding. Note that it is impossible to cover in every detail these two vast domains; let alone many related subjects not directly
concerned in the thesis work. The goal of this chapter is to give enough background knowledge to pave the way for the chapters that follow.
1.3The study of cortical folding patterns
Different conceptual approaches are undertaken to map the brain: the functional (initiated by Broca, followed by Jackson), the cytoarchitectural (initiated by Baillarger, followed by Ramon y Cajal and later Brodman) and the study of sulci and gyri. In this work, the third approach, the study of sulci and gyri, is taken.
It is fascinating to look at the brain folding patterns. As stated by Welker: “the most striking, interesting, yet poorly understood gross morphological features of the cerebral hemispheres in mammals are the diverse and complex arrangements of their cortical gyri and sulci” (Welker, 1988).
Indeed, while the nuclei in the spinal cord and the brain stem of the mammals are quite similar, the cerebrum and cerebellum exhibit great variation in size, shape and
has been linked to intelligence. It is believed that those with bigger and more convoluted brains possess more behavioral complexity and higher intelligence. Comparative studies revealed that cortical thickness and columnar architecture differ relatively little in
different mammals. The huge difference lies in cortical surface area. Compared to
macaque monkeys, the surface area of the human brain is approximately 10 times greater, whereas the thickness of the human cortex is only twofold greater (Barondes et al., 1997). The larger brains have more gyri and sulci, the variability of the three-dimensional convolutional patterns increases as well (Jerison, 1973), see Fig 1.2 for examples.
Fig 1.2: The brain of different species
It is believed that during evolution, a greater number and diversity of brain functions were achieved by increasing the surface area of cerebral neocortex. The increase in surface area is achieved by mechanical buckling, infolding, and fissuring. The folding of the cortex might provide more functional modules (Jerison, 1973).
Historically, the importance of folding patterns of the cortex was questioned: “similar to the loops of small intestines that seemed to lie in no particular order” (Edwin Clarke, 1973). In the early 1800s attention was drawn to the possibility of localizing specific mental faculties to specific gyri by Gall and his followers (Clarke, 1968). Phrenology is history now, but this initiative leads to many descriptive studies of the cerebral
advances were made in experimental methods and technology, this interest in localizing specific functions to specific convolutions diminished. More studies focused on the microscopic structure and architecture of the cerebral cortex. However, there starts to be more structural, connectional, and functional studies that reveal correlates of gyri and sulci to brain function (Watson et al., 1993; Welker, 1988). These evidences suggest that brain morphology of the folding patterns might be linked to brain connection and
function. It is thus interesting to explore further the folding patterns with more modern and automated computational methods, and try to link these patterns to functions or behaviors.
1.3.1 Gyri and Sulci
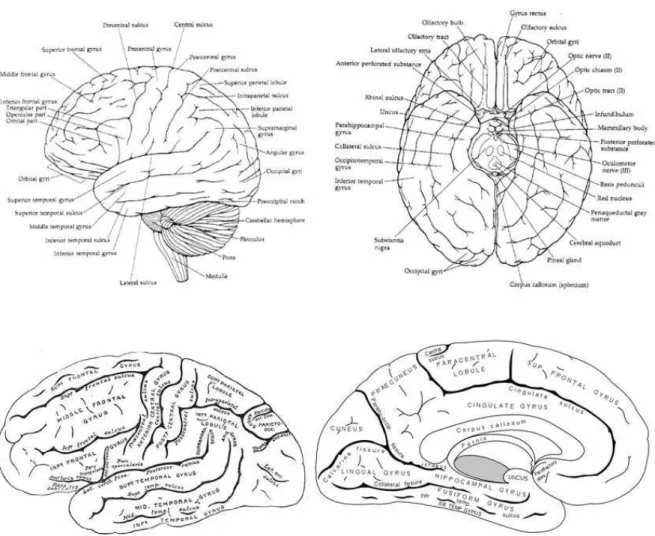
The folding patterns are already very varied when observed from the brain surface. When the cortex is viewed by dissection or serial sections, the gyri and sulci appear to be much more complex (Welker, 1988). Traditionally, a nomenclature system is set up to describe the convolution of the surface of the human brain (Anatomica, 1983; Clemente, 1985; Ono et al., 1990), refer to Fig 1.3 for an example. Due to the enormous variability that exists in folding patterns, achieving a unified conception for the description of these sulci and gyri is extremely difficult. One interesting example of such attempt for a systematic understanding of the sulci and gyri is the sulcal root model (Regis et al., 2005). Indeed, a unified scheme cross different species can be confirmed only when the neurological data concerning developmental, architectural, connectional, physiological and chemical features are available.
Fig 1.3 Gyri and Sulci, an example of the text book presentation of nomenclature.
Gray's Anatomy: The Anatomical Basis of Medicine and Surgery (British Edition. 38th Ed)
1.3.2 Development of the cerebral cortex and gyrogenesis
Human cerebral cortex development may be divided into three, partly overlapping periods (Marin-Padilla, 1990): embryonic period; intermediate, fetal or migration period and the perinatal period. The perinatal period starts about the 24th week of gestation.
Disorders of neuronal migration are likely to occur in the fetal period so defined. On the other hand, abnormalities of the structural organization of the cerebral cortex are
common in the perinatal period. At about 22 weeks of gestation, the first thalamocortical synapses are formed within the cortical plate, cortical interneurons and dendrites of layers III and V pyramidal neurons are developing simultaneously. In the period of 22–26 weeks of gestation, dense granularity is observed in the position of the future layer VI. The six-layered adult laminar pattern gradually appears after 28 weeks of gestation. At 1-2 years after birth, major outgrowth of dendrites occurs, both for pyramidal and for nonpyramidal neurons. Mature dendritic extension has been reached at 2–4 years of age. Finally, the mature level of outgrowth is reached at about 3–4 years (Uylings, 2001). Certain cortical areas such as the frontal and parietal cortices keep increasing until the age of 12–13 years (Hori, 2006).
In humans, gyrogenesis usually starts during fetal development. In ferrets, this process starts shortly after birth (Neal et al., 2007). While the gyral tissue continues to expand, some areas (the sulcal roots) remain in a relatively stable position (Regis et al., 2005). Gyrification in humans reaches adult values around age of 10 years (Armstrong et al., 1995). The primary effect of the folding process is an increase of surface area relative to volume, which correlates with an increased number of neurons (Panizzon et al., 2009). This increase is presumed to enhance the computational capacities of the cortex with some metabolic and connectivity limits (Wen and Chklovskii, 2008).
Fig 1.4 Development of the human brain
Lateral and medial views of the developing human brain in the fourth (a), sixth (b) and eighth (c)
Gyrogenesis is composed of an intriguingly complex series of events. Without going into the details of each, the processes hypothesized during gyrogenesis include: neuronal differentiation and dendrogenesis, neuronal orientation, afferent arrival, penetration, fasciculation, and arborization, synaptogenesis, glial proliferation and ensheathment, laminar aggreration and segregation, rearrangement of cell adhesion molecules and related membrane structures, and the differential development of gyri and lobules. From the perspective of external morphology, differential development of different gyri and lobules affects their relative width, height, shape, orientation, and spatial pattern. The gyral crowns, sulcal walls, and fundi are constructed differently and according to different developmental timetables (Welker, 1988).
The cortical folding is a sequential process. Refer to Fig 1.4 for the external morphology
of the cortical folds during development. The Sylvian fissure and insula can be
recognized at the 14th gestational week as a shallow indentation on the lateral surface of the cerebrum. Cerebral sulcus formation begins around the 16th gestational week with the appearance of the parieto-occipital and cingulate sulci. Central sulcus formation is seen in the 20th to the 21st week (Armstrong et al., 1995; Feess-Higgins and Larroche, 1987).
The classification of sulci into primary, secondary and tertiary sulci has been adopted. Definitions are proposed but the precise classification remains controversial. The definition based on comparative anatomy defines the primary sulci as those that can be found in all gyrencephalic primates. The ontogenetic approach defines the primary sulci as those generally appearing before 30th week of gestation (Feess-Higgins and Larroche, 1987). The secondary and tertiary sulci are those that give the cortex the adult appearance (Tamraz and Comair, 2006). The definition concerning the orientation of the sulci is as follows: primary sulci are oriented perpendicular to the neuraxis, whereas secondary sulcus formation is parallel to the neuraxis, the tertiary sulci bind the primary and secondary sulci (Hori, 2006).
Normal gyration and sulcal pattern has been studied prenatally and in preterm and term neonates with MRI. Brain maturation was found to start in the central area and to proceed
towards the parietooccipital cortex (Ruoss et al., 2001). The frontal cortex develops last. As more knowledge concerning early brain development becomes available, the
classification of sulci could be converged.
It should be kept in mind that gyrogenesis is not an isolated process. The central nervous system as a whole is developing as well, together with the development of other tissues
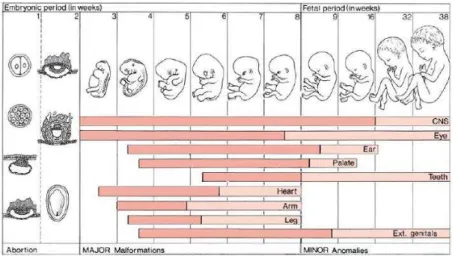
and organs such as the eye, the heart, the teeth etc. Fig 1.5 gives a timing of these events.
More specific to the cortex, while the gyri and the sulci are forming, the six-layered adult
laminar pattern is forming simultaneously (refer to Fig 1.6 as an example). While it is
interesting to observe the cortical folding process, it is important to put cortical folding into the context of the human development as a whole.
Fig 1.5Critical periods of human development
Critical periods in human development. In the horizontal columns, the period of major complications is shown in red, that of minor anomalies in light red. (Hori, 2006)
Fig 1.6Prenatal development of neurons in the prefrontal cortex
Golgi-stained sections at 10.5(a), 13.5(b), 17(c), 19-25(d), 26-29(e) and 32-34(f) weeks of gestation and a neonate(g). CP: cortical plate, FI-VI: fetal cortical layers, IZ: intermediate zone, MZ: marginal zone, SP: subplate, VZ: ventricular zone, WM: white matter. (Hori, 2006)
1.3.3 Relation of architectonic and function to gyrus
The parcellation of neocortex into structurally different cytoarchitectonic areas has a long history; the criteria used to differentiate the areas differ from one author to another. It is generally accepted that architectonic distinctions alone do not provide an adequate or accurate view of areal differences in cortical organization (Welker, 1988).
Different architectonic fields often occupy different, but adjacent, gyri. When the border of the transitional zones lies at the fundus of the interposed sulcus, such sulci have been called limiting sulci. Examples of limiting sulci are the central, cingulate and sylvian sulci. However, many sulci lie within a single architectonic field, within-field sulci are called axial sulci. Examples are the superior and inferior precentral sulci and the
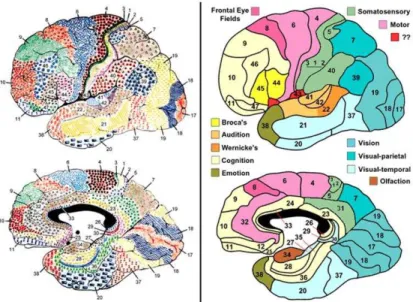
calcarine sulcus. In some cases a single gyrus contains two or more architectonic fields; an example is the postcentral gyrus of primates. Refer to Fig 1.7 for the Brodman’s areas relative to the gyrus and sulcus.
One of the most striking evidence for a precise correlation of functional areas with gyral and sulcal features came from mapping studies of somatosensory cerebral cortex in
raccoons (Welker, 1988). The functional areas of the forepaw correlate well to the cortical areas separated by the folding. The crown cortex has larger or more densely activated neuronal populations, compared to gyral walls and fundi. Additional studies of the raccoon found that not only the ventrobasal thalamus, but also the dorsal column nuclei, were subdivided into as many subnuclei as there were gyral crowns in somatosensory cortex (Welker, 1988).
Fig 1.7 Map of the cerebral cortex in man (Brodmann, 1909).
1.3.4 Cortical Connections
To have a better understanding of cortical folding, the underlying fiber connections cannot be overlooked. Large and well-organized thalamic nuclei send projections to, and receive reciprocal connections from, different specific cortical gyri or gyral groups. Limiting sulci which lie at the borders or cortical areas receive projections from different thalamic nuclei or nulear complexes. There are also cases where adjacent gyri separated by axial sulci within a single cortical field are interconnected with different but adjacent thalamic subnuclei. A well-studied example of this is found in the connections of the
subnuclei of the raccoon’s ventrobasal complex with the several cortical subgyri within somatosensorry cortex (Welker, 1988).
Other than cortical-thalamic connections, numerous cortical-cortical connections exist. In human, the superior and inferior longitudinal fascicule, the uncinate fasciculus, and the cingulum are some of the largest fiber bundles which interconnect major lobes of the cerebral hemisphere (Clemente, 1985). The intergyral “U” fiber connections are also demonstrated (Krieg, 1966). It is shown that adjacent gyral crowns are richly
interconnected, whereas fundic cortex is sparsely interconnected. Regarding
interhemispheric connections, experiments reveal that most topographically homologous gyri of the two hemispheres have reciprocal connections that are symmetric. Many gyral crowns project to gyral crowns, and sulcal walls to sulcal walls (Welker, 1988).
However, some cortical gyri send projections primarily to the walls and fundi of certain sulci in the opposite hemisphere. It is interesting to notice that in several mammals, gyri that contain specialized sensory or motor representations are devoid of reciprocal
interhemispheric connections. The examples include the somatosensory hand cortex, the visual foveal cortex and the primary auditory cortex in some mammals. Local circuits exist between different parts of a single cytoarchitectonic field located on one gyrus, as well as between different adjacent subfields on the same gyrus (Welker, 1988).
Finally, it should be kept in mind that many gyral regions send descending projections not only to specific thalamic nuclei, but also to specific basal ganglia, brain-stem, cerebellar, medullary and spinal cord nuclei.
1.3.5 Pathological gyral and sulcal patterns
Abnormal gyral and sulcal patterns have been observed. There are terms describing the anomalies of cortical development in humans and animals, which include: agyria (lacking gyri), pachygyria (broad gyri with thin cortex), ulegyria (narrow, distorted, and scarred
gyri), microgyria (abnormally narrow gyri), polymicrogyria (supernumerary tiny gyri), polygyria (an unusually large number of gyral formations), schizogyria (gyri with disrupted continuity), ectopic gyri (gyri that occur in unusual places), and cortical warts (small innervated cellular protrusions of cortex) (Welker, 1988).
Abnormalities of cortical development produce alternations in form and pattern of gyri and sulci, many of these are also associated with sensory, motor, cognitive, and
motivational disorders. The interactions during development are complex. The difficulty in deciphering the folding mechanism based on abnormalities is that these abnormalities usually affect many levels of development, and little is known of the time and nature of the cause (Welker, 1988).
One interesting example illustrating the link between the underlying connections and the sulcal pattern is the case of brains without corpus callosum (callosal agenesis). In these cases, the bundles of Probst become longitudinal instead of crossing the hemispheres as corpus callosum. Typically, the cingulate region shows more radial arrangement. Refer to
Fig 1.8 for the abnormal bundles and abnormal sulcal pattern. The other example is the
Williams syndrome, a rare disorder characterized by dissociation between language, face processing and spatial cognition. Overly social behavior is observed that is opposite to that seen in autism (Bellugi et al., 1999). It is found that the central sulcus of the patients are shorter and does not become opercularized in the interhemispheric fissure (Galaburda et al., 2001). The central sulci are also observed to be separated by unusual gyral
convolutions (Hori, 2006).
Left: Development of the bundles of Probst. The commissural fibres of the corpus callosum in a normal brain (a) are shown by broken lines; the abnormal longitudinal bundles of Probst (b) which fail to cross are shown in solid lines. (Hori, 2006) Right: Photographs show a fetal case of callosal agenesis: a medial view of the brain; note radial arrangement of gyri; b coronal section of the brain
The examples above implies that even though folding abnormalities are most likely consequences of multiple functional abnormalities, it nevertheless links altered form to altered function in the cortex, and can shed some light on the underlying developmental mechanism.
1.3.6 Comparative and developmental studies
Comparative studies among different species provide many interesting insights into brain evolution and development. For example, it is observed that the size of the localized areas of the cortex is different among mammals. Relatively large cortical somatosensory hand area is observed in raccoons, larger rhinarial areas in pigs, larger lip area in llamas, and larger tail area in spider monkeys (Welker, 1988).
More specific to gyrogenesis, historical comparative studies reveal that gyrification is not associated with brain size or body size across species. Smaller brains can be more
convoluted than bigger ones. An example is the least weasel, the smallest living carnivore, which has a highly convoluted brain smaller than that of a smooth-brained rodent (Jerison, 1973). Another well documented fact is that the cortical thickness of cerebral cortex varies relatively little (1-4mm) among brains of different mammals over a wide range of brain and body sizes, from mouse to elephant (Braitenberg, 2001).
More recent studies confirm that as the brain size increases, the cortical thickness
increases only slightly, while the degree of sulcal convolutions increases dramatically (Im et al., 2008). Furthermore, the relation of gyrification to brain size might follow region-specific patterns within species. Toro et al (Toro et al., 2008) found that as the brain size
increases in humans, the cortical folding is increased more specific to the prefrontal cortex. The major implications are: the processing operations of cerebral cortex are probably the same everywhere; increasing the number of processing modules is mainly by the increase in cortical surface area.
It is interesting to note that shapes and orientations of most gyri differ in predictable ways in different species, as well as in different cortical regions in any one species.
Convolutions and sulci do not appear randomly in different mammalian groups, but tend to occur in taxon-specific patterns. Within each group, there are greater similarities, despite wide variations in brain size and gyral and sulcal complexity. The study of the somatosensory cortex in raccoons by Welker (Welker, 1988) reveals that minor interanimal differences were associated with variations in the deployment of specific peripheral somatosensory projections to cerebral cortex.
The development of sulcal and gyral patterns is strongly influenced by genetic processes (Piao et al., 2004), yet studies of monozygotic twins reveal considerable differences in their surface morphology (Thompson et al., 2001; White et al., 2002). This could be due to environmental influences during early development. It is found in twin studies that the deeper and developmentally earlier sulci of the brain (i.e., thecentral sulcus or the sylvian fissure) are more highly correlatedthan the superficial or tertiary sulci, which develop mainly after birth, and appear to bemore affected by non-genetic influences (Lohmann et al., 1999).
1.3.7 Explanation of gyrification and fissuration
Gyrus building is considered to be consisting of numerous constructional processes. The gyral crowns, sulcal walls, and fundi (bottom) are different in architectural, connectional and functional features (Welker, 1988). Various models have been proposed to account for the phenomena of convolutions. The non-isotropic forces might be due to the complex
interaction of differential growth of the cortical layers, cell migration, cell myelination, cortical-cortical and cortical-thalamic connectivity, synaptic pruning, brain size and metabolism (White et al., 2010).
It was first proposed that sulcation is due to cortex expansion constrained by the skull and the basal ganglia (LeGrossClark, 1945). It is later found out that removal of large amount of cortical and subcortical structure in sheep brain results in normal sulcal size and organization (Barron, 1950). So cortical folding is likely not due to constrained growth solely. Van Essen (Van Essen, 1997) proposes that neuronal connections that develop during the second trimester produce localized fiber tension which draws densely interconnected regions closer together. Tension along axon in the white matter is suggested to be the primary driving force of cortical folding. As regions of greater connectivity move closer together in an enclosed and rapidly growing brain, they form gyri (outward fold). The more sparsely connected regions drift apart and the sulci (inward fold) form. The tension, although very small for an individual axon, is summed by the very large number of neurons. The characteristic pattern of the convolutions can thus be explained by the highly specific organization of the underlying connectivity. This model suggests that differential growth of different cortical layers is a consequence rather than a cause of cortical folding.
Such a theory links brain surface morphology with regional neuronal connectivity, in a developmental framework (White and Hilgetag, 2008). The link between gyrification and axonal tension has been supported by experimental findings in the primate brain
(Hilgetag and Barbas, 2006).
Alternate folding theories emphasize on mechanical factors such as abutting cortical plates (Richman et al., 1975), or the differential growth with mechanical constrains (Todd, 1982). Genetic factors likely play a crucial role in cortical folding. The genetic control of cortical development is proposed (Rakic, 1988); links between cortical folding and cytoarchitecture is confirmed (Fischl et al., 2008). Cortical folding has also been
linked to genetic factors by studying the abnormal folding of diseases with known genetic link such as William’s syndrome (Gaser et al., 2006; Kippenhan et al., 2005). Indeed, the fiber development, the differential growth in cortical layers and in different sub-regions, could be a complex concerted process determined by genetics.
The major mechanical factors that contribute to the folding process, fiber pulling or differential growth under constrain, remain to be clarified in the future. Some interesting computer based models of cortical folding are proposed, which will be discussed in detail in the next section.
1.4Computational morphometry of cortical folding
The general framework of cortical folding is introduced above. Next, we discuss some computational methods applied to the study of cortical folding. The conventional naming system seems inadequate for describing the folds; this is partly due to the variability that exists, partly due to the use of external morphological criteria alone in the description of folding patterns. One of the goals of this work is to understand better the variability in cortical folding patterns.
The recent advancement in brain imaging such as the Magnetic Resonance (MR) techniques can provide valuable information. Multiple subjects can be followed
consistently in longitudinal studies. Applying modern computational methods, massive data can be analysed automatically. Computational morphometry is the field concerned with the qualification of anatomical features and changes in individual brains or brain populations (Mietchen and Gaser, 2009). This thesis work is an application of
computational morphometry. In the following, only topics relevant to the thesis work are introduced. Subjects less relevant are not discussed; the aim is to introduce subjects that our work can contribute in advancing the current understanding.
1.4.1 Cortical morphology and the modeling of cortical folding
The voxel-based-morphometry (VBM) approach is used in many brain morphometry studies (Ashburner and Friston, 2000). In VBM studies, three-dimensional spatial
alignment is applied; voxel-wise comparison of the local concentration of grey and white matter across populations is then carried out. When the cortex is of interest in particular, the cortical thickness analysis is often used after alignment of the cortical surfaces (Ashburner, 2009; Fischl and Dale, 2000). More related to our work of cortical folding, a group of computational methods utilizing the sulci/gyri are developed, which will be discussed here.
Regarding the cortical folding process, as discussed in section 1.3, numerous factors are involved. Different hypothesis regarding cortical folding are proposed, emphasis are put on fiber tension (Van Essen, 1997), differential growth of the sub-layers (Richman et al., 1975), and differential growth of different sub-regions of the brain (Welker, 1988). The fold formation could be mainly due to genetic factors or mechanical factors. With the advancement in MRI and computer algorithms, these models can be tested.
Computer simulation of the morphogenetic model (Toro and Burnod, 2005) has been proposed to clarify the importance of mechanical and genetic factors in cortical folding. The results suggest that convolutions could be a natural consequence of cortical growth. Such a model can produce primary, secondary and tertiary folds.
The causation of fiber tension for gyrification hence remains controversial. In another recent study, cerebral cortical folding has been modeled combining structural and
diffusion tensor MRI in sheep. Finite element modeling is combined with explicit growth mechanisms to be tested. The growth mechanisms tested are white matter tension or tangential cortical growth that drives cortical folding (Geng et al., 2009). It is found that tangential cortical growth is a plausible biomechanism of sulcal root formation and hence
cortical folding. It is also shown in the developing ferret brain that, even though the axons are verified to be under considerable tension, the tension likely does not drive folding. Using computational models, it is shown that deferential cortical growth accompanied by remodeling of the subplate leads to outward folds and stress fields consistent with microdissection experiments. This result supports a mechanism involving differential growth of the layers (Xu et al., 2010).
Another interesting approach to explain the consistency and variability of the cortical folding pattern proposes a phenomenological model (Lefevre and Mangin, 2010). This model is based on reaction diffusion mechanisms, where the Turing morphogens are responsible for the differential growth of the sulci and the gyri. This model mimics the progressive folding of the cortical surface; it can generate reproducible yet variable patterns using sulcal roots (Regis et al., 2005). The study suggests that interactions between growth factors may be sufficient in the formation of consistent yet variable folding patterns. Such a model would give more emphasis to genetic factors, which subsequently determines the timing and amount of the generation of growth factors.
The mystery of cortical folding and the importance of various factors contributing to this phenomenon remain to be deciphered. The studies discussed above illustrate the exciting potential of computational methods in testing hypothesis of complex phenomenon such as cortical folding.
The cortical folding analysis is of growing interest due to the potential connection of cortical folding to white matter connections underneath (Van Essen, 1997). Recent links has also been found between cortical folding and cytoarchitectony (Fischl et al., 2008). The analysis of cortical folding would thus be valuable for the study of development and pathology (White et al., 2010). Abnormal developments possibly leave traces that can be observed in abnormal folding patterns.
1.4.2 Approaches in the study of cortical folding
One way to allow comparison of cortical folding and morphology across subjects is to first align the surfaces. Many approaches can be used for such two-dimensional spatial normalization. The alignment based on folding depth and curvature on the stable sulci can be carried out. These stable sulci can be defined manually or automatically (Fischl et al., 1999; MacDonald et al., 2000). In cortical thickness and gyral surface analysis (Fischl et al., 2004), the alignment is carried out first.
Beyond cortical thickness and cortical surface analysis, the nature of cortical folding can be studied. An index is used to quantify the extent of folding, the gyrification index (GI). The GI is first defined as the ratio between the lengths of coronal outlines for the brain including and excluding the sulcal regions (Zilles et al., 1988). This approach leads to interesting findings. For example, it is found that the GI increases dramatically in the third trimester of development, then remains more or less constant throughout life (Armstrong et al., 1995).
The limitation to this method of measuring the GI is that it is obtained in two-dimensions, the measurements could be biased. The possibility of defining three-dimensional GI is being explored. The 3D GI can be defined locally from the geometry of the cortical surface (Schaer et al., 2008; Toro et al., 2008); it can also be defined globally (Rogers et al., 2010) or both at the global level and the sulcus level (Cachia et al., 2008). In the study of premature infants, specific GI is designed (Dubois et al., 2008).
Other than the thickness and gyrification index, other features have been used to study cortical folding. The easier to access features are the length, the depth and the surface area of the sulci (Mangin et al., 2004b). Another interesting feature useful to monitor
aging is the opening of the folds, defined as the distance between the two walls of a particular sulcus (Kochunov et al., 2005).
Our methods developed in this work are using a more comprehensive measure, the 3D shape of the folds. The shape needs to be detected and further represented reliably for pattern analysis. The details of the representation of the sulcal shape can be found in Chapter Two and Chapter Three. The sulcal identification and extraction is done by using the software BrainVISA (Mangin et al., 2004b). The image processing algorithms in BrainVISA obtain the shapes of the sulci in three steps. First, a hollow object made up of gray matter and cerebrospinal fluid is extracted from the T1-weighted image. Second, the object from step one is skeletonized to obtain the hemisphere hull and the numerous medial surfaces of the cortical folds. Third, the skeleton obtained in step two is split to separate the folds from each other and from the hemisphere hull. The naming of the sulci can be carried out automatically (Mangin et al., 2004b; Perrot et al., 2009b).
Sulcal extraction and analysis is carried out by other teams as well. In the work of Le Goualher (Le Goualher et al., 1999), the active ribbon method is used to extract the superior and the fundus trace of the sulci; these are then extended to the surface of the whole sulcus. The labeling is semi-automated, in the sense that for the labeling of each sulcus, the user is given a list of choices as the most likely candidates. This list is based on the priors for the expected sulcal spatial distribution. The sulcal shape can then be compared statistically to investigate such issues as the link of sulcal shape to genetics in twin studies (Le Goualher et al., 2000).
Various other methods are used to extract the fundi of the sulcus (Kao et al., 2007; Li et al., ; Seong et al., 2010; Shi et al., 2009) or the surface sulci lines (Fillard et al., 2007; Tu et al., 2007). The results of the analysis using the top or bottom of the sulci would
provide different but interesting information regarding the sulcal pattern and cortical morphometry in general.
The normalization process discussed before would possibly create difficulties in further variability analysis. When studying the shape variability of specific sulci, an interesting approach is to create a co-ordinate system based on the sulcal depth profile (Cykowski et al., 2008). In the next section, some of the findings using the methods discussed above are briefly discussed.
1.4.3 Applications of cortical morphology
The study of cortical morphology can shed some light on many important issues. In particular, the findings in the four domains would be discussed: brain abnormalities, brain development and aging, brain plasticity and the relation of genetics to brain development and cortical folding.
1.4.3.1 Brain abnormalities
Since cortical folding pattern is very stable through-out life in normal population (Armstrong et al., 1995), a deviation from the normal gyrification rates or gyrification patterns has thus a high probability to indicate brain malfunction. Global and regional abnormal gyrification is found in a variety of disorders. Using the 2D normalization approach discussed above, abnormal symmetry of cortical folding has been found in William’s syndrome (Van Essen et al., 2006) and Schizophrenia (Csernansky et al., 2008). Sulcal depth difference is found in autism (Nordahl et al., 2007).
The GI study reveals many interesting results as well. Using the 2D GI, it is found that gyrification pattern in monozygotic twin pairs is different for autism. Increased folding is found in the right parietal lobe, and the increase in folding is associated with more
symptoms of autism (Kates et al., 2009). Decreased folding is found in the prefrontal lobe in patients with obsessive-compulsive disorder (OCD) (Wobrock et al.), while increased
folding in the same region is found to be linked to the high risk group for schizophrenia (Harris et al., 2007). Many other regions of abnormal folding are linked to pathology. For example, abnormal folding in the anterior cingulate cortex is linked to bipolar disorder (Fornito et al., 2007) and OCD (Shim et al., 2009). Measuring gyrification index at both the global and local sulcal level of language-related cortex (Cachia et al., 2008), it is found that the schizophrenia patients with auditive hallucination have a decrease in sulcal index in the superior temporal sulcus, the middle frontal sulcus and the diagonal branch of the Sylvian valley, the region defining the Broca’s area.
Specific sulcal shape has been linked to pathology as well. Change in the frequency of specific folding patterns of the collateral sulcus is linked to temporal lobe epilepsy (Kim et al., 2008). The shape of the temporo-parietal junction and the superior temporal sulcus is linked to inner or outer space hallucinations (Plaze et al., 2009).
1.4.3.2 Brain development and aging
The study of cortical folding can provide many insights of brain development and aging. The computational approaches provide exciting potential of studying cortical folding in newborns (Dubois et al., 2008). Early structural measurements such as cortical folding can be useful in the follow-up study of highly premature infants.
In the study of brain volume related to GI, it is found that there is a disproportionate increase in cortical surface, especially in the prefrontal area (Toro et al., 2008). More general traits such as brain asymmetry can also be studied. The position and surface area asymmetry can be studied in adults (Lyttelton et al., 2009) and infants (Hill et al., 2010). More specific to sulci, the asymmetry of the depth of the central sulcus is studied
(Cykowski et al., 2008). It is found that the central sulcus is asymmetrical in surface area and length (Kloppel et al., 2010; Mangin et al., 2004a).
Cortical analysis can also shed some light on the aging process. The age-related change in sulcal width and depth are studied to show that sulcal structures in multimodal cortical areas have more profound age-related changes than those in unimodal areas (Kochunov et al., 2005). The sulcal depth and surface area change is found in brain atrophy such as in the case of Cerebral Autosomal Dominant Arteriolopathy with Subcortical Infarcts and Leukoencephalopathy (CADASIL) (Jouvent et al., 2009).
1.4.3.3 Brain plasticity
Plasticity and the effect of learning is a subject of enduring interest. A series of VBM studies found links between brain morphometry and function in terms of proficiency in various performances. Brain has the potential for changes in structure and function throughout life. For example, a bilateral gray matter expansion in the medial temporal visual area (also known as V5) is found in juggling novices (Draganski et al., 2004). Furthermore, such changes can be detected after just 7 days of juggling practice (Driemeyer et al., 2008).
Plasticity in terms of cortical folding is less easy to be studied, probably due to the fact that folding changes take much longer than gray matter changes to be established. Some studies do report for example the central sulcus of amputees may eventually lose its characteristic shape (Dettmers et al., 1999). Furthermore, such flattened central sulcus is not observed in amputees of the arms that used their foot for sophisticated activities such as painting or sculpting (Yu et al., 2006). In the study of hand converters, the natural left-handers who are forced to write with the right hand, it is found that the asymmetry of the central sulcus surface area is changed compared to left-handers (Kloppel et al., 2010). In Chapter Four of this thesis, this work on the analysis of the central sulcus of hand-converters is continued with interesting results.
1.4.3.4 Brain development and genetics
The genetic influence on brain structure is found in twin studies (Peper et al., 2007; Schmitt et al., 2007; Thompson et al., 2001). The thickness and surface area of the cortex is likely influenced by different and distinct genetic factors (Panizzon et al., 2009).
Evolutionary studies can provide information complementary to those of clinical studies, since many biological mechanisms behind development; aging, learning and disease are shared between a wide range of organisms (Carroll, 2005).
1.4.4 Organizational framework of cortical folding and future work
Some organizational framework has been proposed regarding the cortical folding patterns. In the sulcal root model (Regis et al., 2005), the variability observed in cortical folding is explained based on the gyri buried inside the sulci (the plis de passage). In rare cases the “plis de passage” is too buried to be observed in adult brains. The sulcal roots are the units corresponding to the first folding locations during fetal development. The units of sulcal roots are organized in a system of meridians and parallels of the cortical surface. The locations of sulcal roots are relatively stable across individuals, the
variability occurs in later development during the folding process. These relatively stable entities across subjects could be very useful for sulcal labeling and spatial normalization before anatomical or functional analysis.
The sulcal roots are obtained in three steps: i) each main sulcus is split into portions according to interruptions observed in literature, mainly from Ono and Kubik atlas (Ono et al., 1990); ii) split based on the “plis de passage”; iii) split based on embryological literature when available. It is assumed that the depth of the “plis de passage” is correlated with the date of apparition.
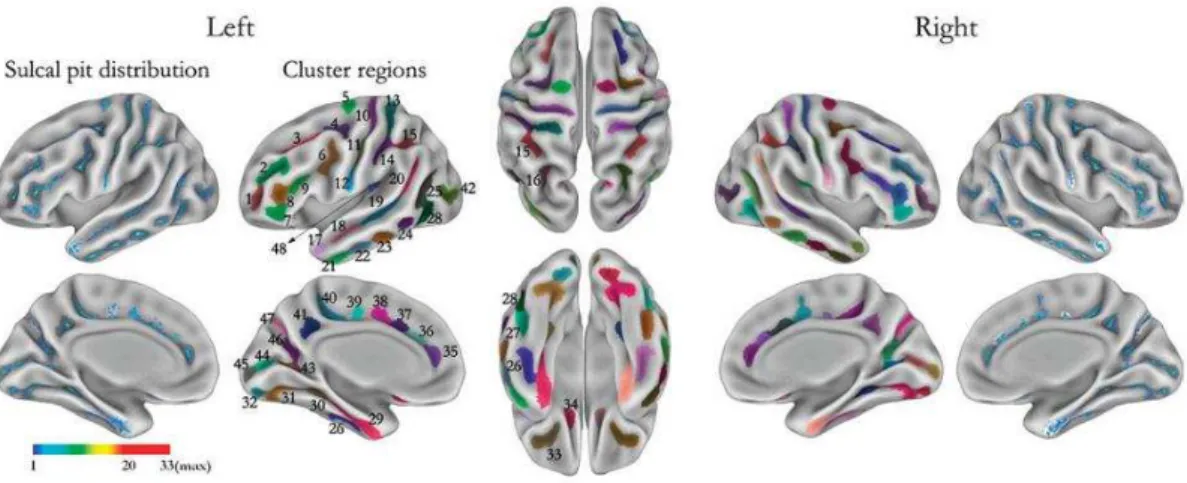
Fig 1.10 The sulcal pits (as presented in (Im et al., 2010))
s.: sulcus, 1 middle frontal s. a, 2 middle frontal s. b, 3 superior frontal s., 4 junction between superior frontal s. and precentral s., 5 precentral s., 6 junction between precentral s. and inferior frontal s., 7 inferior frontal s.a, 8 inferior frontal s. b, 9 inferior frontal s. c, 10 central s. a, 11 central s. b, 12 central s. c, 13 postcentral s. a, 14 postcentral s. b, 15 intraparietal s. a, 16 intraparietal s. b, 17 superior temporal s. a, 18 superior temporal s. b, 19 superior temporal s. c, 20 superior temporal s. d, 21 inferior temporal s. a, 22 inferior temporal s. b, 23 inferior temporal s. c, 24 inferior temporal s. d, 25 inferior temporal s. e, 26 occipito-temporal s. a, 27 occipito-temporal s. b, 28 occipito-temporal s. c, 29 collateral s. a, 30 collateral s. b, 31 collateral s. c, 32 collateral s. d, 33 orbital s., 34 olfactory s., 35 cingulate s. a, 36 cingulate s. b, 37 cingulate s. c, 38 cingulate s. d, 39 cingulate s. e, 40 cingulate s. f, 41 subparietal s., 42 lateral occipital s., 43 calcarine s. a, 44 calcarine s. b, 45 calcarine s. c, 46 parieto-occipital s. a, 47 parieto-occipital
Another approach which obtained very similar map as that of the sulcal roots is the sulcal pits model (Lohmann et al., 2008). The sulcal depth is used; the sulcal pit is the zone of the sulcus where the depth is maximal. These sulcal pits are hypothesized to be under genetic control based on sulcal analysis of monozygotic twins.
The sulcal roots and sulcal pits results are displayed below in Fig 1.9 and Fig 1.10, taken from the original papers (Im et al., 2010; Regis et al., 2005).
To understand better the mechanism of cortical folding, large scale developmental studies (longitudinal) on folding would need to be carried out. Functional analysis would need to be combined with folding pattern analysis to understand better the implications of
(Lefevre and Mangin, 2010) can be used to provide more insights into the process of folding.
On the other hand, systematic folding pattern analysis such as that of the work of Ono (Ono et al., 1990) is still important. Such work can be extended with the knowledge obtained from the above approaches. The knowledge gained can likely provide new insights to the organizational framework of cortical folding discussed above.
1.5Discussion
A brief tour has been given to the subjects of concern to the thesis work: the biological process of cortical folding and cortical morphology. It should be emphasized that this thesis work is an interdisciplinary effort to understand brain development and cortical folding. The methods designed and chosen need to suit the specific neuroscience questions. The evaluation of the validity and quality of the results should be based on neuroscience as well. It is our hope that the knowledge gained through this work may add to the existing knowledge base of neuroanatomy and neuroscience.
The methods developed and used, together with some example results can be found in Chapter Two and Three. An application of such analysis to the understanding of handedness can be found in Chapter Four. Chapter Five present the dictionary and Chapter Six gives a summary of the knowledge gained in terms of cortical folding patterns through this work.
Chapter Two: Clusters of folds
2.1Summary
In this chapter, the concept of using clustering algorithms to analyze cortical folding is introduced. The effort of selecting the suitable shape descriptor and the development of a clustering algorithm specific to cortical folding analysis is described. Some interesting results obtained are presented and discussed.
2.2Introduction to the analysis of cortical folding
Human brain cortex folds to increase its surface area during development. To better understand the nature and the degree of variability, some real brains are presented in Fig
2.1 (as Fig 1.1, shown here for easier inspection). In the first brain, the superior frontal
sulcus (the green fold) is broken into three pieces, while in the second and the third brain it is continuous as shown in most textbooks. Refer to the intermediate frontal sulcus (the cyan fold): in the first brain it is broken into three pieces, in the second brain there exists less discontinuity, while in the last brain it is extremely discontinuous to the extent that it is hard to be labeled in the conventional naming framework.
Fig 2.1The variability in brain folding patterns
Indeed, the traditional naming system cannot account for the huge variability in brain folding patterns. Furthermore, the naming system is based on external morphological
criteria alone, the three-dimensional complexity of the folds is hidden and thus cannot be accounted for.
This leads to the goal of our current effort, try to understand better the variability of sulcal folding patterns in a comprehensive manner. This includes the description of the various folding patterns. The possible link of certain characteristic folding patterns to neurological interpretations such as pathology or behaviour will be explored as well. From the folds alone can we observe patterns characteristic of certain neurological diseases? The knowledge of folding patterns could also be added to the traditional naming system to better characterize the brain morphology. Eventually, this information may be used by the artificial vision system such as BrainVISA for improving automatic fold recognition.
The most detailed description of the sulcus variability has been proposed in the atlas of Ono (Ono et al., 1990). Here we try to approach the analysis of folding patterns in a more systematic way. In one sense, we attempt to automate the work performed by Ono. With the help of computer algorithms, a large amount of subjects can be analyzed in a more consistent manner than visual inspection by human eyes. It is important to keep in mind, however, that this type of cortical folding analysis up till now can only be performed by experienced neuroanatomists. Due to the huge variability that exists, this type of analysis is challenging even for an expert. So to automate this type of analysis, even partially, is not a trivial task.
What are these cortical folding patterns that we are looking for? In the preliminary study these patterns are loosely defined as a group of brains that show a characteristic trait which distinguishes them from the other brains. This characteristic could be based on the 3D shape of the fold, the surface area of the fold, the degree of curvature, the number and position of interruptions etc. Since this type of unsupervised learning on the shape of the folds has never been carried out systematically before, we do not have a clear definition of how to define the resulting patterns to start with. It is also very likely that no single
finite set of parameters (angles, length, depth etc) can be defined to characterize the patterns found. For now, we simply define a pattern to be a certain characteristic that can distinguish one group of folds from another.
We expect to observe characteristic folding patterns in only a subset of the population. Refer back to Fig 2.1, suppose we found two patterns for the superior frontal sulcus (the green fold): one being broken into three pieces, the other being continuous. It is important to keep in mind that, in a given dataset, it is likely that only a subset of the subjects would have one of the two patterns. The rest of the subjects would not fit these two pattern descriptions. The computer algorithm used for clustering should be able to choose the subset that contains interesting patterns.
2.2.1 Clustering algorithms
Now the general goal is defined, we discuss the method that can be used to tackle such a problem of sulcal pattern discovery. Clustering analysis would need to be carried out. Clustering is the unsupervised classification of patterns (observations, data items, or feature vectors) into groups, or clusters. It is distinguished from the supervised learning by the fact that there are no training examples to teach some a priori output. Clustering analysis is performed often when little prior information is available about the data; it is useful for exploration of the interrelationships among the data points, to make an assessment of their structure (Jain et al., 1999). Clustering is an essential component of data mining, a process of exploring and analyzing large amounts of data in order to discover useful information (Berry and Linoff, 2000). While there are still debate toward the ultimate definition of clustering, a rough definition is nonetheless possible: for a given set of data points and a similarity measure, we regroup the data such that objects in the same cluster are similar and objects in different clusters are distinct (Jain and Dube, 1988).
Large number of clustering algorithms exists in literature from various domains, ranging from pattern recognition, artificial intelligence, image processing, statistics, and applied mathematics to marketing, psychology, and biology. In each field, a set of algorithms tend to dominate for historical and practical reasons. For example, the hierarchical-based approach is more used in the artificial intelligence community, while the model-based approach is more used in the statistical community. While exciting new advancement has been made in clustering algorithm development, challenges still remain. Part of the reason is that domain specific problems often require the use of specifically designed algorithms, general clustering algorithms are often not sufficient. The behavior of real-life situations is always complex, unpredictable challenges rise, demanding more sophisticated or more specific solutions.
There is no clustering technique that is universally applicable for uncovering the variety of structures present in multi-dimensional datasets. Not all clustering techniques can uncover all the clusters present with equal facility, because clustering algorithms often contain implicit assumptions about cluster shapes. In reality, data hardly follow the “ideal” structures such as being hyperspherical or linear. Very often, a dedicated clustering algorithm performs slightly better than the existing ones on a specific
distribution of patterns (Jain et al., 1999). Furthermore, it is difficult for humans to obtain an intuitive interpretation of the clustering results, especially for data in high-dimensional space.
Clustering analysis is intensively used in Bioinformatics, especially in gene expression analysis and Microarray analysis. The application of clustering algorithms to the analysis of brain folding patterns is new, the behavior of existing algorithms would need to be studied, new algorithms suitable for this specific domain would need to be designed if necessary and consequently validated.
In terms of the types of clusters, Lorr (Lorr and Maurice, 1983) suggested that there appear to be two types of clusters, compact clusters and chained clusters. For a compact