HAL Id: hal-02418125
https://hal.archives-ouvertes.fr/hal-02418125
Submitted on 18 Dec 2019
HAL is a multi-disciplinary open access
archive for the deposit and dissemination of
sci-entific research documents, whether they are
pub-lished or not. The documents may come from
teaching and research institutions in France or
abroad, or from public or private research centers.
L’archive ouverte pluridisciplinaire HAL, est
destinée au dépôt et à la diffusion de documents
scientifiques de niveau recherche, publiés ou non,
émanant des établissements d’enseignement et de
recherche français ou étrangers, des laboratoires
publics ou privés.
R. Eschbach, B. Feng, B. Vezzoni, F. Gabrielli, F. Alvarez-Velarde, V. Leger,
F. Rocchi, G. Edwards, B. Dixon, Y. Peneliau, et al.
To cite this version:
R. Eschbach, B. Feng, B. Vezzoni, F. Gabrielli, F. Alvarez-Velarde, et al.. Verification of Dose Rate
Calculations for PWR Spent Fuel Assemblies. GLOBAL 2017 - International Nuclear Fuel Cycle
Conference, Sep 2017, Seoul, South Korea. �hal-02418125�
1
Verification of Dose Rate Calculations for PWR Spent Fuel Assemblies
R. Eschbach*a, B. Fengb, B. Vezzonic, F. Gabriellic, F. Alvarez-Velarded, V. Légere, F. Rocchif, G. Edwardsg, B. Dixonh, Y. Pénéliaua, R. Girieuda, S. Häkkineni, T. Viitaneni, A. Rätyi, E. M. Malambuj, and S. Cornetk
aCEA/DEN/DER/SPRC/LECY, France; bANL, USA; cKIT, Germany; dCIEMAT, Spain; eAREVA, France; fENEA, Italy; gCNL, Canada; hINL, USA; iVTT, Finland; jSCK-CEN, Belgium; kOECD/NEA
*CEA, DEN, Cadarache, DER, SPRC F-13-108 Saint-Paul-Lez-Durance, France
Tel: +33(0)04-42-25-47-60, Fax: +33(0)4-42-25-48-49 , Email: romain.eschbach@cea.fr
Abstract – Under the framework of the Nuclear Energy Agency’s Expert Group on Advanced Fuel Cycle Scenarios (NEA/AFCS), a benchmark on dose rate calculations for Pressurized Water Reactor (PWR) Spent Fuel Assembly is currently underway. This multinational effort was first proposed by CEA (French Commissariat à l’Energie Atomique et aux Energies Alternatives) and DOE (U.S. Department of Energy), after having conducted their own bilateral comparative study on dose rate calculations for typical UOX and MOX spent fuel assemblies [1]. The goals of this benchmark are to expand on that work by including more international participants, to verify the dose rate results and potentially include validation efforts depending on the availability of appropriate experimental data.
The dose rate from a spent fuel assembly is an attribute strongly related to nonproliferation aspects; the gamma and neutron radiation serve as a self-protecting deterrent to theft for decades after the fuel is discharged. The U.S. Nuclear Regulatory Commission (NRC) and International Atomic Energy Agency (IAEA) consider the “self-protecting” dose rate to be 1 Sievert per hour (Sv/h) at 1 meter from the fuel assembly [2]. For the UOX case, which was intended to benchmark a frequently-cited reference study [3], 30-year dose rates calculated by CEA and DOE [1] were roughly three times lower than that of the reference study. This finding brings into question commonly-held beliefs regarding the levels of self-protection exhibited by spent PWR fuels.
The first step of the benchmark (verification), which is presented in this paper, was to compare each organization’s calculation methodology and step-by-step results (depletion, decay, and radiation) for two reference cases: 1) a 15x15 PWR spent fuel assembly with UOX fuel at 33 MWd/kg burnup and 2) a 17x17 PWR spent fuel assembly with MOX fuel at 60 MWd/kg burnup. Two different cooling times were chosen for this verification: 30 years, and then 3.7 years in order to differentiate the short-lived and long-lived fission product contributions to the dose rate. Results, performed both with stochastic or deterministic codes, show good agreement between different institutes (KIT, VTT, CIEMAT, ENEA, SCK, AREVA, CNL, CEA, and ANL) for the final dose rate calculations; for the UOX case, all calculated dose rates were close to 5.8 Sv/h (Relative Standard Deviation RSD of 14%) at 30 years of cooling time (3 times lower than those from [3]) and averaged 32.2 Sv/h (RSD of 7%) at 3.7 years. For the MOX case, the calculated dose rate average at 30 years of cooling time is 11.1Sv/h (RSD of 10%).
Different sensitivity studies were also carried out to confirm this good agreement by quantifying the impacts of homogeneous vs heterogeneous assembly geometry, the axial burnup distribution, the pin-by-pin gamma source distribution, the gamma source group structure, the Bremsstrahlung effect, modeling assumptions (tally geometry description, Monte Carlo flux estimators, flux to dose conversion factors,…), etc. None of these variables seemed to significantly impact the final calculated dose rates.
The second step of the benchmark (validation), which may be presented in a future paper, aims to validate the calculations procedures, by comparing results with available experimental data of measured dose rates from commercial spent fuel through air after few years of cooling.
2 I. INTRODUCTION
The U.S. Department of Energy (DOE) and the French Commissariat à l'Énergie Atomique et aux Énergies Alternatives (CEA) conducted a comparative study on dose rate calculations for typical Pressurized Water Reactor (PWR) spent fuel assemblies (with UOX and MOX fuels) [1]. The goal was to verify each organization’s dose rate calculation methodology, especially for cases in which quantitative measurements of proliferation resistance are desired.
The Plutonium that is created in UOX fuel during irradiation and sometimes recycled in the form of mixed oxide (MOX) fuel can be an acquisition target for those wishing to obtain it for weapons use. If the UOX and MOX fuel assemblies were recently discharged after normal residence times from civilian reactors, then the significant amount of gamma radiation from the fuel assemblies make them unattractive to theft, thereby providing an inherent barrier of self-protection. The U.S. Nuclear Regulatory Commission (NRC) and International Atomic Energy Agency (IAEA) consider the “self-protecting” dose rate to be 1 Sievert per hour (Sv/h) at 1 meter from the fuel assembly [2]. This dose rate would help a MOX fuel assembly meet the National Academy of Science’s (NAS) “spent fuel standard”, a condition in which the Pu becomes roughly as inaccessible and unattractive for weapons use as the Pu that exists in conventional commercial spent fuel (UOX).
The dose rate from a spent fuel assembly decreases with time after discharge due to radioactive decay of the gamma-emitting isotopes. Table I (CEA calculations based on APOLLO2.8/DARWIN2.3/TRIPOLI-4 route) shows calculated neutron, gamma, and total dose rates from a standard PWR MOX fuel assembly at one meter away through air (for both fresh and irradiated fuels – with a lower burnup than for the benchmark - 45 GWd/t) after different cooling times). The gamma dose rate is 3-4 orders of magnitude higher than the neutron dose rate for irradiated fuels so for the purpose of this study, the total dose rate can be approximated by just the gamma dose rate.
Accurate predictions of this dose rate after decades of cooling depend on factors such as the assembly’s power history, composition, and geometry as well as the calculated gamma source and radiation deposited on the target. Therefore, in addition to gamma transport calculations, the depletion, decay, and gamma source calculation approaches need to be precisely carried out. For the UOX case, which was intended to benchmark a frequently-cited reference study [3], 30-year dose rates calculated by CEA and DOE [1] were roughly three times lower than that of the reference study; it was shown that the reference dose rate calculations were performed by a point-kernel code typically used for shielding design
(MicroShield) with high gamma transport build-up factors for air that were intentionally selected to provide more conservative values for shielding purposes. This partially explains the large differences between the new calculations and the reference ones.
TABLE I
Dose rate for a standard PWR MOX fuel at one meter in air.
Fresh
Assembly Irradiated PWR MOX Assembly
Cooling
time (y) N/A 0.5 3 10 30
Neutron Dose Rate (μSv/h)
1.62E+02 2.75E+04 2.05E+04 1.56E+04 7.43E+03
Gamma Dose Rate (μSv/h)
5.48E+01 2.37E+08 4.91E+07 1.44E+07 6.37E+06
Total Dose Rate (μSv/h)
2.17E+02 2.37E+08 4.92E+07 1.44E+07 6.38E+06
Under the framework of the Nuclear Energy Agency’s Expert Group on Advanced Fuel Cycle Scenarios (NEA/AFCS), a benchmark on dose rate calculations for Pressurized Water Reactor (PWR) Spent Fuel Assembly is currently underway.
The goals of this benchmark are to expand on that work by including more international participants, to verify the dose rate results and potentially include validation efforts depending on the availability of appropriate experimental data.
II. DESCRIPTION OF THE BENCHMARK Figure I shows a schematic of the comprehensive calculation approach. The benchmark imposed that the dose rate would be calculated at 1 meter from the fuel assembly’s axial midpoint through air (Figure II), 30 years and 3.7 years after discharge. This second cooling time is chosen for two reasons: to compare the calculations for a cooling time for which the contribution of the Fission Products is greater, and to allow a comparison with experimental data that are available at 3.7 years.
The different codes and nuclear data libraries used by the participants are listed below:
SCK-CEN: calculations were performed with
ALEPH 2.6 (MCNP6.1), a code developed at SCK-CEN. For burnup calculations, 15 axial segments were considered.
CIEMAT: calculations were performed using
the EVOLCODE 2.0 (MCNP6.1.1b + ACAB for decay calculations, and JEFF3.2 library).
ENEA: calculations were performed with
different codes for Burn-up, Depletion, Decay and Photon Source, Photon Transport, APOLLO2.8/ORIGEN-S/MCNPX
(ENEA-1), NEWT/ORIGEN-S/MCNPX (ENEA-2),
SERPENT-2/ORIGEN-S/MCNPX (ENEA-3), KENO-VI/ORIGEN-S/MCNPX ‘ENEA-4), ORIGEN-ARP/MCNPX (ENEA-5).
KIT: UOX and MOX depletion calculations
were performed with ECCO/ERANOS2.2 codes and JEFF3.1 data libraries (172 energy groups), decay with ORIGEN-2 and radiation with MCNPX.
AREVA-TN: ORIGEN-ARP and TRIPOLI-4
with CEAV5 data library.
VTT: calculations were performed with the
code SERPENT2 and JEFF3.1.2 library.
CNL: SERPENT2 was used for depletion
calculations, and ORIGEN-S/SCALE5.1 for gamma release, MCNP5.1.40 for gamma transport and dose rate.
ANL: CASMO-4/ORIGEN-2/MCNP5 and
ENDF/B-VII.0.
CEA: APOLLO2.8/DARWIN2.3/TRIPOLI-4
and JEFF3.1.1.
Fig. I. Comprehensive calculation approach to predicting a fuel assembly’s dose rate.
Fig. II. Schematic of gamma photon flux calculation.
For the comparisons, the average value 𝑥̅ was calculated, as well as the Standard Deviation (SD) and the Relative Standard Deviation (RSD). The RSD indicated the degree of consistency between the results provided by the participants: a small RSD indicated high agreement (it means that there is consistency between the various codes and data used); a large RSD indicated poor agreement.
𝑥̅ =∑ 𝑥𝑛 𝑁 𝑛=1 𝑁 𝑆𝐷 = √∑ (𝑥𝑛− 𝑥̅)2 𝑁 𝑛=1 𝑁 − 1 𝑅𝑆𝐷 =𝑆𝐷 𝑥̅ × 100 % III. VERIFICATION
Heavy Metal (HM) and Fission Product (FP) compositions at discharge and after decay (30 and 3.7 years of cooling time) were compared for PWR-UOX (33 MWd/kg) and PWR-UOX (60 MWd/kg), as well as gamma energy release and calculated Equivalent Dose Rate (EDR).
III.A. Results at 30 years of cooling time
A good agreement is found for HM and FP at discharge except for isotopes with low concentrations. The main contributor to the gamma dose rate at 30 years of cooling time is 137Cs/137mBa (661.657 keV), and the RSD is lower than 2% for the concentration of this isotope both for UOX and MOX. 154Eu (68.17 keV and 100.88 keV) and 241Am (59.54 keV) contribute less to the gamma release ( 2% for UOX and 1% for MOX for 154Eu, and 0.2% / 2.5 % respectively for 241Am).
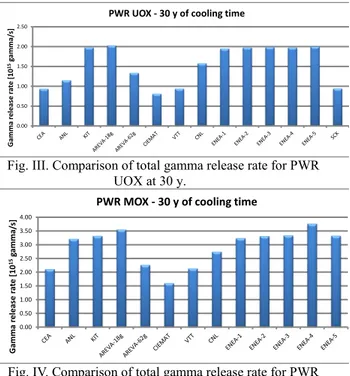
Different energy meshes were used to calculate the gamma release rate: 18 groups (ANL, ENEA, AREVA, KIT), 19 groups (CEA), 45 groups (CNL) or 62 groups (AREVA), so for these calculations, the number of gamma photons released from each energy group are adjusted to conserve energy, thereby resulting in effective dose rates. This adjustment of the number of photons, which was performed by many of the participants, is dependent on the group structure used. For others, the gamma source was
ray by ray so no adjustments were needed. Therefore,
Figures III and IV actually illustrate a range of actual and
effective total gamma release rates for PWR-UOX and
PWR-MOX respectively, which explains the large “release rate” RSDs. of 32% for UOX and 23% for MOX. Different large energy group structures were also used by CIEMAT (1800 groups), CEA ( 19000 groups) leading to maximum effect of 20% on the calculated EDR.
Fig. III. Comparison of total gamma release rate for PWR UOX at 30 y.
Fig. IV. Comparison of total gamma release rate for PWR MOX at 30 y.
Two conversion factor models were used for this study: one from the 1977 ANSI/ANS report [4] and the other from the 1991 ANSI/ANS report [5], as shown in Figure V. For TRIPOLI-4 calculations (CEA), a predefined response function (H*(10)) is used, based on ICRP-74, and intermediate between ANS-77 and ANS-91.
Fig. V. Flux-to-dose-rate conversion factors. The calculated EDRs for PWR-UOX and PWR-MOX using the two conversion factors are listed in TABLE II. The average value for UOX is 5.8 Sv/hr (1977 ANSI) with a SD of 0.8 and a RSD of 14%. The average value for MOX is 11.1 Sv/hr with a SD of 1.2 and a RSD of 10%. Both for UOX and MOX, the calculated EDRs are only slightly lower with the 1991 conversion factor, which indicates that there is no significant contribution to the doses from gammas with low energies (< 0.1 MeV).
All of these calculated EDRs confirm that the PWR-UOX 30-year dose rate should be roughly 2 to 3 times
lower than that of the previous reference study (13.0 to 15.2 Sv/h) for similar burnups (30-35 MWd/kg). The calculated EDR for PWR-MOX is 2 times greater than PWR-UOX, in accordance with a greater gamma release rate (2.88 1015/s for MOX, 1.54 1015/s for UOX).
TABLE II
Equivalent Dose Rate comparison at 30 years [Sv/hr].
III.B. Results at 3.7 years of cooling time
After 3.7 years of cooling, the calculated effective gamma release rates are (averaged value) 6.4 1015 /s for PWR-UOX and 1.3 1016/s for PWR-MOX with RSDs of 41% and 28% respectively. These values are almost four times higher than those at 30 years of cooling time. As shown in Table III, there is a good agreement between participants for the calculated EDRs, which are 6 times greater than the EDRs at 30 years. Roughly 90% of the EDR is in the energy range [0.45 – 1.50 MeV] coming from -emissions from 137Cs/137mBa, 106Rh and 134Cs.
TABLE III
Equivalent Dose Rate comparison at 3.7 years [Sv/hr].
IV. SENSITIVITY STUDIES
Different sensitivity studies were also carried out to confirm this good agreement on calculated EDRs, by
0.00 0.50 1.00 1.50 2.00 2.50 Gamm a rel ease r at e [10 15 gamm a/ s]
PWR UOX - 30 y of cooling time
0.00 0.50 1.00 1.50 2.00 2.50 3.00 3.50 4.00 Ga m m a re le ase ra te [ 10 15 ga m m a/ s]
PWR MOX - 30 y of cooling time
Institutes
PWR UOX – 30 y PWR MOX – 30 y Conversion Factor Conversion Factor 1977 1991 1977 1991 CEA 5.2 4.8 9.5 8.6 ANL 5.8 4.6 11.0 8.6 KIT 5.5 4.3 11.5 9.1 CNL 7.9 6.3 13.7 10.9 ENEA-1 5.3 4.1 11.4 9.0 ENEA-2 5.3 4.2 11.6 9.2 ENEA-3 5.2 4.1 11.7 9.3 ENEA-4 5.2 4.1 11.8 9.3 ENEA-5 5.2 4.1 11.7 9.2 SCK-CEN 7.0 5.6 - - VTT 5.7 4.5 10.1 7.9 AREVA-18g 5.8 4.6 10.2 8.1 AREVA-62g 6.6 5.3 11.7 9.4 CIEMAT 5.2 4.2 9.3 7.4 𝒙 5.8 4.6 11.1 8.9 SD 0.8 0.7 1.2 0.9 RSD 14% 15% 10% 10% Institutes PWR UOX – 3.7 y PWR MOX – 3.7 y Conversion Factor Conversion Factor 1977 1991 1977 1991 CEA 34.3 31.7 - - ANL 32.1 25.7 - - KIT 30.8 24.6 69.8 55.9 VTT 29.3 23.1 57.1 47.5 AREVA-18g 33.9 27.2 67.2 54.0 AREVA-62g 35.2 28.3 69.1 55.7 CIEMAT 29.9 24.0 - - 𝒙 32.2 26.4 65.8 53.3 SD 2.3 2.9 5.9 4.0 RSD 7% 11% 9% 7%
quantifying the impacts of homogeneous vs heterogeneous assembly geometry, the axial burnup distribution (uniform or not), the irradiation history (with or without decay periods), the pin-by-pin gamma source distribution (uniform or not), the RIM effect (increased burn-up in external ring of the pellet), the gamma source group structure (different energy groups from 18 to 62), the impact of stainless steel activation, the Bremsstrahlung effect, the cross-sections effects, modeling assumptions (tally geometry description, Monte Carlo flux estimators, flux to dose conversion factors, interpolation factor,…), neutron dose rate contribution, etc. None of these variables exceed 20% of impact on the final calculated dose rates.
As an example, different surface tally descriptions were considered:
2 cm thick ring perpendicular to and 1 meter from the flat “edge” of the assembly from its axial midpoint,
Sphere targets at 1 meter, with different radii (1 to 10 cm),
Point detector or plate [20x20x0.5 cm3], or 4 surfaces of 100 cm2 each, at 1 meter.
Realistic axial distribution of gamma source based on burnup leads to 10 to 15% higher dose rates.
V. CONCLUSIONS
The reference calculations have confirmed the
self-protection capabilities of the PWR-UOX spent fuel
assembly after 30 years of cooling time, with dose rates of around 5 Sv/h at 1 meter. For the MOX case, the calculated dose rate average at 30 years of cooling time is 11.1 Sv/h.
There is a good agreement between the participants, with Relative Standard Deviation of 7 to 15%. Furthermore, sensitivity studies do not show impacts greater than 20% on the results.
Additional works are still in progress and aim to validate the calculation procedures, by comparing results with available experimental data of measured dose rates from commercial spent fuel through air after a few years of cooling. Different reports have been found so far which describe measured dose rates [6-10] for 1- to 8-year old PWR-UOX spent fuel irradiated to typical burnups, and for different measurement locations. This validation work may be presented in a future paper.
REFERENCES
1. B. FENG, R. N. HILL, R. GIRIEUD, R. ESCHBACH, Comparison of Gamma Dose Rate Calculations for PWR Spent Fuels Assemblies, PHYSOR 2014, Kyoto, Japan, Sept. 28 – Oct. 3 (2014).
2. U.S. Department of Energy, “Nonproliferation and Arms Control Assessment of Weapons Usable Fissile Material Storage and Excess Plutonium Disposition
Alternatives”, DOE/NN-0007 URL:
http://www.osti.gov/scitech/biblio/425259 (1997). 3. W. R. LLOYD, M. K. SHEAFFER, and W. G.
SUTCLIFFE, “Dose Rate Estimates from Irradiated Light Water Reactor Fuel Assemblies in Air,”
Lawrence Livermore National Laboratory Livermore, CA, UCRL-ID-115199, (1994).
4. American Nuclear Society, “American National Standard for Neutron and Gamma-Ray Flux-to-Dose-Rate Factors”, ANSI/ANS-6.1.1-1977 (1977).
5. American Nuclear Society, “American National Standard for Neutron and Gamma-Ray Flux-to-Dose-Rate Factors”, ANSI/ANS-6.1.1-1991 (1991).
6. C.E. WILLINGHAM, “Radiation Dose Rates from
Commercial PWR and BWR Spent Fuel Elements”, PNL-3954, Pacific Northwest Laboratory, October (1981).URL:
https://inis.iaea.org/search/search.aspx?orig_q=RN:12 642536.
7. S.D. ATKIN, “Destructive examination of 3-cycle LWR fuel rods from Turkey Point unit 3 for the climax – Spent Fuel Test”, Hanford Engineering Development Laboratory, June (1981).
8. R.B. DAVIS et al., “Remote characterization of spent LWR fuel for geological disposal demonstration”, American Nuclear Society, March (1980).
9. R.B. DAVIS, “Data Report for the Nondestructive Examination of Turkey Point Spent Fuel Assemblies B02, B03, B17, B41 and B43, HEDL-TME-79-68”, http://www.osti.gov/scitech/servlets/purl/5445903. 10. H.R. STRICKLER and K.J. EGER, “In-Plant Test
Measurements for Spent Fuel Storage at Morris Operation,” NEDG-24922-2, General Electric, September (1981).