M. Dozières
a,, F. Thais
b, S. Bastiani-Ceccotti
c, T. Blenski
b, M. Comet
d, F. Condamine
c,e,
J. Fariaut
d, F. Gilleron
d, D. Gilles
b, JC. Pain
d, M. Poirier
b, C. Reverdin
d, F. Rosmej
c,e, V. Silvert
f,
G. Soullié
d, B. Villette
daHigh-Energy-Density-Physics Group, Center for Energy Research, University of California San Diego, CA 92093, USA bLaboratory “Interactions, Dynamics and Lasers”, CEA/CNRS/Univ Paris-Saclay, UMR 9222, F91191 Gif-sur-Yvette, France cLULI, École Polytechnique, CNRS, CEA, Sorbonne, F-91128 Palaiseau, France
dCEA, DAM, DIF, F-91297 Arpajon, France
eSorbonne Université, Faculté des Sciences et Ingénierie, UMR7605, case 128, 4 Place Jussieu, F-75252 Paris, France fCEA, DAM, Valduc, F-21120 Is-sur-Tille, France
A R T I C L E I N F O Keywords: Atomic physics Absorption spectroscopy Laser experiment LTE plasma Opacity X-ray A B S T R A C T
We present an experiment performed in 2016 at the LULI2000 laser facility in which X-ray and XUV absorption structures of nickel hot plasmas were measured simultaneously. Such experiments may provide stringent tests of the accuracy of plasma atomic-physics codes used to the modeling of plasmas close to local thermodynamic equilibrium. The experimental set-up relies on a symmetric heating of the sample foil by two gold hohlraums in order to reduce the spatial gradients. The plasma conditions are characterized by temperatures between 10 and 20 eV and densities of the order of 10−3g/cm3–10−2g/cm3. For the X-ray part, we investigate the 3d and
2p-4d transitions, and for the XUV part, we recorded the Δn = 0 (n = 3) transitions, which present a high sensitivity to plasma temperature. These latter transitions are of particular interest because, in mid-Z plasmas, they dominate the Planck and Rosseland mean opacities. Measured spectra are compared to calculations performed using the hybrid opacity code SCO-RCG and the Flexible Atomic Code (FAC). The influence of a spectator electron on the calculated spectra is analyzed using the latter code.
Introduction
Plasma opacities are of great interest for astrophysics and inertial confinement fusion. Opacity measurements allow one to validate theo-retical methods and plasma atomic-physics codes which in turn are used to calculate transport coefficients in radiative-hydrodynamics codes. Absorption spectroscopy is a powerful way to study hot and dense matter such as laser-produced plasma. Spectroscopy can provide information on plasma radiative properties, electron structures and plasma equation of state which are of paramount importance for inertial confinement fusion, astrophysical plasmas and laboratory dense plasmas.
In the last few decades, different experiments have been performed for plasmas close to local thermodynamic equilibrium (LTE) with in-direct target heating in the X-ray[1–22]and XUV[23–27]ranges. As appropriate thermodynamics conditions are mandatory for critical studies of atomic physics in dense plasmas, our team has recently de-veloped a new design of indirect heating in order to create plasmas
close to LTE and improve their temperature and density homogeneities. The corresponding experimental set-up has been successful for the X-ray absorption measurements of the 2p-3d transitions of mid-Z elements [28]. The experimental scheme is based on an indirect heating of a multilayer thin foils by two gold hohlraums irradiated by two fre-quency-doubled nanosecond 100 J beams. The spatial gradients of temperature and density inside the sample are reduced during the spectroscopic measurement due to irradiation on both sides of the foil by the hohlraums. The plasma, which is expected to be close to LTE, is probed by an X-ray backlight source created by a gold foil heated by a third nanosecond beam with an energy of about 10 J at 2ω. This backlight source is directly recorded in X-ray and XUV ranges by two different spectrometers. Simultaneously a third spectrometer consisting of two independent tracks detects the signal passing through the thin foil also in X-ray and XUV ranges.
During the experimental campaign, the 2p-3d and 2p-4d absorption structures have been measured for different elements of the iron group
https://doi.org/10.1016/j.hedp.2019.03.007
Received 18 September 2018; Received in revised form 11 March 2019; Accepted 29 March 2019
⁎Corresponding author.
E-mail address:mdozieres@ucsd.edu(M. Dozières).
Available online 30 March 2019
and for different material thicknesses. Furthermore, one XUV spectrum of nickel (Δn = 0 for n = 3), as well as its X-ray spectrum have been measured at the same time. In the present work, only results concerning nickel are discussed. This simultaneous measurement from the same plasma provides two different estimates of the in-situ plasma tem-perature and can validate with better accuracy the atomic-physics codes. Indeed, both kinds of transitions, the X-ray 2p-3d and the XUV 3p-3d, are sensitive to the plasma temperature. In the X-ray case, a change in the electron temperature impacts mainly the 2p-3d spectral position, whereas in the XUV case it will affect mainly the strength of the 3p-3d absorption. The measurement of the position of the 2p-3d transition structures can thus be used as a temperature diagnostic during the measurement of the 3-3 transition structures. Using com-parisons with opacity codes, these measurements offer two different approaches to determine the electron temperature.
In addition, XUV measurements are also specifically interesting for astrophysical purposes. The codes of stellar structure and evolution are sensitive to the Rosseland opacities of iron group elements (Cr, Fe, Ni, Cu) in the XUV range. At photon energies of about 20 eV, the M band contribution of these elements creates an opacity peak which can ex-plain excitations inside the radiative envelope of massive pulsed stars such as beta Cephei-type stars [29]. In such stars, typical thermo-dynamic conditions for iron are T ∼ 15 eV and rho ∼ 10−6g/cc[30].
Considering the average ionization, these astrophysical conditions are equivalent to those of a plasma at 25 eV and 5 mg/cc. The general features of the absorption process in the M band are similar in both cases.
Hereafter, we will describe the experimental set-up in detail, pre-senting the simultaneous detection of X-ray and XUV spectra for nickel plasmas. We will also show and discuss X-ray spectra obtained for different plasma conditions and interpret them using SCO-RCG and FAC codes.
Experimental set up and data processing
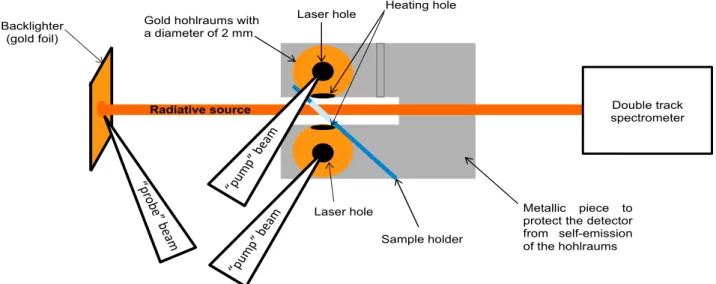
The experiment is performed at the Nd:glass LULI2000 laser facility, using a three-beam configuration. Two high-energy 1.5 ns pulse dura-tion beams (“pump beams”) are used to irradiate two gold spheres in order to create an approximately Planckian radiation which heats a multi-layer foil on each side. Each beam is frequency-doubled (0.526 um) for better X-ray conversion efficiency and provides an on-target energy between 90 J and 300 J. A third 0.9 ns FWHM pulse duration beam (“probe beam”) is used to irradiate a gold foil (the “backlighter”) and creates a radiative source which will probe the hot plasma. This
beam, which is also frequency-doubled, delivers about 10 J and heats the backlighter with a delay of 1.5 or 2.5 ns with respect to the rising edge of the two synchronized pump beams. The probe pulse shape is roughly square, and the spot size is less than 50 µm. This size is in-tegrated in our estimated experimental resolution, which is E/ΔE = 400 in the X-ray range, and about 80 en the XUV range.Fig. 1shows the target design with the configuration of the three beams. The focusing details for each laser beam as well as the type of sample we use are described in Ref.[28].
Table 1summarizes the different samples studied during our ex-perimental campaign.
The areal density is calculated using:
=10 × × 2 × d
A 1
with ρAin μg/cm2, ρ the density of Ni = 8.9 g/cm3and d the thickness
of the sample in nm given by the manufacturer. The factor 2 comes from the angle of the sample regarding to the cavity axis. For all the shots ofTable 1, the probe duration was 0.9 ns, and its delay was 2.5 ns after the heating beams of the two hohlraums.
In order to record plasma absorption structures in both spectral ranges, we use four spectrometers. Two spectrometers are designed to measure the radiation produced by the backlighter source that is par-tially absorbed by the hot plasma of the target sample. This attenuated signal is denoted as the “I” measurement. These “I” spectrometers are two different measurement tracks and are inside one single box. Lines of sight are separated by only 2.5° enabling to record simultaneously the transmitted spectra through the sample, one in the X-ray range (700 eV–1600 eV) and the other one in the XUV range (50 eV–250 eV). The X-ray spectrometer is a new version of the spectrometer described in Ref[31]. It has been used in Ref[28]. It consists of a thin aluminized mylar filter (mylar 1.5 µm Al 0.1 µm), a grazing incidence mirror at 1.5° with a platinum coating, a concave TlAP crystal and a TR imaging plate. The XUV spectrometer track is a new version of the spectrometer de-scribed in Ref. [32]. It is composed of a grazing incidence spherical mirror covered with a nickel layer at 6°, a grazing incidence flat mirror coated with a Ni layer at the same grazing incidence angle and two grazing incidence carbon mirrors at 10° focusing the signal onto a SHI-MADZU 1200 lines/mm flat field diffraction grating, which disperses the signal onto a detection plane where a TR Imaging Plate is inserted. In such an arrangement, we obtain a spectral range from 50 to 250 eV. The two carbon mirrors stop XUV radiations with energies above 200 eV, enabling to perform XUV measurements unperturbed by second order or higher order diffraction from the grating. TR Image Plates are sensitive in both these spectral ranges because they are not protected[33–35].
Two other spectrometers measure the un-attenuated backlighter emission spectra, referred to as the “I0” measurement. The I0 X-ray
spectrometer is the spectrometer described in Ref. [31]. Its mirror is from the same batch and is used at the same grazing incidence angle as the mirror used in the I X-ray track. The radius of the TlAP crystal is the same. The I0XUV spectrometer is set in another box. Its mirrors are
from the same batch as the mirrors used in the I XUV track, have the same coating are used at the same angle. The grating is the same.
Distances are not exactly the same in the I spectrometers and the I0
spectrometers so that dispersion relations on the imaging plates of both X-ray and both XUV spectrometers are not exactly the same. This fact and the anisotropy of X-ray and XUV radiation is taken into account when analyzing data in an experimentally measured X-ray correction ratio shown onFig. 5.
From calibration shots with emission lines of an aluminum target, the exact dispersion of the four spectrometers is deduced. As barium is a component of the TR IP, Ba MIV and MV edges at 796 and 781 eV are visible on all X-ray spectra and are used are a spectral marker. Spectral resolution is 3 eV at 1000 eV (FWHM of Cu emission lines). In the XUV range, zero order is used as a spatial marker and spectral resolution is approximately 1 eV (FWHM of a Cu M emission line at 72 eV).
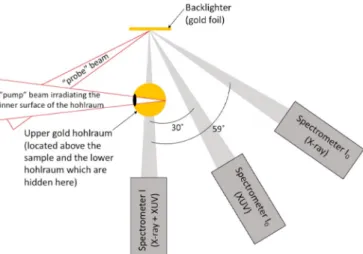
Fig. 2illustrates the positions of the spectrometers with respect to the target. It is worth noting that all spectrometers are pointing to the radiation source, measuring either the backlighter emission (I0) or its
transmission through the heated sample (I).
Furthermore, it is important to prevent recording the self-emission of the gold spheres, used as heating system, on the detectors. For this purpose, we added a metallic screening piece around the target to block this emission from the line of sight of the spectrometers. The efficiency of this piece
Fig. 3has been tested via a specific shot, by focusing the heating beams in the gold spheres (without any backlighter source) and by observing the absence of signal on three of the four detectors. It appears indeed that the two I0spectrometers and the X-ray track inside the I
spectrometer are well protected from the self-emission of the spheres by the metallic piece. However, for the XUV track inside the I spectro-meter, the problem persists, and we still detect a strong signal as shown onFig. 4. In our analysis this signal is subtracted from the XUV ab-sorption spectrum.
The XUV self-emission signal is due to the plasma generated in the gold hohlraums that leaks through the heating holes, thus reaching the line of sight of the I spectrometer a few nanoseconds after the laser pulses. At this time the plasma is still hot enough to emit in the XUV range and the time-integrated detector records this emission.
As visible onFig. 4, the measured cavity self-emission was shown to scale as the square of the heating laser energy. When this energy is 200 J per cavity, the XUV emission at its 80-eV peak is roughly of the same magnitude as the backlighter signal. Since the XUV transmission measurement was performed with 100–120 J per cavity, we estimate that the background signal was then about 4 times lower than the backlighter.
This design permits to produce a mid-Z plasma close to LTE[28], from which we can measure the absorption spectra simultaneously in two different ranges (XUV and X-ray) in a single shot. To determine the transmission I/I0of the hot plasma, the different angles of measurement
between the spectrometers (seeFig. 2) have to be taken into account. Indeed, the backlighter emission measured by all spectrometers on the same shot (i.e. without absorption target) is not identical. This dis-crepancy is due to different detector solid angles, different spectral responses (position of mirrors, incident angles, reflectivities, etc.), and small anisotropic effects. To compensate these geometrical issues on the absorption spectra, we have made different reference shots of the backlighter emission (i.e. without the absorption target) in order to calculate the relative intensity ratio of the spectra obtained with the I and I0 spectrometers. This ratio represents the geometrical
Fig. 2. Top view of the experimental set up showing the line of sight of the three spectrometers.
Fig. 3. Drawing of the metallic screening piece protecting the spectrometers from the self-emission of the gold spheres: a) view from the side of the two I0
discrepancies we have between two spectrometers detecting the same given spectral range. Hence, we can use it as a correction to the ab-sorption spectra.Fig. 5displays these correction ratios for X-ray and XUV ranges. In an ideal case the ratio should be, for both spectral ranges, a horizontal line equal to 1. But as we can see on this figure, it is not the case, which means the intensity received by each spectrometer detecting the same spectral range is slightly different. The various X-ray curves inFig 5(top) refer to different shots, recorded on different days. The overall similarity of these curves ensures the temporal reproduci-bility of the transmission calibration process. In other words, there was
no significant drift of this calibration factor during the whole campaign. This variation can easily be explained by the shot-to-shot fluctuation well known in laser experiment. An average of these three curves has been done as final correction ratio for X-ray range. In addition to this correction, all the spectra are processed as described in ref[28]. Spatial and temporal gradients
Radiative-hydrodynamics calculations have been performed in order to estimate the temperature and density gradients present inside the samples. The 2D axisymmetric (cylindrical geometry) Lagrangian radiative hydrodynamic code FCI2[36,37]has been used to simulate the radiative temperature generated inside the gold spheres and heating the sample but also, to calculate the temperature and density inside the different layers composing the sample. The radiative energy intensity of the hohlraum is simulated by multi-group Monte Carlo transport, cou-pled with LTE opacities modified by simplified non-LTE corrections, implementing the notion of ionization temperature [38,39,40]. The code takes into account the local and non-local effects of the heat flux. Local heat transport is based on the Spitzer model and non-local transport is taken into account via a flux limiter. It is also possible, in order to model non-local effects, to use a so-called “delocalized flux” model[41]calibrated on the Fokker-Planck simulations. The propa-gation and refraction of the laser beam are described by a ray-tracing method. Along these rays, the mechanism of absorption of laser energy by the plasma is the inverse Bremsstrahlung. The propagation of the electromagnetic wave of the laser is not completely described by FCI2, only the energy deposit on the path of the radius in question is calcu-lated. The hydrodynamic evolution of the plasma calculated by FCI2 makes possible to obtain the evolution of the electron and ion tem-peratures.Fig. 6 shows the temperature and density inside a nickel target as a function of the position inside the sample. Each curve cor-responds to a different time, with the origin t = 0 at the beginning of the “pump” laser pulses.
Fig. 4. Background XUV emission from the gold spheres measured for various energies of the heating laser.
Fig. 5. Correction ratios corresponding to the different observing angles of I and I0spectrometers for (top) X-ray spectral range, calculated over three
dif-ferent shots separated in time over the experimental campaign; and (bottom) XUV spectral range, calculated over only one shot.
Fig. 6. Temperature (upper plot) and density (lower plot) profiles for different times obtained from hydro-radiative simulation of shot 79.
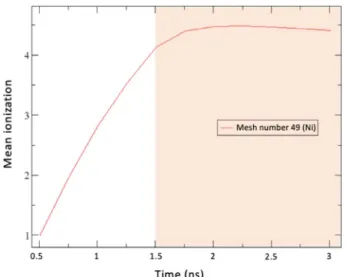
These simulations have been performed assuming a diluted Planckian radiation determined from the hohlraum simulations. We can see that the spatial gradients are rather limited inside the nickel layer of interest. The density within the carbon layers is less homogeneous which motivated our choice to use multilayer sample. Indeed, these carbon layers are the first to be heated by the radiation and expand quickly in space while the nickel layer keeps a rather stable and uni-form density. On the other hand, we can see significant temporal var-iations during the probing time (Fig. 6). But as shown inFig. 7, during the probing time, the mean ionization is fairly constant.
Since the mean ionization is one of the most important parameters for the calculation of spectra, it allows us to consider the plasma as stable and homogeneous during this probing time despite of the tem-perature and density temporal fluctuations.
X-ray and XUV spectra
In this section, we present several measured nickel X-ray and XUV spectra compared to calculations performed using the atomic-physics code SCO-RCG[42–45]and to the detailed atomic code FAC[46].
The hybrid (detailed-statistical) opacity code SCO-RCG is devoted to the diagnostics and interpretation of spectroscopy experiments in LTE
many statistical transition arrays by small-scale Detailed-Line-Ac-counting calculations. This allows us to improve the treatment of the highly excited states and thus of many satellite lines[45].
Calculations have also been performed using the Flexible Atomic Code (FAC)[46]. This code is able to handle the most general config-uration interaction, i.e., between relativistic and non-relativistic con-figurations. An Unresolved Transition Array mode [50,51] is also available, where first moments are computed for transitions between two relativistic configurations.
Note that this mode, based on relativistic configuration average, is more commonly named SOSA in the literature. Additionally, a hybrid mode has been recently developed where some levels are dealt with in detail (fine-structure) while others are averaged through the transition array formalism [52]. The data produced by FAC are post-processed using a code recently developed[53]. As a rule, the UTA/SOSA mode of FAC allows one to perform atomic computations faster by orders of magnitude than the detailed mode. However, it has been mentioned previously [10] that this average mode is inefficient for describing strongly absorbing transitions such as the 2p-3d lines analyzed below: in such cases, the UTA mode overestimates the maximum transmission depth. This is due to the inaccuracy in the line profile used in UTA mode[10]and does not apply to weakly absorbing lines.
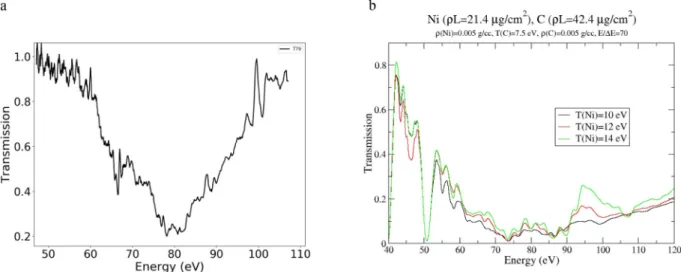
Fig. 8ashows the measured transmission of a nickel plasma (shot 75, see Table 1) compared to theoretical spectra computed with the SCO-RCG code at two different temperatures (10 and 12 eV) and at a density of 0.005 g/cm3.
In the SCO-RCG computation, the ratio of the 2p1/2-3d3/2and 2p3/2
-3d5/2relativistic substructures of the 2p-3d absorption feature is well
reproduced by the computations at temperatures between 10 and 12 eV. The amplitudes of the 2p-4d transitions, at higher photon
Fig. 7. Variation of mean ionization with respect to time for mesh number 49 of nickel (shot 79, see the preceding figures). The colored zone corresponds to the probing time range.
Fig. 8. (a) Measured transmission of a nickel plasma (shot 75, seeTable 1) compared to theoretical spectra calculated with the SCO-RCG code at two different temperatures (10 and 12 eV) and at the density of 0.005 g/cm3. (b) Computation of a C–Ni–C plasma transmission with FAC, compared to shot 75 (seeTable 1). The
energies, seem to be in better agreement with the calculation at
T = 12 eV.
The FAC computation for Shot 75 is plotted onFig. 8band, like for the SCO-RCG results, the presents calculation made for 12 eV and 5 mg/cm3. The absorption of carbon tampers has been accounted for
assuming a temperature of 10 eV, a density of 3 mg/cm3, and an areal
density of 42.4 µg/cm2. The carbon absorption is dealt with in UTA
mode, though the detailed result would be very similar. The nickel bound-free absorption is also dealt with in UTA mode: as we have been able to check using a simpler configuration set, the detailed calculation would give similar results and require a significant com-putational effort. Concerning the bound-bound contribution, some attention has been devoted to the effect of spectator electrons. This effect of a spectator 4 × 1 electron is discussed in theAppendix A. The bound-bound contribution is computed using a newly implemented hybrid mode of FAC [53]. The configurations involved in the 2p-3d line, including the 4 × 1 spectator electron are treated as detailed, while all the other configurations are in UTA mode. OnFig. 8b one observes a good agreement between FAC and experiment. In parti-cular the position and depth of the 2p-3d main structure around 860 eV is correctly described assuming T = 12 eV and ρ = 5 mg/cm3
for the Ni slab. Accounting for a spectator electron Nl with N = 4, 5 or 6 and 0 ≤ l ≤ N − 1 one gets a transmission in agreement with shot 75 for the 2p-4d structures in the 925–950 eV range. For these com-ponents, one notices that FAC data are shifted toward high energies by 2 to 4 eV. We have no definite explanation for this shift that is also visible though smaller in the SCO-RCG computation. Above 1000 eV where the plasma opacity is mainly due to photoionization, we ob-serve an overall good agreement. We have tried to include the 2s-np lines that are visible in the 1050–1100 eV region in SCO-RCG com-putation, but since they cannot be identified with any structure on shot 75, we decided to neglect them.
In order to test our experimental scheme, in particular the ability to produce near-LTE plasmas using the X-ray heating from gold hohl-raums, several shots were taken with which the hohlraums were re-placed by two gold foils irradiated by two laser beams. Experimental spectra are presented inFig. 9a. If we compare the spectra with foils and the spectra with hohlraums, we find that in the case of a heating by the hohlraums, using SCO-RCG code it is possible to interpret the ex-perimental spectrum for a homogeneous plasma at a given temperature (T = 10 eV). However, in the case of gold foil heating, it was necessary to average two separately computed spectra, one at T = 10 eV and the other at T = 17 eV to reproduce the experimental spectrum (Fig. 9b). This seems to indicate that the temperature gradients are more im-portant in the configuration using foils. Similar effects were observed on the density gradients. This was expected, since in the case of the foils, the radiation is far from being Planckian; this explains why the homogeneity of the sample is not as satisfactory as in the case of the heating by hohlraums (Fig. 9b).
Similar results have been obtained using FAC as shown inFigs. 9c and9dfor shot 79 with cavities and shot 81 with foils, respectively. The absorption due to nickel and carbon slabs have been computed as mentioned above forFig. 8b. In agreement with the hydro-analysis, a temperature of 7.5 eV and mass density of 2 mg/cm3has been assumed
for the carbon inFig. 9c, regardless of Ni temperature. InFig. 9cwe note that the 2p-3d structure is correctly reproduced assuming
T = 12 eV as for shot 75.
InFig. 9dwe note a rough agreement on 2p-3d position assuming that temperature gradients can be represented by an average between
T = 10 and T = 17 eV calculations. We also note, in agreement with
SCO-RCG, that the continuous contribution to the transmission asso-ciated to C and Ni photoionization is rather different in experimental data and computations. Some moderate differences between SCO-RCG and FAC are related to differences in the photoionization cross-sections and to the less complete character of the level list included in the FAC computation for nickel.
Since we are confident in the determination of areal masses and since both theoretical models obtain a transmission higher by 0.1–0.2 than measured in the region above 900 eV, we estimate that the dis-crepancy inFigs. 9cor9dis related to a calibration issue. To confirm this, we display onFig. 9ean analysis of the Beer–Lambert law com-paring shots 75 and 79. The position of the 2p-3d structures and the laser energy listed inTable 1suggests that the sample temperature is similar in both shots. Indeed Beer–Lambert law holds in the 2p-3d re-gion since the black curve and the blue curve are rather similar here. Conversely, the scaled transmission for shot 79 is below the transmis-sion for shot 75 by 0.2 units in the 900–1200 eV energy range. One must keep in mind that both shots were performed with 140-nm-thick carbon tampers, therefore we expect that the 28/17 exponent on the blue curve should result in a lower transmission. However, a FAC computation shows that this carbon slab transmission at 800 eV (resp. 1200 eV) is about 0.87 (resp. 0.95). Therefore, the Beer–Lambert scaling should result in a lowering by a factor 0.91 (resp. 0.97) of the blue curve with respect to the black one. The shift observed onFig. 9eis indeed significantly greater. Gradients in temperature or density cannot be invoked either, since both 10 eV and 17 eV computations exhibit the same disagreement with experiment on photoionization signal. We at-tribute the Beer–Lambert-law breakdown in the 900–1200 eV region to a calibration issue.
Due to the above-mentioned influence of the XUV self-emission of the gold spheres, the XUV absorption spectra are difficult to measure and we present here only one experimental XUV spectrum for a nickel plasma. Fig. 10a presents the XUV spectrum obtained and Fig 10b shows SCO-RCG calculations. The signal-to-noise ratio being low, we treat this XUV spectrum as a preliminary result.
The XUV spectrum presented here, as well as the X-ray spectrum of Figs. 8a and 8b, have been detected simultaneously from the same plasma. We can see for both of them that the same temperature in the 10–14 eV range has been inferred using two independent simulations (Fig. 8aand10b), making this first XUV result very encouraging.
However, the XUV spectrum was difficult to measure and represents only a “trace” of absorption structure that provides motivation to continue these measurements.
To obtain the spectrum in Fig. 10a, we first divided the raw transmission data by the XUV correction ratio (Fig. 5b) and then we subtracted the cavity self-emission obtained with 200 J energy laser. But the fact that we recorded only one calibration curve in the XUV range, and that the self-emission used corresponds to higher energy laser that what was used for shot 79 surely limits the reliability of this XUV result. ComparingFigs. 10 and4, we note that the max-imum absorption occurs close to 80 eV, precisely where the cavity emission is maximum. Therefore, this spectrum, obtained without any temporal resolution, must be taken with care and the comparison with theoretical computation is not fully significant. Due to the lack of a streak camera, we simply consider this campaign as a benchmark for the setup involving simultaneous detection of X and XUV ab-sorption.
Conclusion
During this experimental campaign, we have made progress in our project to measure simultaneously X-ray and XUV spectra of nickel and copper plasmas. Concerning the X-ray spectra, the plasma temperatures have been rather lower than those of our previous measurements (see[28]), due to the use of lower laser energy in order to reduce the “background” self-emission from the gold hohl-raums. Therefore the present study may be considered as an exten-sion of our previous work to lower sample temperatures. In nickel, the absorption in the 2p-3d region has been correctly interpreted by the hybrid SCO-RCG opacity code and with FAC, while an acceptable agreement is obtained for the photoionization level at least on the shot 75 (thick sample). We attribute the limited agreement on the
photoionization level to calibration issues. Concerning the XUV spectra, only one XUV transmission spectrum was recorded si-multaneously with the X-ray spectrum in the case of a nickel plasma. Indeed, this XUV spectrum only exhibits a qualitative agreement with theoretical calculations. Furthermore, we had to subtract the cavity self-emission from the transmitted light, which is a delicate procedure since this emission was measured in a separate shot. Last,
the calibration of the transmission was less accurate in the XUV range than in the X-ray range.
Let us note however that all measured spectra were time in-tegrated. In future experiments, we plan to make time-resolved measurements using a streak camera in order to clearly separate the XUV absorption signal from the background emission from the gold hohlraums.
Fig. 9. (a) Experimental spectra of C–Ni–C corresponding to shots 79 (heating by gold spheres) and 81 (heating by gold foils). (b) SCO-RCG calculations: we can see that shot 79 can be interpreted at a single temperature (10 eV), but that shot 81 can only be interpreted by averaging spectra at different temperatures (10 and 17 eV). This tends to confirm that the heating by spheres yields a better homogeneity of the sample then the heating by foils. (c) FAC calculation for shot 79. Computations have been done with T = 10 eV, 12 eV, 13.5 eV and ρ = 5 mg/cm3for nickel, with an areal density of 21.4 µg/cm2. Conditions for carbon are T = 7.5 eV, ρ = 2 mg/
cm3, ρL = 42.4 µg/cm2. (d) FAC computation for shot 81 with the same procedure as with SCO-RCG inFig 9b. (e) Test of Beer–Lambert law on shots 75 and 79.
Acknowledgments
We gratefully acknowledge the invaluable support of the entire LULI2000 staff. This research was partially funded by the EURATOM research and training program 2014–2018 in the framework of the ToIFE project of the EURO fusion Consortium (http://web.luli.
polytechnique.fr/IFE-KiT/ToIFE.htm) under grant agreement no. 633053. F.B. Rosmej acknowledges support from the CNRS for his partial sabbatical. The experiments described in the present work were conducted during the Ph.D. thesis of M. Dozières. She was then af-filiated to “CEA, IRAMIS, LIDyL, Saclay, F-91190 Gif-sur-Yvette, France” and V. Silvert to “CEA, DAM, DIF, F-91297 Arpajon, France”. Appendix A. Influence of a spectator electron on the 2p-4d lines
In a previous paper[17], see also[54], we have shown that the 2p-3d structure for moderate-Z metals such as Fe reveals a competition process between the spin-orbit effect and a configuration broadening associated to the 3p subshell opening. For ion temperatures above 20 eV this broadening tends to wash out the spin-orbit splitting[16, 17]. We might expect to observe a similar competition in the analyzed experiment. However, the sample temperatures in the experiment presented in this paper, were usually below 15 eV. Using the UTA mode in FAC we have been able to check that the 3p subshell is then almost filled, the 3p5/3p6population ratio being less than 0.03. Namely at 12 eV and 5 mg/cm3, a simple
UTA estimation, including all possible M-shell occupations, shows that the 3p5population is about 0.014, and the 3s23p4or 3s3p6populations are
below 10−4.
Conversely, we have checked that the influence of outer electrons cannot be ignored in order to describe properly 2p-4d transitions. For instance, the contribution of transitions such as 2p63d54l → 2p53d54d 4l (l = 0–3, subshells 1s22s23s23p6are omitted for the sake of clarity) must be added
to the “main” contribution 2p63d6→ 2p53d64d. Ignoring these satellite lines we have checked that the 2p-4d transition structures are too deep
compared to experimental data. This effect is illustrated byFig. A1where the transmission spectrum is calculated for a nickel plasma with T = 10 eV. SOSA mode is used to allow for a rather large number of configurations. The influence of a single outer spectator electron Nl with 4 ≤ N ≤ 8 has been tested. More than one spectator electron might be considered, but the population of such multiply excited states should be almost negligible. First, we note that this outer Nl spectator electron does not significantly affect the 2p-3d structure. Then, we observe that, ignoring the spectator electron, the plasma transmission at 910 eV would be about 0.45, while it increases up to 0.62 with Nl spectator included. This last value is in better agreement
Fig. 10. (a) XUV measured transmission spectrum of nickel (shot 79). (b) XUV absorption spectra computed with SCO-RCG code.
Fig. A1. Influence of an outer spectator electron on the 2p-nd transmission of a nickel plasma with T = 10 eV, ρ = 5 mg/cm3, σ = 35.2 µg/cm2. The carbon tamper
J. Fenske, E. Hsieh, R.W. Lee, J. Quant. Spectrosc. Radiat. Transf. 51 (1994) 19. [5] S. Gary, J. Bruneau, A. Decoster, D. Desenne, F. Garaude, J.P. Le Breton,
J.C. Gauthier, J. Bauche, C. Bauche-Arnoult, J.L. Ocaña, C. Molpeceres, M.L. Gamez, J. Quant. Spectrosc. Radiat. Transf. 54 (1995) 155.
[6] T.S. Perry, K.S. Budil, R. Cauble, R.A. Ward, D.R. Bach, C.A. Iglesias, B.G. Wilson, J.K. Nash, C.C. Smith, J.M. Foster, S.J. Davidson, F.J.D. Serduke, J.D. Kilkenny, R.W. Lee, J. Quant. Spectrosc. Radiat. Transf. 54 (1995) 317.
[7] T.S. Perry, P.T. Springer, D.F. Fields, D.R. Bach, F.J.D. Serduke, C.A. Iglesias, F.J. Rogers, J.K. Nash, M.H. Chen, B.G. Wilson, W.H. Goldstein, B. Rozsnyai, R.A. Ward, J.D. Kilkenny, R. Doyas, L.B. Da Silva, C.A. Back, R. Cauble, Phys. Rev. E 54 (1996) 5617.
[8] H. Merdji, T. Miβalla, T. Blenski, F. Perrot, J.C. Gauthier, K. Eidmann, C. Chenais-Popovics, Phys. Rev. E 57 (1998) 1042.
[9] C. Chenais-Popovics, F. Gilleron, M. Fajardo, H. Merdji, T. Miβalla, J.C. Gauthier, P. Renaudin, S. Gary, J. Bruneau, F. Perrot, T. Blenski, W. Fölsner, K. Eidmann, J. Quant. Spectrosc. Radiat. Transf. 65 (2000) 117.
[10] C. Chenais-Popovics, M. Fajardo, F. Gilleron, U. Teubner, J.-C. Gauthier, C. Bauche-Arnoult, A. Bachelier, J. Bauche, T. Blenski, F. Thais, F. Perrot, A. Benuzzi, S. Turck-Chièze, J.-P. Turck-Chièze, F. Dorchies, U. Andiel, W. Foelsner, K. Eidmann, Phys. Rev. E. 65 (2001) 016413.
[11] C. Chenais-Popovics, Laser Part Beams 20 (2002) 291.
[12] F. Gilleron, H. Merdji, M. Fajardo, O. Henrot, J.C. Gauthier, C. Chenais-Popovics, W. Fölsner, K. Eidmann, J. Quant. Spectrosc. Radiat. Transf. 69 (2001) 217. [13] F. Thais, S. Bastiani, T. Blenski, C. Chenais-Popovics, K. Eidmann, W. Fölsner,
J.-C. Gauthier, F. Gilleron, M. Poirier, J. Quant. Spectrosc. Radiat. Transf. 81 (2003) 473.
[14] F. Thais, C. Chenais-Popovics, K. Eidmann, S. Bastiani, T. Blenski, F. Gilleron, J. Phys. IV France 127 (2005) 119.
[15] D.J. Hoarty, J.W.O. Harris, P. Graham, S.J. Davidson, S.F. James, B.J.B. Crowley, E.L. Clark, C.C. Smith, L. Upcraft, High Energy Density Phys. 3 (2007) 325. [16] G. Loisel, P. Arnault, S. Bastiani-Ceccotti, T. Blenski, T. Caillaud, J. Fariaut, W. Fölsner, F. Gilleron, J.-C. Pain, M. Poirier, C. Reverdin, V. Silvert, F. Thais, S. Turck-Chièze, B. Villette, High Energy Density Phys. 5 (2009) 173. [17] T. Blenski, G. Loisel, M. Poirier, F. Thais, P. Arnault, T. Caillaud, J. Fariaut,
F. Gilleron, J.-C. Pain, Q. Porcherot, C. Reverdin, V. Silvert, B. Villette, S. Bastiani-Ceccotti, S. Turck-Chièze, W. Foelsner, F. de Gaufridy de Dortan, Phys. Rev. E 84 (2011) 036407.
[18] T. Blenski, G. Loisel, M. Poirier, F. Thais, P. Arnault, T. Caillaud, J. Fariaut, F. Gilleron, J.-C. Pain, Q. Porcherot, C. Reverdin, V. Silvert, B. Villette, S. Bastiani-Ceccotti, S. Turck-Chièze, W. Foelsner, F. de Gaufridy De Dortan, High Energy Density Phys. 7 (2011) 320.
[19] T.S. Perry, R.F. Heeter, Y.P. Opachich, P.W. Ross, J.L. Kline, K.A. Flippo, M.E. Sherrill, E.S. Dodd, B.G. DeVolder, T. Cardenas, T.N. Archuleta, R.S. Craxton, R. Zhang, P.W. McKenty, E.M. Garcia, E.J. Huffman, J.A. King, M.F. Ahmed, J.A. Emig, S.L. Ayers, M.A. Barrios, M.J. Gay, M.B. Schneider, D.A. Liedhal, B.G. Wilson, T.I. Urbatsch, C.A. Iglesias, J.E. Bailey, G.A. Rochau, High Energy Density Phys. 23 (2017) 223.
[20] J. Zhang, J. Yang, Y. Xu, G. Yang, Y. Ding, J. Yan, J. Yuan, Y. Ding, Z. Zheng, Y. Zhao, Z. Hu, Phys. Rev. E 79 (2009) 016401.
[21] X.D. Zhang, J.Y. Zhang, Y. Zhao, G. Xiong, B. Zhao, G.H. Yang, J. Zheng, J.M. Yang, Phys. Plasmas 19 (2012) 123301.
[22] G. Xiong, J.M. Yang, J.Y. Zhang, Z.M. Hu, Y. Zhao, B. Qing, G.H. Yang, M.X. Wei,
Phys. Plasmas 18 (2011) 113302.
[27] B. Qing, Z. Zhang, M. Wei, Y. Yang, Z. Yang, G. Yang, Y. Zhao, M. Lv, G. Xiong, Z. Hu, J. Zhang, J. Yang, J. Yan, Phys. Plasmas 25 (2018) 023301.
[28] M. Dozières, F. Thais, S. Bastiani-Ceccotti, T. Blenski, J. Fariaut, W. Fölsner, F. Gilleron, D. Khaghani, J.-C. Pain, C. Reverdin, F. Rosmej, V. Silvert, G. Soullié, B. Villette, High Energy Density Phys. 17 (2015) 231.
[29] S. Salmon, J. Montalbán, T. Morel, A. Miglio, M.A. Dupret, A. Noels, MNRAS 422 (2012) 3460.
[30] S. Turck-Chièze, F. Delahaye, D. Gilles, G. Loisel, L. Piau, High Energy Density Phys. 5 (2009) 132.
[31] C. Reverdin, G. Loisel, M. Bougeard, Rev. Sci. Instrum 81 (2010) 10E327. [32] C. Reverdin, F. Thais, G. Loisel, M. Busquet, S. Bastiani, T. Blenski, T. Caillaud,
W. Foelsner, D. Gilles, F. Gilleron, J.C. Pain, M. Poirier, F. Serres, G. Soulie, S. Turck-Chièze, B. Villette, Rev. Sci. Instrum. 83 (2012) 10E134. [33] G. Boutoux, D. Batani, F. Burgy, J.E. Ducret, P. Forestier-Colleoni, S. Hulin,
N. Rabhi, A. Duval, L. Lecherbourg, C. Reverdin, K. Jakubowska, C.I. Szabo, S. Bastiani-Cecotti, A. Cursio, R. De Angelis, F. Ingenito, J. Baggio, D. Raffestin, Rev. Sci. Instrum. 87 (2016) 43108.
[34] B.H. Failor, E.M. Gullikson, N.G. Link, J.C. Riordan, B.C. Wilson, J. Inst. 7 (2012) P04011.
[35] A.L. Meadowcroft, C.D. Bentley, E.N. Stott, Rev. Sci. Instrum. 79 (2008) 113102. [36] E. Buresi, J. Coutant, R. Dautray, M. Decroisette, B. Duborgel, P. Guillaneux,
J. Launspach, P. Nelson, C. Patou, J.M. Reisse, J.P. Watteau, Laser Part Beams 4 (1986) 531.
[37] G. Schurtz in, R. Dautray, J.P. Watteau (Eds.), La Fusion Thermonucléaire Par Laser, Part. 3, 2 Eyrolles, Paris, 1993[in French].
[38] M. Busquet, Phys. Fluids B 5 (1993) 4191.
[39] C. Bowen, P. Kaiser, J. Quant. Spectrosc. Radiat. Transf. 81 (2003) 85. [40] C. Bowen, F. Wagon, D. Galmiche, P. Loiseau, E. Dattolo, D. Babonneau, Phys.
Plasmas 11 (2004) 4641.
[41] G.P. Schurtz, P.D. Nicolai, M. Busquet, Phys. Plasmas 7 (2000) 4238.
[42] Q. Porcherot, J.-C Pain, F. Gilleron, T. Blenski, High Energy Density Phys. 7 (2011) 234.
[43] J.-C. Pain, F. Gilleron, Q. Porcherot, T. Blenski, Proceedings of the 40th EPS Conference on Plasma Physics, 2013 P4.403http://ocs.ciemat.es/EPS2013PAP/ pdf/P4.403.pdf.
[44] J.-C. Pain, F. Gilleron, T. Blenski, Laser Part. Beams 33 (2015) 201. [45] J.-C. Pain, F. Gilleron, High Energy Density Phys. 15 (2015) 30. [46] M.F. Gu, Can. J. Phys. 86 (2008) 675.
[47] T. Blenski, A. Grimaldi, F. Perrot, J. Quant. Spectrosc. Radiat. Transf. 65 (2000) 91. [48] R.D. Cowan, The Theory of Atomic Structure and Spectra, University of California
Press, Berkeley, 1981.
[49] C.A. Iglesias, V. Sonnad, High Energy Density Phys. 8 (2012) 154.
[50] J. Bauche, C. Bauche-Arnoult, M. Klapisch, Adv. At. Mol. Phys. 23 (1988) 131. [51] J. Bauche, C. Bauche-Arnoult, O. Peyrusse, Atomic Properties in Hot Plasmas, from
Levels to Superconfigurations, Springer Verlag, Berlin, 2015.
[52] S.B. Hansen, J. Bauche, C. Bauche-Arnoult, M.F. Gu, High Energy Density Phys. 3 (2007) 109.
[53] M. Poirier, Contrib. Plasma Phys. 58 (2018) 1005.
[54] C.A. Back, T.S. Perry, D.R. Bach, B.G. Wilson, C.A. Iglesias, O.L. Landen, S.J. Davidson, B.J.B. Crowley, J. Quant. Spectrosc. Radiat. Transf. 58 (1997) 415.