HAL Id: hal-00584178
https://hal.archives-ouvertes.fr/hal-00584178
Submitted on 9 Apr 2011
HAL is a multi-disciplinary open access archive for the deposit and dissemination of sci-entific research documents, whether they are pub-lished or not. The documents may come from teaching and research institutions in France or abroad, or from public or private research centers.
L’archive ouverte pluridisciplinaire HAL, est destinée au dépôt et à la diffusion de documents scientifiques de niveau recherche, publiés ou non, émanant des établissements d’enseignement et de recherche français ou étrangers, des laboratoires publics ou privés.
Structural characterization of
SiO2-Na2O-CaO-B2O3-MoO3 glasses
Daniel Caurant, Odile Majérus, Edouard Fadel, Marion Lenoir, Christel
Gervais, Thibault Charpentier, D.R. Neuville
To cite this version:
Daniel Caurant, Odile Majérus, Edouard Fadel, Marion Lenoir, Christel Gervais, et al.. Structural characterization of SiO2-Na2O-CaO-B2O3-MoO3 glasses. XXIst International Congress on Glass, Jul 2007, Strasbourg, France. �hal-00584178�
Structural characterization of SiO
2-Na
2O-CaO-B
2O
3-MoO
3glasses
D. Caurant, O. Majérus, E. Fadel, M. Lenoir
CNRS, ENSCP, Laboratoire de Chimie de la Matière Condensée de Paris (UMR-CNRS 7574), 75231 Paris, France
C. Gervais
CNRS, Université Pierre et Marie Curie, Laboratoire de Chimie de la Matière Condensée de Paris (UMR-CNRS 7574), 75252 Paris, France
T. Charpentier
CEA Saclay, Laboratoire de Structure et Dynamique par Résonance Magnétique, DSM/DRECAM/SCM-CEA/CNRS URA 331, 91191 Gif sur Yvette, France
D. Neuville
Laboratoire de Physique des Minéraux et Magmas CNRS-IPGP, 4 Place Jussieu, 75252, France
Nuclear spent fuel reprocessing generates high level radioactive waste with high Mo concentration that are currently immobilized in borosilicate glass matrices containing both alkali and alkaline-earth elements [1]. Because of its high field strength, Mo6+ ion has a limited solubility in silicate and borosilicate glasses and crystallization of alkali or alkaline-earth molybdates can be observed during melt cooling or heat treatment of glasses [2-4]. Glass composition changes can significantly modify the nature and the relative proportions of molybdate crystals that may form during natural cooling of the melt. For instance, in a previous work we showed that CaMoO4 crystallization tendency increased at the expenses of
Na2MoO4 when B2O3 concentration increased in a SiO2-Na2O-CaO-MoO3 glass composition
[4]. In this study, we present structural results on two series (Mx, By) of quenched glass
samples belonging to this system using 29Si, 11B, 23Na MAS NMR and Raman spectroscopies. The effect of MoO3 on the glassy network structure is studied and its structural role is
discussed (Mx series). The evolution of the distribution of Na+ ions within the borosilicate
network is followed when B2O3 concentration increased (By series) and is discussed according
to the evolution of the crystallization tendency of the melt. For all glasses, ESR was used to investigate the nature and the concentration of paramagnetic species.
GLASS PREPARATION AND CHARACTERIZATION METHODS
Two series of glasses were prepared for this study all derived from the following composition (mol.%): 58.2SiO2 - 13.77Na2O - 9.81CaO - 18.08B2O3 either by increasing MoO3
concentration from 0 to 5.0 (Mx series with x = 0, 0.87, 1.54, 2.50, 3.62 and 5 mol.% MoO3)
or by changing B2O3 concentration from 0 to 24 mol.% (By series with y = 0, 6, 12, 18 and 24
mol.% B2O3) keeping constant MoO3 concentration (2.50 mol.%). For all samples, 0.15
mol.% Nd2O3 was introduced in composition both to facilitate 29Si nuclei relaxation during
MAS NMR experiments and to perform optical studies not presented in this paper [4]. Glasses were all prepared at 1300°C under air in Pt crucibles using reagent grade SiO2, CaCO3,
Na2CO3, H3BO3, MoO3 and Nd2O3 powders. Depending on glass composition, samples were
quenched either as cylinders or disks [4]. Several reference glass samples (borate and silicate glasses) were also prepared for comparison with Mx and By glasses (NMR and Raman
(XRD) and Raman spectroscopy. Unpolarized Raman spectra of monolithic samples were collected with T64000 Jobin-Yvon confocal Raman spectrometer operating at approximately 1.5 W at room temperature with the 488 nm line of an argon ion laser for excitation. 29Si MAS NMR spectra were recorded on a Bruker Avance 300 spectrometer operating at 59.63 MHz. 11B MAS NMR spectra were recorded on a Bruker Avance 400 operating at 128.28 MHz. 23Na MAS NMR spectra were recorded on a Bruker Avance II 500WB spectrometer operating at 132.03 MHz. Chemical shifts were determined relative to tetramethylsilane for
29
Si, liquid BF3OEt2 for 11B and 1.0M aqueous NaCl solution for 23Na. ESR spectra were
recorded on a Bruker ELEXYS E500 spectrometer operating at X band (9.5 GHz) in the range of temperature 20-300 K. For all glasses of Mx and By series, ESR showed the existence of a
signal due to Mo near g~1.91 and that can be detected at least from 20K to room temperature. These ESR characteristics indicated that this signal is due to paramagnetic Mo5+ (4d1) ions located in low symmetry sites. Indeed, the spin-lattice relaxation time of d1 ions is known to increase (and thus the possibility to detect the ESR signal at high temperature also) with the distortion of the sites. This result is in agreement with the paper of Farges et al. [5] which proposed that the ESR signal of Mo in glasses was associated with low symmetry molyddenyl entities. No signal associated with Mo3+ (4d3) ions near g~5.19 was detected on ESR spectra [5]. For instance, at 20K only a low intensity contribution due to Nd3+ and Fe3+ (impurity) ions was detected in the low field region of the spectra. The proportion of Mo5+ ions (over all molybdenum) ranges between 0.4 and 0.8 % for all the glasses studied in this work as estimated using a DPPH sample as concentration standard. Consequently, the majority of molybdenum (> 99%) occurs as Mo6+ ions in glasses of Mx and By series prepared under air
(oxidizing conditions). According to Mo EXAFS and XANES results in silicate glasses and to bond valence-bond length considerations published in literature, Mo6+ ions are present as tetrahedral molybdate entities MoO42- in modifiers rich regions of the glass structure
(depolymerized regions) and are not linked directly to the silicate network [1,5,6].
STRUCTURAL EVOLUTION OF GLASSES WITH INCREASING MoO3 CONCENTRATION
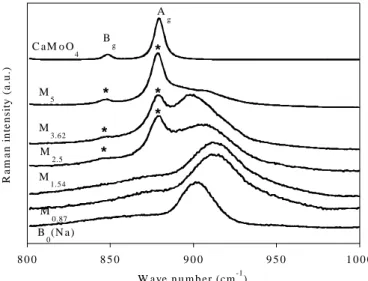
Raman spectra confirm the XRD results presented in [4] showing that the solubilty limit of molybdenum in Mx glasses was reached between 1.54 and 2.5 MoO3 mol.%. Indeed, Fig. 1
clearly reveals the occurrence of the contribution of CaMoO4 (powellite) Raman vibration
modes for x > 1.54 mol.%. For comparison, the Raman spectrum of a powellite ceramic sample is given with the attribution of the bands according to [7]. All the CaMoO4 bands with
frequency 321 cm-1 correspond to internal vibrational modes of MoO42- tetrahedra and the
strongest band at 879 cm-1 can be associated with the symmetric streching vibration of Mo-O bonds. By analogy, we propose that the wide and intense band observed in the 898-913 cm-1 range on the Raman spectra of all glasses of Mx series (and also of the By series) is also due to
the symmetric streching vibration of Mo-O bonds of molybdate tetraedra within the glass structure. Fig. 2 indicates that this band moves towards lower frequencies when x increases (x
2.5) which shows that the environnment and/or the symmetry of MoO42- tetrahedra in the
glass is modified at least when the crystallization of powellite is detected. Comparison of Mx
spectra with the spectrum of a glass without Ca2+ ions and belonging to the SiO2-Na2O-MoO3
system (B0(Na) glass in Fig. 2) seems to indicate that the amount of Na+ ions acting as charge
compensators near MoO42- tetrahedra increases with x at the expenses of Ca2+ ions. This
evolution can be explained by the increase of the Na/Ca ratio in the modifiers-rich regions of the glass structure when powellite is formed. Thus, Raman spectroscopy of glasses containing Mo seems to be more sensisitive than EXAFS to detect local composition variations around MoO42- tetrahedra (and thus symmetry modifications) in the glass structure. Indeed, the Mo
EXAFS results published in literature gave very similar Mo-O distance for different silicate glass compositions (1.76-1.78 Å) [1,5,6].
29
Si MAS NMR spectra were simulated with three bands centered at -80.0, -92.2 and -103.6 ppm respectively associated with Q2, Q3 and Q4 units (Qn units with n = 0 to 4 correspond to
SiO4 tetrahedra with n bridging oxygen atoms). These chemical shift values were kept
constant for the simulation of the spectra of all samples of Mx and By series. An example of
curve-fitting is shown in Fig. 3a and the evolution of the relative proportions [Qn] of Qn units
is shown in Fig. 3b. This evolution reveals that [Q2] and [Q3] decrease whereas [Q4] increases
when molybdenum concentration increases in samples of the Mx series: when MoO3 increases
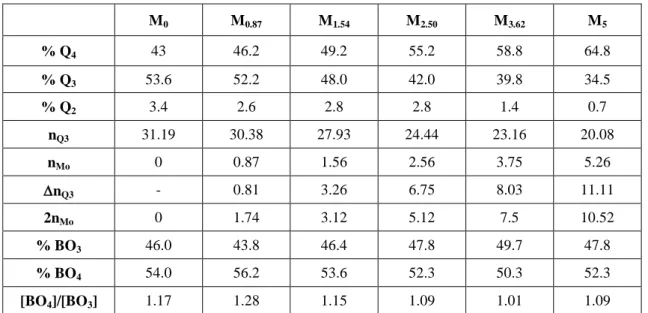
from 0 to 5 mol.%, the proportion of Q4 units increases of more than 20 % (Table 1).
For the Mx series, 11B MAS NMR spectra simulation only shows a slight and
non-monotonous decrease of the relative proportion of BO4- units when molybdenum
concentration increases: the variation of the proportion of BO4- units was only about 2-4 %
(Table 1). Consequently, MoO3 acts as a reticulating agent for the silicate network in Mx
glasses and MoO3 mainly acts on the amount of Q3 units (Table 1). This result can be
explained as follows. As molybdenum is introduced as MoO3 (corresponding to one Mo6+ ion
8 0 0 8 5 0 9 0 0 9 5 0 1 0 0 0 R a m a n i n te n si ty ( a .u .) W ave n u m b er (cm-1) C aM o O 4 M 5 M 3.62 M 2.5 M 1.54 M 0.87 B 0(N a) B g A g * * * * * * 2 0 0 4 0 0 6 0 0 8 0 0 1 0 0 0 1 2 0 0 R a m a n i n te n si ty ( a . u .) W ave n u m b er (cm-1) M 1.54 M 3.62 C aM o O 4 M 2 .5 A g B g E g B g A g B g A g * * * * * *
Fig. 1. Normalized Raman spectra of M1.54, M2.5 and
M3.62 glasses. The Raman spectrum of a CaMoO4
(powellite) ceramic is given for comparison. Spectra were not corrected with the Long formula. *: vibration
bands due to CaMoO4 crystals in Mx samples.
Fig. 2. Normalized Raman spectra of M0.87, M1.54,
M2.5, M3.62 and M5 glasses. The spectra of a CaMoO4
(powellite) ceramic and of sodium silicate glass with
Mo (69.34SiO2 - 28.09Na2O - 2.43MoO3 - 0.15Nd2O3
in mol.%) are given for comparison. *: vibration
bands due to CaMoO4 crystals in Mx samples.
Fig. 3. (a) Example of 29Si MAS NMR
spectra recorded for the M0 sample. The
corresponding simulation using three
Gaussian line shape contributions
associated with Q2, Q3 and Q4 units is
shown (exp: experimental spectrum, sim: simulated spectrum). The same chemical shift values were used for the spectra
simulation of all the samples of Mx and By
series. (b) Evolution of the relative
proportions of Q4, Q3 and Q2 units in Mx
samples with the increase of MoO3
concentration. Linear fits of Qn evolution
are shown. 0 1 0 2 0 3 0 4 0 5 0 6 0 7 0 0 1 2 3 4 5 6 % Q n M o O 3 m o l% Q 4 Q 3 Q 2
M
0Q4 Q3 Q2 exp sim ppm
(b)
(a)
Table 1. Relative proportions of Qn units (n = 2, 3, 4) and (BO3, BO4-) units in Mx samples determined after
simulation and integration of 29Si and 11B MAS-MNR spectra respectively. For a constant number of moles of
SiO2 (58.2 in M0 composition), the number of moles of Mo
6+
ions (nMo) and Q3 units (nQ3) is reported for Mx
samples. The number of moles of Q3 units that disappeared (nQ3) when x increased (in comparison with M0
glass) is also reported.
and 3 non-bridging atoms of oxygen (NBO)) in glass batch whereas Mo6+ ions are known to occur as MoO42- units (corresponding to one Mo6+ ion and 4 NBO) both in glass structure and
powellite crystals, each Mo6+ ion needs to catch one NBO more from the borosilicate network. We thus propose the following reaction scheme between MoO3 and Q3 units
(initially charge compensated by Na+ or Ca2+ ions) in the melt:
MoO3 + (2Q3, Ca2+ or 2Na+) (MoO42-, Ca2+ or 2Na+) + 2Q4 (1)
For a constant number of moles of SiO2 (58.2 in M0 composition), the number of moles of
Mo6+ ions (nMo) and Q3 units (nQ3) was calculated for all Mx samples and is reported in Table
1. The comparison of nQ3 (the number of moles of Q3 units that have disappeared in Mx
sample in comparison with M0 sample) with 2nMo (see equation (1)) shows that the values of
nQ3 and 2nMo remain close to each other when the amount of MoO3 increases in glass
composition which seems to confirm the reaction scheme (1) proposed above.
STRUCTURAL EVOLUTION OF GLASSES WITH INCREASING B2O3 CONCENTRATION
In [4] we showed that Na2MoO4 crystallization tendency during slow cooling of the melt
(1°C/min) decreased with the increase of B2O3 concentration whereas the tendency of
CaMoO4 to crystallize increased. Such as evolution can be explain by the preferential charge
compensation of BO4- units by Na+ rather than by Ca2+ ions in borosilicate glasses [8]. For the
By series, Fig. 4 shows that the [BO4-]/[SiO2] ratio increases whereas [Na+]/[BO4-] decreases
with B2O3 concentration. It is interesting to notice that for the B24 sample almost all Na+ ions
can act as BO4- charge compensator ([Na+]/[BO4-] ~ 1). In these conditions, the amount of
Na+ ions able to compensate the MoO42- entities strongly decreases when B2O3 concentration
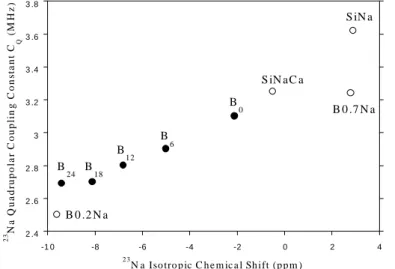
increases and the [Ca2+]/[Na+] ratio in the depolymerized regions of glass structure increases which can explained the evolution of the crystallization tendency. Fig. 5 shows that the isotropic 23Na chemical shift (iso(23Na)) decreases when B2O3 concentration increases. Thus,
the distribution of Na+ ions through the glassy network significantly changes when increasing amounts of boron are introduced in By glasses. Comparison of iso(23Na) of By glasses with
M0 M0.87 M1.54 M2.50 M3.62 M5 % Q4 43 46.2 49.2 55.2 58.8 64.8 % Q3 53.6 52.2 48.0 42.0 39.8 34.5 % Q2 3.4 2.6 2.8 2.8 1.4 0.7 nQ3 31.19 30.38 27.93 24.44 23.16 20.08 nMo 0 0.87 1.56 2.56 3.75 5.26 nQ3 - 0.81 3.26 6.75 8.03 11.11 2nMo 0 1.74 3.12 5.12 7.5 10.52 % BO3 46.0 43.8 46.4 47.8 49.7 47.8 % BO4 54.0 56.2 53.6 52.3 50.3 52.3 [BO4]/[BO3] 1.17 1.28 1.15 1.09 1.01 1.09
that of sodium silicate (SiNa), sodium calcium silicate (SiNaCa) and borate (B0.2Na, B0.7Na) reference glasses clearly reveals that when B2O3 concentration increases, Na+ ions moves
from a charge compensator position near NBO to a charge compensator position near BO4
-units.
In accordance with the XRD results on the By quenched disk samples, Raman spectra show
that the crystallization of CaMoO4 is detected when B2O3 concentration is higher than 12
mol.% (Fig. 6). Contrary to the Raman spectra of the samples of the Mx series, the position of
the band associated with Mo-O streching vibration near 905 cm-1 only slightly evolutes when B2O3 concentration increases which indicates that the environment of MoO42- entities is only
slightly modified. As the depolymerized regions in which are located MoO42- entities become
progressively depleted in sodium when B2O3 concentration increases, the lack of strong
evolution of the M-O vibrationnal frequency could indicate that MoO42- entities are
preferentially charge compensated by Ca2+ ions.
1 G. Calas, M. Le Grand, L. Galoisy, D. Ghaleb, J. Nucl. Mater. 322 (2003) 15.
2 R. J. Short, R. J. Hand, N. C. Hyatt, Mat. Res. Soc. Symp. Proc. 757 (2003) 141.
3
C. Cousi, F. Bart, J. Phallipou, J. Phys. IV France 118 (2004) 79.
4
D. Caurant, O. Majérus, E. Fadel, M. Lenoir, C. Gervais, O. Pinet, J. Am. Ceram. Soc. 90 (2007) 774.
5 F. Farges, R. Siewert, G. E. Brown, A. Guesdon, G. Morin, The Canadian Mineralogist 44 (2006) 731.
6 N. Sawaguchi, T. Yokokawa, K. Kawamura, Phys. Chem. Glasses 37 (1996) 13.
7
E. Sarantopoulou, C. Raptis, S. Ves, D. Christofilos, G. A. Kourouklis, J. Phys. Condens. Matter 14 (2002) 8925.
8 A. Quintas, T. Charpentier, O. Majérus, D. Caurant, J-L. Dussossoy, Appl. Magn. Reson. 32 (2007) 613-634.
2 .4 2 .6 2 .8 3 3 .2 3 .4 3 .6 3 .8 -1 0 -8 -6 -4 -2 0 2 4 23 N a Q u a d ru p o la r C o u p li n g C o n st a n t C Q ( M H z ) 2 3
N a Iso tro p ic C h e m ic a l Sh ift (p p m )
B 0 B 6 B 12 B 18 B 24 S iN a S iN aC a B 0 .7 N a B 0 .2 N a
Fig. 4. Evolution of the [BO4-]/[SiO2] and [Na+]/[BO4-]
ratios versus B2O3 concentration in By samples (mol.%).
The Na+ and SiO2 concentrations were determined by
chemical analysis whereas the BO4
concentration was
determined by chemical analysis and 11B MAS NMR.
Fig. 6. Evolution of Raman spectra of By samples. For
comparison the spectrum of the B0(Na) reference glass
without calcium is also shown. *: vibration bands due
to CaMoO4 crystals in Mx samples.
Fig. 5. Evolution of the 23Na isotropic
chemical shift (iso) and quadrupolar
coupling constant (CQ) in the samples of
By series. For comparison the values of
iso and CQ of reference glasses are also
shown: SiNa (80.93SiO2 - 19.07Na2O),
SiNaCa (71.21SiO2-16.78Na2O-12CaO),
B0.7Na (58.8B2O3-41.2Na2O), B0.2Na
(83.3B2O3-16.7Na2O). For the three
former reference glasses Na+ ions can
compensate NBO whereas in the later
one Na+ ions only compensate bridging
oxygen atoms near BO4- units.
8 0 0 8 5 0 9 0 0 9 5 0 1 0 0 0 R a m a n i n te n si ty ( a .u .) W ave n u m b er (cm-1) B 0 B 0(N a ) B 6 B 1 2 B 1 8 B 2 4 * * * * -0 .1 0 0 .1 0 .2 0 .3 0 .4 0 .5 1 1 .5 2 2 .5 3 3 .5 4 4 .5 5 0 5 1 0 1 5 2 0 2 5 3 0 [B O 4 - ]/ [S iO 2 ] [Na + ]/ [B O 4 -] B 2O3 c o n c e n tra tio n (m o l.% ) [N a+]/[B O 4 -] [B O 4 -]/[SiO 2]