HAL Id: hal-01617059
https://hal.archives-ouvertes.fr/hal-01617059
Submitted on 21 Aug 2020
HAL is a multi-disciplinary open access
archive for the deposit and dissemination of
sci-entific research documents, whether they are
pub-lished or not. The documents may come from
teaching and research institutions in France or
abroad, or from public or private research centers.
L’archive ouverte pluridisciplinaire HAL, est
destinée au dépôt et à la diffusion de documents
scientifiques de niveau recherche, publiés ou non,
émanant des établissements d’enseignement et de
recherche français ou étrangers, des laboratoires
publics ou privés.
parameters using Sun photometry
P. Sellitto, G. Salerno, A. La Spina, T. Caltabiano, L. Terray, P. Gauthier, P.
Briole
To cite this version:
P. Sellitto, G. Salerno, A. La Spina, T. Caltabiano, L. Terray, et al.. A novel methodology to
de-termine volcanic aerosols optical properties in the UV and NIR and Ångström parameters using Sun
photometry. Journal of Geophysical Research: Atmospheres, American Geophysical Union, 2017, 122
(18), pp.9803-9815. �10.1002/2017JD026723�. �hal-01617059�
A novel methodology to determine volcanic aerosols
optical properties in the UV and NIR and Ångström
parameters using Sun photometry
P. Sellitto1 , G. Salerno2 , A. La Spina2 , T. Caltabiano2 , L. Terray3 , P.-J. Gauthier3,
and P. Briole4
1Laboratoire de Météorologie Dynamique, Institut Pierre Simon Laplace, École Normale Supérieure, PSL Research University, École Polytechnique, Université Paris-Saclay, Sorbonne Université, UPMC Université Paris 6, CNRS, Paris, France, 2Istituto Nazionale di Geofisica e Vulcanologia, Osservatorio Etneo, Catania, Italy,3Laboratoire Magmas et Volcans, Université Blaise Pascal-CNRS-IRD, Observatoire de Physique du Globe de Clermont-Ferrand, Aubière, France,4Laboratoire de Géologie de l’École Normale Supérieure, Paris, France
Abstract
Remote volcanic aerosol optical depth (AOD) observations of Mount Etna summit and distal bulk plume have been carried out between 14 and 20 July 2016 in the framework of the EPL-RADIO project. Ultraviolet (UV) and near-infrared (NIR) AODs were measured using a Microtops-II Ozone Monitor (MIIOM) Sun photometer, using a Langley plot (LP) instrumental calibration routine. Ozone-corrected UV AODs at 320 nm are derived for the first time with a Microtops, thus extending the exploitable spectral band range of portable photometers to shorter wavelengths. The new UV AODs have theoretical uncertainties< ±0.035 (±12%), dominated by LP calibration errors. Using UV and NIR AODs, the Ångström coefficients
have been derived. The UV AODs and Ångström exponents have been compared, at background conditions, to colocated Cimel Sun photometer observations. A root-mean-square deviation of 0.03 (13%) for
the UV AOD is found for this comparison, thus in agreement with estimated theoretical uncertainties. The MIIOM Ångström exponent estimations are found consistent with Cimel observations, even if with an average overestimation of 17.5%, mainly due to negative biases (−0.02/−21%) of NIR AODs. Results of quasi-simultaneous characterization of proximal and distal plume (7 km from craters), for 20 July 2016, are shown. During the measurements, brownish ash puffs were visible. While proximal and distal plumes were observed within approximately 1 h, their Ångström exponent varied significantly (mean values: −0.30±0.22 and 1.16±0.33, for the proximal and distal plumes). These results indicate quick sedimentation of ash particles and show the potential of this new retrieval technique to characterize volcanic aerosols.
Plain Language Summary
This paper discusses a new technique to better identify the different particles emitted by a volcano, using very small instruments that can be easily transported (in a small backpack) to a volcano summit. Usually, this is done with big and heavy instruments but it is hard to bring them on a volcano summit, and that is why we study new techniques to better use small portable instruments. This new methodology is applied during a measurement campaign at Etna volcano, carried out between 14 and 20 July 2016. These measurements with small, transportable instruments allowed understanding how bigger ash particles cannot be transported by the winds, once they are emitted by Etna, for longer times than a few minutes and have an impact only for a small region (a few kilometers) around the craters, at least for this specific period of measurements and activity of Etna volcano. On the contrary, small liquid acid particles formed by the condensation of volcanic gas emissions are detected at larger distances and can have an impact on climate (in the case of Etna, up to hundreds of kilometers, well into the Mediterranean basin).1. Introduction
Volcanic emissions consist of both gases and particles. Sulphur-bearing gas species, mainly SO2and H2S, are rapidly converted to tiny liquid secondary sulphate aerosols (SSA) by gas and aqueous phase oxidation and subsequent nucleation and accumulation of droplets [e.g., Lamb, 1970; McCormick et al., 1995]. Ash particles have, usually, a shorter lifetime than SSA, due to their bigger mean size and relatively rapid sedimentation processes [Sellitto et al., 2016]. The typical spatial scales of their dispersion is, subsequently, smaller than for
RESEARCH ARTICLE
10.1002/2017JD026723
Key Points:
• Microtops-II Ozone Monitor is used for the first time to determine ozone-corrected UV (320 nm) volcanic AOD and UV/NIR Ångström parameters
• The new volcanic aerosol products have limited random and systematic uncertainties and compare well with colocated Cimel observations • Mount Etna distal and proximal
plumes are characterized and discussed
Correspondence to:
P. Sellitto, psellitto@lmd.ens.fr
Citation:
Sellitto, P., G. Salerno, A. La Spina, T. Caltabiano, L. Terray, P.-J. Gauthier, and P. Briole (2017), A novel methodology to determine volcanic aerosols optical properties in the UV and NIR and Ångström parameters using Sun photometry,
J. Geophys. Res. Atmos., 122,
9803–9815, doi:10.1002/ 2017JD026723.
Received 1 MAR 2017 Accepted 5 AUG 2017
Accepted article online 10 AUG 2017 Published online 18 SEP 2017
©2017. American Geophysical Union. All Rights Reserved.
sulphate aerosols, even if fine ash particles can be transported up to several hundred kilometer distance for strong explosive eruptions [Kristiansen et al., 2015]. Volcanic aerosols, and in particular the long-lived sul-phate aerosol, have the potential to perturb the tropospheric and stratospheric composition [von Glasow et al., 2009]. Depending on their chemical and microphysical properties, these particles can affect the distribution and optical properties of both low and high clouds [e.g., Durant et al., 2008; Campbell et al., 2012], the Earth radiation budget from regional to global scale, and, consequently, climate [Robock and Oppenheimer, 2003]. In addition, volcanic aerosol properties provide indirect, proxy information of magma-degassing processes, which are virtually impossible to observe directly [Mather et al., 2013].
While the stratospheric aerosol layer perturbations from high VEI (Volcanic Explosive Index) eruptions is relatively well known [e.g., Newhall and Self , 2013; LeGrande et al., 2016], the processes and impacts on tropo-spheric composition and radiative transfer of the more frequent weak volcanic activity is still largely unknown. One important factor governing the radiative forcing of the preponderant sulphate aerosols in volcanic plumes is the microphysical characterization (e.g., mean size) of the particles [e.g., Sellitto and Briole, 2015;
Sellitto et al., 2016].
In this study, we report and discuss a new retrieval methodology to derive ultraviolet (UV) and near-infrared (NIR) volcanic aerosol optical depth (AOD) using a Microtops-II Ozone Monitor Sun photometer (hereafter referred to as MIIOM). Specifically, using Langley plot calibration routines and ozone absorption corrections, with a similar algorithm as the one developed by Sellitto et al. [2006], UV AODs at wavelengths as low as 320 nm are derived for the first time with a portable photometer. This allows the extension of aerosol optical proper-ties observations in challenging logistical situations, such as volcanic terrain, to a larger spectral range. Shorter wavelengths have an enhanced sensitivity to smaller particles, which is potentially crucial to gather detailed information on very small secondary aerosols, like volcanic SSAs. Direct Sun radiance near and underneath Mount Etna’s bulk plume was collected in July 2016, during a dedicated campaign (section 2). Mount Etna is an ideal location to test the methodology, because of its accessibility, the availability of complementary observations of volcanic effluents and geophysical parameters, and due to its persistent emission of particles and sulphur-containing gaseous precursors [Graf et al., 1997]. Spectral extinction information was further used to characterize the Etnean plume in terms of the Ångström coefficients, which is an optical proxy for the microphysical characterization of the plume (mean size and burden). The derivation of AOD information in the UV with a MIIOM had been previously proposed by Gómez-Amo et al. [2009] but, here, we develop for the first time a complete theoretical framework for volcanic plumes, including theoretical uncertainties estima-tion (secestima-tion 3). This new method is further applied to the case of Mount Etna (secestima-tion 4) and compared with colocated AErosol RObotic NETwork (AERONET) Cimel observations (section 5) before conclusions on the use of MIIOM to monitor volcanic plumes are drawn in section 6.
2. The EPL-RADIO Campaign C2
The EU-funded project EPL-RADIO (Etna Plume Lab-Radioactive Aerosols and other source parameters for better atmospheric Dispersion and Impact estimatiOns) aims to advance the understanding of Mount Etna as an atmospheric aerosols source, targeting emission processes, from inner degassing mechanisms to aerosol near-source characterization. A detailed size-resolved physicochemical characterization of the emit-ted aerosols is targeemit-ted, using a multidisciplinary approach, with the ultimate goal of constraining the regional climatic impacts of Mount Etna in the Mediterranean area [Sellitto, 2016; Sellitto et al., 2017a].
In this framework, the campaign EPL-RADIO C2 (second campaign out of four) took place from 14 to 20 July 2016. During this period following a major paroxysm at Mount Etna’s central craters in May 2016, eruptive activity was mostly characterized by passive degassing at the summit craters accompanied by mild to stronger explosions at the New South-East Crater (NSEC) that gave rise to brownish-reddish ash-rich plumes. Data obtained during the campaign C2, a subset of which is presented in this paper, were collected at various sampling sites located at short to middle distance from the active summit area (Figure 1)
During the campaign, the atmospheric conditions were favorable, with mostly cloud-free conditions. The pos-sible presence of localized clouds, which can form and dissipate at short time scales, e.g., at the summit area of Mount Etna, was checked by visual inspection during the measurements, and the corresponding observations are excluded from the subsequent analyses.
Figure 1. Map of Mount Etna with the locations of the EPL-RADIO C2 MIIOM observations discussed in the present paper
(A: Langley plot calibration—14, 15, and 18 July 2016; B and C: proximal and distal plume observations—20 July 2016).
3. Instruments and Methods
3.1. The Microtops-II Ozone Monitor Sun photometer
The MIIOM portable Sun photometer measures direct Sun radiance (2.5∘ field of view) in three channels in the UV (Ch. 1: 305.5±0.3, Ch. 2: 312.5±0.3, and Ch. 3: 320.5±0.3 nm, with nominal full width at half maximum (FWHM) of 2.4±0.4 nm) and two channels in the NIR (Ch. 4: 936.0±1.5 and Ch. 5: 1020.0±1.5 nm, with nominal FWHM of 10.0±1.5 nm) [Morys et al., 2001a, 2001b]. The UV channels are used to measure the ozone vertical content [Gómez-Amo et al., 2012]. The NIR Ch. 4 is used to derive water vapor vertical content; the NIR Ch. 5 is in an atmospheric window and is used to derive the NIR AOD. The instrument used in the present study has been precalibrated with a Langley method at Mauna Loa Observatory, Hawaii, in July 2014. The Sun-pointing alignment is performed manually, with the aid of a Sun target window which projects the Sun position with respect of the input optics. Due to the portability of MIIOM (about 600 g weight), it is very well adapted for fieldwork in remote areas, like volcano summits.
3.2. Aerosol Optical Depth Retrieval in the UV and the NIR Spectral Bands
For each of the five MIIOM channels, the measured voltage signal SIG(𝜆), proportional to the direct Sun radiance at the ground, can be related to the total atmospheric optical depth𝜏tot(𝜆) by means of the
Beer-Bouger-Lambert law:
SIG(𝜆) = V0(𝜆)e−m𝜏tot(𝜆) (1)
In equation (1), V0(𝜆) is the extraterrestrial solar voltage, proportional to the Earth-Sun distance-corrected solar irradiance at the wavelength𝜆, and m is the air mass factor. The total spectral atmospheric optical depth
𝜏totis the sum of the aerosol optical depth AOD(𝜆) (accounting for absorption and scattering by aerosol
par-ticles in the line of sight), the optical depth due to molecular scattering (described by the Rayleigh scattering theory)𝜏Ray(𝜆) and to absorption by the active gases in the considered spectral band 𝜏Abs(𝜆):
𝜏tot(𝜆) = AOD(𝜆) + 𝜏Ray(𝜆) + 𝜏Abs(𝜆) (2)
Then, the AOD can be calculated for each band as follows: AOD(𝜆) = 1
m
[
ln V0(𝜆) − ln SIG(𝜆)]−𝜏Ray−𝜏Abs(𝜆) (3)
by considering the absorption by the active species at the selected band and the Rayleigh optical depth, calculated with the Hansen and Travis formula [Bodhaine et al., 1999].
Table 1. Error Sources From Equation (6) for the MIIOM AODs at the Three UV Channels Channel 1 2 3 Wavelength (nm) 305.5 312.5 320.5 ΔLP ±0.02 ±0.02 ±0.02 ΔSIG ±0.038 ±0.018 ±0.006 Δ𝜏Ray ±0.011 ±0.010 ±0.009 Δ𝜏O3 ±0.06 ±0.03 ±0.01 ΔTot ±0.075 ±0.042 ±0.025 ΔTot (%) ±23.5 ±13.5 ±8.3
The UV channels 1, 2, and 3 are sensitive to the ozone absorption. Thus, in the UV, in equation (2)𝜏abs(𝜆) =
𝜏O3(𝜆), and then AOD(Ch. 1,2,3) = 1 m [ ln V0(Ch. 1,2,3) − ln SIG(Ch. 1,2,3) ] −𝜏Ray(Ch. 1,2,3) − [O3]∕1000⋅ kO 3(Ch. 1,2,3) (4)
In equation (4), [O3] is the columnar abundance of ozone in Dobson units and kO3(𝜆) is the ozone absorption
coefficient at the wavelength𝜆, from Bass and Paur [1985]. As [O3] is automatically calculated by MIIOM at
each scan, the UV AOD can be derived by correcting for this ozone effect and using a determination of ln V0,
e.g., with a Langley plot (LP) calibration routine (see section 4.1).
The uncertainty associated with an estimation of the UV AOD can be expressed as follows:
𝜎AOD(Ch. 1,2,3)= √ √ √ √ 1 m [ 𝜎2 ln V0(Ch. 1,2,3)+ ( 𝜎SIG(Ch. 1,2,3) SIG(Ch. 1,2,3) )2] +𝜎2 𝜏Ray(Ch. 1,2,3)+ ( 𝜏O3(Ch. 1,2,3) [O3] 𝜎O3 )2 (5) and, schematically ΔTot = √ ΔLP2+ ΔSIG2+ Δ𝜏2 Ray+ Δ𝜏 2 O3. (6)
In order to evaluate the theoretical uncertainties of UV AOD retrievals with MIIOM, we now discuss the indi-vidual error components in equation (6). The four error terms, as well as the total error ΔTot (absolute and percent), are summarized in Table 1 for the three UV channels. In addition, typical reference optical depths (total, Rayleigh, ozone, and aerosols) are summarized in Table 2. The term ΔLP is the uncertainty related to the LP estimations of extraterrestrial solar voltage. This term depends on how accurate the calibration routines are. In our case (see section 4.1), extraterrestrial voltages from individual LP are obtained with an uncertainty lower than 1.0% (standard deviation of the intercept in LPs regressions), for all UV channels. Correspondingly, this transfers an uncertainty lower than ±0.02 on the AOD (two standard deviations). This is consistent with
Table 2. Typical Total, Rayleigh, Ozone, and Aerosol Optical Depths at
the Three UV Channels of MIIOM
Channel 1 2 3 Wavelength (nm) 305.5 312.5 320.5 Totala 2.043 1.588 1.299 Rayleighb 1.111 1.003 0.902 Ozonec 0.615 0.276 0.096 Aerosolsd 0.318 0.310 0.302 Aerosols (%) 15.5 19.5 23.2
aAverage value for measurements taken on 20 July.
bCalculated with pressure-corrected Hansen and Travis formula. cCalculated with a reference value of [O
3] = 320 DU. dAverage value for measurements taken on 20 July.
results obtained by Porter et al. [2001]. As discussed by Porter et al. [2001] and Sellitto et al. [2006], this error source might be reduced by averaging many LP extrapolations obtained at similar conditions. The second term is the measured signal error, which is mostly dependent on pointing errors and electronic noise [Porter et al., 2001]. This error can be mitigated through the use of a tripod, allowing direct Sun measure-ments to be obtained from a fixed platform. This procedure reduces Sun-pointing errors to about ±0.25% [Morys et al., 2001b]. Dealing with discrete photon counts, the electronic noise can be described by Poisson statistics [Sellitto et al., 2006]. The associated error is only significant when a low number of photon counts occurs, e.g., with high solar zenith angles and/or at shorter wavelengths. During our campaign, measurements are mostly taken at small solar zenith angles. Channel 3 has signals up to 3 times higher than Ch. 1 and up to 2 times higher than Ch. 2. We estimated this error to ±0.004, at most, at Ch. 3 and quadratically increasing, as for the Poisson statistics, for Ch. 2 (±0.016) and Ch. 1 (±0.036). This sums up to pointing errors (±0.0025) to produce total signal errors ΔSIG of ±0.006, ±0.018, and ±0.038, respectively. The third term is the error in the Rayleigh optical depth estimation, which, for surface pressure-corrected calculation with the Hansen and Travis formula, has been estimated to 1.1% [Teillet, 1990]. At the three UV channels,𝜏Rayis about 1.111 (Ch. 1), 1.003 (Ch. 2), and 0.902 (Ch. 3), see Table 2. Then it transfers an error of ±0.011, ±0.010, and ±0.009 to three channels, respectively. The fourth term is the error in the ozone optical depth. This error source can be quantified by knowing the uncertainties of MIIOM ozone retrievals𝜎O3. By comparing MIIOM with Brewer
spectrophotometer ozone retrievals, errors of a few percent have been found [Gómez-Amo et al., 2012]. By con-sidering a conservative value of ±10% for𝜎O3∕[O3] and an ozone optical depth of about 0.62, 0.28, and 0.10
at Ch. 1, Ch. 2, and Ch. 3, respectively (see Table 2), the ozone absorption contribution to MIIOM AOD uncer-tainties is about ±0.06, ±0.03, and ±0.01. Summing up the four individual error sources in equation (6), we estimate the total UV AOD uncertainties to be about ±0.075 (±23.5%), ±0.042 (±13.5%), and ±0.025 (±8.3%), for the three UV channels. From these results, it appears that Ch. 1 and Ch. 2 are significantly affected by both ozone and measured signal uncertainties, and their use is not recommended. These two error components are strongly mitigated for Ch. 3 (320 nm). In this case, a theoretical error content lower than ±0.025, dominated by calibration-related uncertainties, is found. This error is comparable with visible and NIR AOD uncertainties, e.g., for Microtops-II Sun photometer (MIISP) model [Porter et al., 2001; Knobelspiesse et al., 2003]. Therefore, this channel is used in the subsequent analyses. It is important to notice that the AOD in this channel elevates to about 25% of the total optical depth, at the conditions of measurement presented in this paper (see Table 2). The signal is much weaker at Ch. 1 and Ch. 2. The values reported in Table 2 are consistent with what found in the past, e.g., by Brogniez et al. [2008] (see Figure 1 of this latter paper).
The NIR channel 5 is in an atmospheric window (no active absorbing species), so: AOD(Ch.5) = 1
m
[
ln V0(Ch.5) − ln SIG(Ch.5)]−𝜏Ray(Ch.5) (7) The NIR UV can then be derived using a determination of ln V0. The uncertainties associated to NIR AOD can
be derived from equation (6), where only the first two terms are considered (negligible Rayleigh and ozone optical depth in this channel). Correspondingly, we estimate this uncertainty to less than ±0.02, consistently to existing what available from literature, e.g., by Porter et al. [2001]. This value is dependent on the quality of LP calibration procedure. It has to be mentioned that MIIOM calculates automatically the NIR AOD (Ch. 5, 1020 nm) at each scan, using its internal precalibration.
When the line of sight of a direct Sun observation traverses a volcanic plume, its AOD is composed of the optical depth of the plume AODpand the background optical depth AODb:
AODp(𝜆) = AOD(𝜆) − AODb(𝜆) (8)
Then, AODpcan be derived by atmospheric correction of the observed AOD(𝜆), i.e., by subtracting a
deter-mination of the background optical depth, with the assumption that the atmosphere remains homogeneous between background and plume observations and that the clear atmosphere aerosol optical depth in the volume occupied by the plume is negligible with respect to AODb. To ensure that this assumption is respected,
the background observations must be performed not far in space and time from the corresponding plume observations.
In the present work, AODpis obtained by subtracting a fixed average AODb(𝜆), obtained with a series of tens
a few kilometers and half an hour) with respect to in-plume AOD observations. The standard deviation of the in-plume AOD𝜎AODpis then
𝜎AODp(𝜆) = √ 𝜎2 AOD+ 𝜎AODi b n 2 (9)
with n the number of individual background measurements AODibmade to compute the average background. The standard deviation of an in-plume observation is then approximately the same𝜎AODof equation (6) (about
±0.025 in the UV and about ±0.020 in the NIR).
It must be noticed that in-plume AOD measurements in the UV are affected by a systematic error related to the UV absorption by volcanic sulphur dioxide (SO2) emissions (radiatively active in the UV). The SO2
absorp-tion is not taken into account in the present work. Nevertheless, typical amounts of SO2at Etna in passively
degassing conditions (about 10 Dobson Units, based on the decadal series of SO2flux measurements
dis-cussed by, e.g., Sellitto et al. [2017b]) produce an optical depth of about 0.01 at 320 nm (where SO2to ozone absorption coefficient ratio is about 2.8 [Bogumil et al., 2003]). This uncertainty, added to the random errors of less than ±0.025 at this wavelength, produces the moderate total uncertainties of less than ±0.035 (about ±11.5%). A correction for SO2absorption is possible if its concentration is simultaneously measured, e.g., with a dedicated UV spectrometer, during Microtops acquisitions. This correction is necessary in cases of high SO2
burdens, e.g., during eruptive events.
3.3. Ångström Parameters Derivation With UV and NIR AODs
The spectral variability of the AOD(𝜆) can be represented using the empirical Ångström law [Angström, 1964], as a function of the two Ångström parameters𝛼 and 𝛽. For the in-plume AOD determinations
AODp(𝜆) = 𝛽p𝜆−𝛼p (10)
The parameter𝛼 is the negative spectral slope of the AOD in log-log scale and is related to the mean size of the particles, with lower values (down to approximately −0.3) for bigger particles and higher values (up to approximately 2.5) for smaller particles [van de Hulst, 1957]. The parameter𝛽 represents the AOD value at 1.0 μm and then depends on the amount of particles and their chemical composition via refractive index. Practically, in this study, the Ångström parameters𝛼pand𝛽pare derived using the UV and NIR AODs. Among the available UV bands, Ch.3 is selected due to the reduced uncertainties associated with ozone absorption and signal noise previously discussed, leading to smaller total uncertainties (see Table 1). In the NIR range, Ch. 5 is selected to avoid water vapor absorption contamination at Ch. 4.
𝛼p= − ln[AODp(Ch.3) AODp(Ch.5) ] ln[𝜆(Ch.3)𝜆(Ch.5)] = a ⋅ ln [AOD p(Ch.3) AODp(Ch.5) ] (11) 𝛽p= AODp(Ch.3) ⋅ 𝜆(Ch.3)𝛼p (12) In equation (11): a = −1∕ ln[𝜆(Ch.3)𝜆(Ch.5)].
The uncertainties of the derived𝛼pand𝛽pcan be expressed as follows:
𝜎𝛼p=|a| √( 𝜎AODp(Ch.3) AODp(Ch.3) )2 +( 𝜎AODp(Ch.5) AODp(Ch.5) )2 (13) 𝜎𝛽p=𝜆(Ch.3) 𝛼√𝜎2 AODp(Ch.3)+ ( AODp(Ch.3) ⋅ ln 𝜆(Ch.3) )2 𝜎2 𝛼p (14)
With the uncertainties on UV and NIR AODs derived in section 3.2 and typical values of 0.3 for the UV AODs,
𝜎𝛼p and𝜎𝛽pare estimated to about ±0.2 (±15%) and ±0.015 (±15%), for smaller particles, and about ±0.15 (±30%) and ±0.045 (±25%) for bigger particles. The uncertainty𝜎𝛼p critically depends on the AOD values
(see equation (13);𝜎𝛼pand, then,𝜎𝛽pare bigger for smaller AODs, reaching values bigger than ±0.50 for𝜎𝛼p, for small AODs (lower than 0.15) and bigger particles. Even if these uncertainties are significant, it should be noted that uncertainties on𝛼pestimations can reach values as high as ±0.50, at small AODs, also for less portable, more established instruments, like the Cimel Sun photometer [di Sarra et al., 2015; Sellitto et al., 2017b].
3.4. On the Use of UV Optical Information to Characterize Volcanic Plumes
The optical parameters of volcanic plumes have been observed in the past with portable Sun photometers [e.g., Watson and Oppenheimer, 2000, 2001; Porter et al., 2002; Mather et al., 2004; Martin et al., 2009]. Normally, observations are taken in the visible and NIR spectral ranges, to avoid the absorption of active gaseous species, e.g., with a Microtops-II Sun photometer (MIISP: five channels at 440, 675, 870, 936 and 1020 nm) [e.g., Mather
et al., 2004]. Porter et al. [2002] used a Microtops with a UV channel at 380 nm. Following Mie theory [e.g., van de Hulst, 1957], the ozone-corrected UV AOD at 320 nm observed with MIIOM is potentially more sensitive to
very small particles, like freshly nucleated sulphate droplets, than the visible or NIR AODs obtained with MIISP and the 380 nm channel of Porter et al. [2002].
In addition, the Ångström parameters have been derived by spectral fitting of the MIISP visible and NIR AODs, in previous works [e.g., Mather et al., 2004]. Nevertheless, the Ångström parameters are wavelength depen-dent, and a wavelength-pair approach, as for equations (11) and (12), thus measuring band-average Ångström parameters, is to be preferred. In this case, the use of UV AOD, combined with a NIR AOD information, potentially decreases the uncertainty content of𝛼pand𝛽p, with respect to the use of visible/NIR AOD pairs. As a simplified example, we can compare the uncertainties of 𝛼p (equation (13)), using (a) UV plus NIR (for MIIOM: 320 and 1020 nm) AODs and (b) the shortest-wavelength visible plus NIR (for MIISP: 440 and 1020 nm) AODs. It has been shown that the MIIOM AOD uncertainty𝜎AODat 320 nm is about 0.035 (considering
the systematic overestimation caused by neglecting volcanic SO2). In our case (a), the uncertainty on the
shorter wavelength is then 75% bigger than in case (b), (the AOD uncertainty at 440 nm is 0.020). It can be seen that the𝛼puncertainty is reduced in (a) with respect to (b) for two reasons: (1) the factor a is reduced by about 35% and (2) the contribution of the shorter wavelength under square root is reduced proportion-ally to the increase of the AOD as wavelength decreases, following the Ångström law (equation (10))—from ∼ 90 (𝛼pof 2.0) to ∼ 15% (𝛼pof 0.0). So, finally, the uncertainty𝜎𝛼pis reduced of ∼ 50% (𝛼pof 2.0) to ∼ 15% (𝛼pof 1.0), when smaller particles are sampled, for case (a) with respect to case (b). It must be noted that in this work, we use the longer UV wavelength available in MIIOM (320 nm) to reduce the uncertainties on UV AOD com-ing from the ozone absorption and from the raw observed signal SIG(𝜆), as described by Sellitto et al. [2006]. Therefore, even if visible AOD uncertainties are expected to be smaller with respect to UV AOD uncertainties, the latter remains as small as possible by the critical choice of the UV channel among those available in MIIOM (see Table 1).
The benefits of using a spectral interval as large as possible when deriving size distribution information from photometric observations are also discussed by [Porter et al., 2002] (with reference to discussion of Figure 2 of this latter paper).
The previous discussion indicates that the acquisition of UV extinction information is beneficial toward the characterization of volcanic plumes in terms of their optical/microphysical properties.
4. Results and Plume Characterization
4.1. Langley Plot CalibrationThe extraterrestrial solar voltage is required to retrieve the AOD from direct Sun photometric observations, as apparent from equations (4) and (7). An estimation of V0can be obtained using a LP calibration routine [e.g., Watson and Oppenheimer, 2000; Sellitto et al., 2006]. From equation (1), it can be seen that the natural logarithm of the measured ground signal varies linearly with respect to the air mass factor:
lnSIG(𝜆) = ln V0(𝜆) − m𝜏tot (15)
This allows an estimate of ln V0(𝜆) for each half-day measurement sessions by linear regression, as exemplified
in Figure 2a for 15 July (A.M. and P.M.).
During the EPL-RADIO campaign C2, we carried out four LPs, for 14 (A.M.), 15 (A.M.), 15 (P.M.), and 18 July (A.M.) at location A (see Figure 1). Values of ln V0(𝜆) and associated variabilities are given in Table 3. Individual
Figure 2. (a) Langley plots for 15 July (A.M.) (individual points, small
vertical lines; regression, continuous line) and (P.M.) (individual points, small horizontal lines; regression, dotted line) for the five MIIOM channels. (b) Spectral variability ofln V0(𝜆)for the different LPs obtained during the campaign (grey crosses and dotted lines) and their average (black dots and solid line).
linear regression of, e.g., Figure 2a). The standard deviation of ln V0 ensemble
(variability of ln V0) varies between 0.30
(at 320.5 nm) and 0.81% (at 305.0 nm), with maximum deviations between 1.39 (at 320.5 nm) and 3.55% (at 305.0 nm). This highlights the remarkable stability of the calibration constant for the four LP. The variability of the spectral ln V0
and their mean values are also shown in Figure 2b. Channel 3 is character-ized by the best stability of the derived ln V0(𝜆), among all the available chan-nels, thus reinforcing our considerations of section 3.4.
The consistency of the external and internal calibration can be tested using MIIOM Ch. 5. For this channel, the AOD is calculated by MIIOM with its inter-nal calibration. AODs obtained using equation (7) and the external LP cali-bration constant ln V0can then be com-pared with the AOD calculated by MIIOM with internal calibration. An example of this comparison is shown in Figure 3, for 15 July. The very high Pearson correla-tion constant (R2= 0.996) and the almost
one-to-one regression line (slope: 1.002, intercept: 0.003) demonstrate the con-sistency of the LP calibration carried out during this campaign.
4.2. UV and NIR AOD Observations and Ångström Parameters Determination
The plume-isolated Ångström coefficients𝛼pand𝛽phave been previously measured at Mount Etna [Watson
and Oppenheimer, 2000, 2001], Kilauea [Porter et al., 2002], Masaya [Martin et al., 2009], Lascar, and Villarica
volcanoes [Mather et al., 2004]. A summary of these measurements are reported in Table 4, along with the instruments used and their operational spectral interval. Smaller𝛼pvalues and higher𝛽pvalues are found for ash-bearing plumes with respect to ash-free plumes. For ash-bearing plumes, (a)𝛼pvalues between −0.2 and 0.2 at Mount Etna [Watson and Oppenheimer, 2001] and smaller than 0.3 at Lascar [Mather et al., 2004], and (b)
𝛽pvalues between 0.16 and 0.65 at Mount Etna [Watson and Oppenheimer, 2001] and between 0.04 and 0.10 at Lascar [Mather et al., 2004]) are observed. For ash-free plumes, (a)𝛼pvalues between 0.2 and 2.5 at Mount Etna [Watson and Oppenheimer, 2000, 2001] and between 0.3 and 2.8 at Lascar and Villarica [Mather et al., 2004],
Table 3. Individualln V0(𝜆), for the Different LPs Obtained During the Campaign, Average, Standard Deviation (Absolute and Percent), and Percent Maximum Deviation, for the Five MIIOM Channels
Channel Wavelength (nm) Ch. 1: 305.0 Ch. 2: 312.5 Ch. 3: 320.5 Ch. 4: 936.0 Ch.5: 1020.0 14/07 (A.M.) - Ln V0 9.05 8.02 7.88 6.83 7.29 15/07 (A.M.) - Ln V0 9.01 8.06 7.93 7.03 7.09 15/07 (P.M.) - Ln V0 8.74 7.94 7.85 6.98 7.12 18/07 (A.M.) - Ln V0 8.85 7.93 7.82 6.93 7.06 Mean 8.91 7.99 7.87 6.94 7.14 Standard deviation 0.07 0.03 0.02 0.04 0.05 Standard deviation (%) 0.81 0.39 0.30 0.61 0.72 Maximum deviation (%) 3.55 1.61 1.39 2.84 3.16
Figure 3. Recalculated AOD at 1020 nm, after LP calibration, versus
coincident AODs calculated by MIIOM with internal calibration. The regression line equation and correlation coefficient are reported in the plot. The data are for 15 July (P.M.).
and (b) 𝛽p values between 0.001 and 0.150 at Mount Etna [Watson and
Oppenheimer, 2000, 2001] and typically
between 0.001 and 0.007 at Villarica and Lascar [Mather et al., 2004]) are observed. Figure 4a shows the UV and NIR AOD observations and Figure 4b the corre-sponding 𝛼p and 𝛽p observations, for measurements at sites B and C of Figure 1, for 20 July. The AOD spectral variability varied significantly between the two measurement sessions (9:30–10:00 UTC at site B: Torre del Filosofo area, ∼3000 m altitude, a few hundred meters from the summit craters; 10:45–11:15 UTC at site C: Serra La Nave area, ∼1800 m altitude, about 7 km from the summit craters). During observations at both sites B and C, visible brown ash puffs were emitted by the NSEC. The ash puffs were probably locally injecting big sized ash particles. These particles were most likely in the line of sight of MIIOM during the session at site B. This is reflected by the larger retrieved AOD in the NIR than in the UV (UV AOD ranging from 0.01 to 0.17, mean value of 0.060±0.036; NIR AOD ranging from 0.03 to 0.20, mean value of 0.084±0.046) and the consequent negative𝛼p(ranging from about −0.5 to about 0.1, with mean value of −0.30±0.22). Negative 𝛼 values are associated with extremely big ash particles (effective radii reaching values as high as 2.0 μm, see the case for Etna’s North East crater observations in Figure 3 of [Watson and Oppenheimer, 2001] and the inher-ent discussion). This result is consistinher-ent with the visual observation of relatively thick ash emissions during our observations at site B. These𝛼pestimations are comparable with previous estimations of Watson and
Oppenheimer [2000, 2001]; Mather et al. [2004], for ash-bearing plumes. The values of𝛽pat site B are between 0.02 and 0.20, with mean value of 0.08±0.05. These values are more comparable to the ash-bearing plume observed at Lascar [Mather et al., 2004] than Mount Etna [Watson and Oppenheimer, 2001]. The ashy plume was probably not as thick as the case observed by Watson and Oppenheimer [2001]; indeed, these observa-tions were carried out during mild Strombolian activity at central crater complex, while our measurements were performed in a predominantly passive degassing stage, though with ash puffs.
The measurements at site C, conversely, evidenced a markedly higher AOD in the UV than in the NIR (UV AOD ranging from 0.09 to 0.30, mean value of 0.16±0.05; NIR AOD ranging from 0.02 to 0.12, mean value of 0.04±0.02), with a positive𝛼p(ranging from about 0.5 to about 2.0, with mean value of 1.16 ± 0.33). These𝛼p estimations are comparable with previous estimations of Watson and Oppenheimer [2000, 2001] and Mather
et al. [2004], in ash-free plumes, even if somewhat smaller in their mean values (e.g., Watson and Oppenheimer
[2000] found a mean𝛼pof 1.67 for an ash-free plume at Etna). Values of the𝛼 parameter larger than ∼1.0 indicate the presence of small particles. Nevertheless, visual inspection of the crater activity, as well as the small time distance with respect to observations at site B, did not point out a change in the crater activity.
Table 4. Details of Recent Publications Concerning Ångström Parameters Observations in Volcanic Plumes With Portable Photometers
Type of Plume Location 𝛼p 𝛽p Instruments (𝜆) Authors
Ash bearing Mount Etna −0.2 to 0.2 0.16 to 0.65 Cimel 318-2 (440–1020 nm) Watson and Oppenheimer [2001] Ash bearing Lascar <0.3 0.04 to 0.10 MIISP (440–1020 nm) Mather et al. [2004] Ash free Mount Etna 0.2 to 2.5 0.001 to 0.150 Cimel 318-2 (440–1020 nm) Watson and Oppenheimer [2000, 2001] Ash free Lascar and Villarica 0.3 to 2.8 0.001 to 0.007 MIISP (440–1020 nm) Mather et al. [2004] Ash free Kilauea not shown not shown MIISP (380–870 nm) Porter et al. [2002]
Figure 4. Time series of (a) UV (yellow crosses and lines) and NIR
(magenta crosses and lines) AODs, and (b) Ångström parameters (𝛼p, red crosses and lines,𝛽p, blue crosses and lines), for the volcanic plume observed on 20 July (from about 9:30 UTC to about 10:00 UTC: site B, Torre del Filosofo, proximal plume; from about 10:45 UTC to about 11:15 UTC: site C, Serra La Nave, distal plume). The mean values of𝛼pand𝛽pfor the two measurement sets are also reported.
While brownish ash puffs were still visible, the results suggest that ash has an atmo-spheric residence limited to the first hun-dred of meters, and the extinction at a few kilometers (about 7 km from craters to site C) is dominated by smaller particles, such as sulphate aerosols. A sharp increase of
𝛼 at increasing distance from the craters,
and then a decrease of mean aerosol size with plume age, was also observed at Lascar volcano [Mather et al., 2004]. The values of 𝛽p at site C are between 0.02 and 0.12, with mean value of 0.05±0.02, smaller than those observed before at site B. These values are consistent with ash-free plumes previously observed at Mount Etna [Watson and Oppenheimer, 2000, 2001] and sensibly larger than sim-ilar cases at Lascar and Villarica [Mather
et al., 2004], probably suggesting a thicker
sulphate aerosol distal plume at Etna than Lascar and Villarica.
5. Validation With AERONET
Cimel Observations
During the measurements at site A (LP cal-ibration, four analysis periods on 14, 15 (two periods), and 18 July), independent colocated aerosol observations were available from the Cimel Sun photometric station “Etna,” routinely opera-tional in the framework of the AErosol RObotic NETwork (AERONET) network (https://aeronet.gsfc.nasa.gov/). This station is located in the outskirts of Nicolosi, at a few kilometers from site A.
Figure 5a shows the mean UV and NIR AODs, during MIIOM operations in the four half-days, for both instruments. In the UV, the closer Cimel operating wavelength to MIIOM Ch. 3 is 340 nm. Due to the very small spectral distance (20 nm) between MIIOM and Cimel UV channels, very small differences between AODs at 340 and 320 nm are expected, following the Ångström law: ∼6% for𝛼 =1, ∼13% for 𝛼 =2, and just ∼3% for𝛼 values found during these days (about 0.5, see Figure 5d). The MIIOM UV AOD compares stunningly well with Cimel observations. Their temporal evolutions are consistent (Figure 5a), with constantly decreasing values from 14 July morning (UV AOD of about 0.3) to 18 July morning (UV AOD of about 0.1). Ultraviolet MIIOM and Cimel average AODs fall within the corresponding standard deviation. Figure 5b shows a scatterplot of average hourly values for both UV AODs data sets. Their best fit regression line is very close to a one-to-one relationship (angular coefficient and intercept values of 0.90 and 0.01, respectively), and the Pearson R2
cor-relation coefficient is very high (0.94). This comparison is very encouraging toward confidence of these new UV AOD observations.
In the NIR, while its temporal trend is consistent with Cimel observations, MIIOM displays a significant negative bias. This bias is confirmed by the scatterplot of average hourly values of Figure 5c. While the correlation is still high (R2=0.82), the angular coefficient value of 0.73 underlines that MIIOM underestimates Cimel NIR AODs.
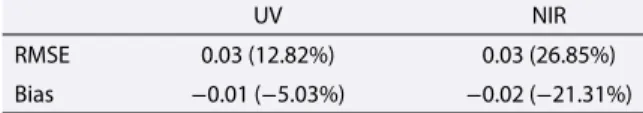
The absolute and percent average root-mean-square errors (RMSE) and biases for the MIIOM UV and NIR AODs, with respect to Cimel observations, are summarized in Table 5. The RMSEs (0.03/13% for UV and 0.03/27% for NIR AODs) are consistent with the theoretical uncertainties derived in section 3.2, even if slightly higher. As mentioned above, NIR AODs are significantly negatively biased (−0.02/−21%), while UV AODs are charac-terized by a very small negative bias (−0.01/5%).
The underestimation of MIIOM NIR AODs, with respect to Cimel observations, generates an overestimation of the calculated average𝛼s, using UV and NIR AODs. Figure 5d shows the average 𝛼 values, during MIIOM
Figure 5. (a) Mean aerosol optical depths for the time periods of measurements at site A: MIIOM at 320 nm
(red triangles, error bars, and line), Cimel at 340 nm (orange triangles, error bars, and line), MIIOM at 1020 nm (dark blue triangles, error bars, and line), and Cimel at 1020 nm (sky blue triangles, error bars, and line). Scatterplots of (b) hourly MIIOM AODs at 320 nm versus Cimel AODs at 340 nm and (c) hourly MIIOM AODs at 1020 nm versus Cimel AODs at 1020 nm. Best fit regression lines with their equations and Pearson correlation coefficient are also reported. (d) Mean Ångström exponent𝛼values or the time periods of measurements at site A, from MIIOM (dark green triangles and error bars) and Cimel (light green triangles and error bars).
operations in the four half-days, for both instruments. The systematic overestimation of MIIOM (average of ∼17.5%) is evident. Nevertheless, except for a stronger overestimation (∼58%) for 15 July P.M., the𝛼 values of the two instruments are quite consistent, with MIIOM and Cimel average𝛼s falling within corresponding standard deviation.
This comparison effort has been carried out for a background atmosphere (LP-related activities at distal loca-tion from Mount Etna’s summit) and for limited variability of𝛼. While the comparison is very encouraging, especially for the new UV AOD observations, more extended, plume-specific validation is to be carried out
Table 5. Absolute and Percent Average RMSE and Biases of
MIIOM AODs, With Respect to Cimel
UV NIR
RMSE 0.03 (12.82%) 0.03 (26.85%) Bias −0.01 (−5.03%) −0.02 (−21.31%)
over longer time periods. While carrying an accu-rately calibrated instrument, like the Cimel Sun photometer, to more proximal locations can be hampered by obvious logistic limitations, other validation strategies, like the comparison with visible AODs of portable instruments like Micro-tops MIISP model or satellite data, are under investigation.
6. Conclusions and Perspectives
A new methodology has been developed to retrieve UV and NIR AODs from MIIOM Sun photometer, using a LP calibration technique and by correcting UV AODs for the ozone absorption. The ozone-corrected UV AOD at 320 nm is derived for the first time with a portable MIIOM photometer, thus extending the available spectral band to shorter wavelengths, which are more sensitive to small aerosol particles than, e.g., visible wavelengths of conventional MIISP observations or longer UV wavelengths (like done by Porter et al. [2002]). The theoretical uncertainties of the new UV AOD retrievals are estimated at values lower than 0.035 (12%). These uncertainty estimations take into account random errors (dominated by calibration uncertainties) and the volcanic plume-specific systematic error arising from the neglect of volcanic SO2absorption in passive degassing conditions. The technique has been tested during the EPL-RADIO campaign to characterize Mount Etna’s volcanic plume. This is the first time a MIIOM has been used to observe volcanic aerosols and first time volcanic aerosols optical properties at wavelengths as short as 320 nm are measured with a portable Sun photometer. The LP calibration was carried out during four half days, and extraterrestrial constant spectra are determined with average standard deviations (extraterrestrial constant variability) between 0.30 and 0.80%, depending on the wavelength. The UV and NIR AODs have been measured at both proximal (site B: a few hundreds of meters from the active craters) and distal plume (site C: about 7 km from the active craters). The spectral variability of AOD is very different at the two sites, with AOD slightly increasing from UV to NIR at site B and strongly decreasing from UV to NIR at site C. The UV and NIR AODs have been used to derive the Ångström parameters𝛼pand𝛽p. The theoretical uncertainties of𝛼pand𝛽pare estimated to values as low as ±0.2 (±15%) and ±0.015 (±15%) for the two parameters, respectively. The measured proximal and distal
𝛼phad mean values of −0.30±0.22 (individual observations between −0.5 and 0.1) and 1.16±0.33 (individual observations between 0.5 and 2.0), respectively. This indicates extremely different mean sizes, probably linked to the quick sedimentation of extremely large ash particles, which were emitted during the whole observa-tion session at the two sites. The𝛼pand𝛽pdeterminations are consistent with previous studies at both Etna and other volcanoes for ash-bearing (site B) and ash-free plumes (site C). These observations add a further literature reference of the Ångström parameters at Mount Etna, whose latter estimations date back to the year 2000, and emphasize the potential of Sun photometry as a robust tool to monitor volcanic plumes. The new method has been validated by comparing background MIIOM observations with colocated AERONET Cimel measurements. A RMSE of 0.03 (13%) has been found for UV AODs. This is consistent with the theoretical estimation of MIIOM UV AOD uncertainties. The derived MIIOM Ångström exponents, even if consistent with Cimel derivations, are characterized by an overestimation of about 17.5%, mainly due to the negative biases (−0.02/−21%) of MIIOM NIR AODs.
References
Angström, A. (1964), The parameters of atmospheric turbidity, Tellus, 16(1), 64–75, doi:10.1111/j.2153-3490.1964.tb00144.x.
Bass, A. M., and R. J. Paur (1985), The ultraviolet cross-sections of ozone. I. The measurements, II—Results and temperature dependence, in Atmospheric ozone; Proceedings of the Quadrennial Ozone Symposium, Halkidiki, Greece, vol. 1, edited by C. S. Zerefos and A. Ghazi, pp. 606–616, D. Reidel, Dordrecht, Netherlands.
Bodhaine, B. A., N. B. Wood, E. G. Dutton, and J. R. Slusser (1999), On Rayleigh optical depth calculations, J. Atmos. Oceanic Technol., 16(11), 1854–1861, doi:10.1175/1520-0426(1999)016<1854:ORODC>2.0.CO;2.
Bogumil, K., et al. (2003), Measurements of molecular absorption spectra with the SCIAMACHY pre-flight model: Instrument
characterization and reference data for atmospheric remote sensing in the 230-2380 nm region, J. Photochem. Photobiol. A, 157, 167–184. Brogniez, C., V. Buchard, and F. Auriol (2008), Validation of UV-visible aerosol optical thickness retrieved from spectroradiometer
measurements, Atmos. Chem. Phys., 8(16), 4655–4663, doi:10.5194/acp-8-4655-2008.
Campbell, J. R., E. J. Welton, N. A. Krotkov, K. Yang, S. A. Stewart, and M. D. Fromm (2012), Likely seeding of cirrus clouds by stratospheric Kasatochi volcanic aerosol particles near a mid-latitude tropopause fold, Atmos. Environ., 46, 441–448, doi:10.1016/j.atmosenv.2011.09.027.
Acknowledgments
This work has been supported by the EU Horizon 2020 Research and Innovation Programme (grant 654182: ENVRIplus), the EU 7th Framework Program (grant 308665: Med-SuV), and the Observatoire de Physique du Globe de Clermont-Ferrand/Université Blaise Pascal. Katerina Karagiannopoulou, Andrea Miconi, and Léa Olivier are acknowledged for their help in carrying out the observations. The Department of Geosciences of the École Normale Supérieure and its director, Eric Calais, are acknowledged for proving a Microtops Ozone Monitor for the EPL-RADIO campaign. Microtops data are proprietary and can be obtained on demand by contacting Pasquale Sellitto. Stefano Corradini is gratefully acknowledged for maintaining the Cimel data set at “Etna” AERONET station. Cimel data are available at the website https://aeronet.gsfc.nasa.gov/. During the campaign, a photographic reportage has been produced and can be found at the following website: http://photo.geo.fr/expedition-au-sommet-de-l-etna-19882. The three anonymous reviewers are gratefully acknowledged for their constructive criticism that provided a significant contribution to improve the quality of this paper.
di Sarra, A., et al. (2015), Empirical correction of multifilter rotating shadowband radiometer (MFRSR) aerosol optical depths for the aerosol forward scattering and development of a long-term integrated MFRSR-Cimel dataset at Lampedusa, Appl. Opt., 54(10), 2725–2737, doi:10.1364/AO.54.002725.
Durant, A. J., R. A. Shaw, W. I. Rose, Y. Mi, and G. G. J. Ernst (2008), Ice nucleation and overseeding of ice in volcanic clouds, J. Geophys. Res.,
113, D09206, doi:10.1029/2007JD009064.
Gómez-Amo, J. L., A. di Sarra, V. Estellés, M. P. Utrillas, and J. A. Martínez-Lozano (2009), Assessment of aerosol optical depth at UV wavelengths from Microtops II ozone monitor, in EGU General Assembly Conference Abstracts, vol. 11, edited by D. N. Arabelos and C. C. Tscherning, 12439 pp., Copernicus, Göttingen, Germany.
Gómez-Amo, J. L., V. Estellés, A. di Sarra, R. Pedrós, M. P. Utrillas, J. A. Martínez-Lozano, C. González-Frias, E. Kyrö, and J. M. Vilaplana (2012), Operational considerations to improve total ozone measurements with a Microtops II ozone monitor, Atmos. Meas. Tech., 5(4), 759–769, doi:10.5194/amt-5-759-2012.
Graf, H.-F., J. Feichter, and B. Langmann (1997), Volcanic sulfur emissions: Estimates of source strength and its contribution to the global sulfate distribution, J. Geophys. Res., 102(D9), 10,727–10,738, doi:10.1029/96JD03265.
Knobelspiesse, K. D., C. Pietras, and G. S. Fargion (2003), Sun-pointing-error correction for sea deployment of the Microtops II handheld Sun photometer, J. Atmos. Oceanic Technol., 20(5), 767–771, doi:10.1175/1520-0426(2003)20<767:SPECFS>2.0.CO;2.
Kristiansen, N. I., A. J. Prata, A. Stohl, and S. A. Carn (2015), Stratospheric volcanic ash emissions from the 13 February 2014 Kelut eruption,
Geophys. Res. Lett., 42, 588–596, doi:10.1002/2014GL062307.
Lamb, H. H. (1970), Volcanic dust in the atmosphere; with a chronology and assessment of its meteorological significance, Philos. Trans. R.
Soc. A, 266(1178), 425–533, doi:10.1098/rsta.1970.0010.
LeGrande, A., K. Tsigaridis, and S. E. Bauer (2016), Role of atmospheric chemistry in the climate impacts of stratospheric volcanic injections,
Nat. Geosci., 9, 652–655, doi:10.1038/ngeo2771.
Martin, R. S., T. A. Mather, D. M. Pyle, M. Power, V. I. Tsanev, C. Oppenheimer, A. G. Allen, C. J. Horwell, and E. P. W. Ward (2009), Size distributions of fine silicate and other particles in Masaya’s volcanic plume, J. Geophys. Res., 114, D09217, doi:10.1029/2008JD011211. Mather, T., D. Pyle, and C. Oppenheimer (2013), Tropospheric volcanic aerosol, in Volcanism and the Earth’s Atmosphere, edited by A. Robock
and C. Oppenheimer, pp. 189–212, AGU, Washington, D. C., doi:10.1029/139GM12.
Mather, T. A., V. I. Tsanev, D. M. Pyle, A. J. S. McGonigle, C. Oppenheimer, and A. G. Allen (2004), Characterization and evolution of tropospheric plumes from Lascar and Villarrica volcanoes, Chile, J. Geophys. Res., 109, D21303, doi:10.1029/2004JD004934. McCormick, M. P., L. W. Thomason, and C. R. Trepte (1995), Atmospheric effects of the Mt Pinatubo eruption, Nature, 373, 399–404,
doi:10.1038/373399a0.
Morys, M., F. M. Mims, and S. E. Anderson (2001a), MICROTOPS II. ozone monitor and sunphotometer: User’s guide, Tech. Rep., Solar Light Company, Glenside, Pa.
Morys, M., F. M. Mims, S. Hagerup, S. E. Anderson, A. Baker, J. Kia, and T. Walkup (2001b), Design, calibration, and performance of Microtops II handheld ozone monitor and Sun photometer, J. Geophys. Res., 106(D13), 14,573–14,582, doi:10.1029/2001JD900103.
Newhall, C. G., and S. Self (2013), The Volcanic Explosivity Index (VEI): An estimate of explosive magnitude for historical volcanism, pp. 143–150, AGU, Washington, D. C., doi:10.1029/HG002p0143.
Porter, J. N., M. Miller, C. Pietras, and C. Motell (2001), Ship-based Sun photometer measurements using Microtops Sun photometers,
J. Atmos. Oceanic Technol., 18(5), 765–774, doi:10.1175/1520-0426(2001)018<0765:SBSPMU>2.0.CO;2.
Porter, J. N., K. A. Horton, P. J. Mouginis-Mark, B. Lienert, S. K. Sharma, E. Lau, A. J. Sutton, T. Elias, and C. Oppenheimer (2002), Sun photome-ter and lidar measurements of the plume from the Hawaii Kilauea Volcano Pu’u O’o vent: Aerosol flux and SO2lifetime, Geophys. Res. Lett.,
29(16), 1783, doi:10.1029/2002GL014744.
Robock, A., and C. Oppenheimer (2003), Volcanism and the Earth’s Atmosphere, Geophys. Monogr. Ser., vol. 139, AGU, Washington, D. C. Sellitto, P. (2016), The EPL-RADIO project co-funded by ENVRIplus, ENVRIplus Newsletter #3. [Available at
http://www.envriplus.eu/wp-content/uploads/2015/08/EPL-radio.pdf.]
Sellitto, P., and P. Briole (2015), On the radiative forcing of volcanic plumes: Modelling the impact of Mount Etna in the Mediterranean,
Ann. Geophys., 58, doi:10.4401/ag-6879.
Sellitto, P., A. di Sarra, and A. M. Siani (2006), An improved algorithm for the determination of aerosol optical depth in the ultraviolet spectral range from Brewer spectrophotometer observations, J. Opt. A: Pure Appl. Opt., 8(10), 849–855, doi:10.1088/1464-4258/8/10/005. Sellitto, P., et al. (2016), Synergistic use of Lagrangian dispersion and radiative transfer modelling with satellite and surface remote sensing
measurements for the investigation of volcanic plumes: The Mount Etna eruption of 25–27 October 2013, Atmos. Chem. Phys., 16(11), 6841–6861, doi:10.5194/acp-16-6841-2016.
Sellitto, P., G. Salerno, and P. Briole (2017a), The EtnaPlumeLab (EPL) research cluster: Advance the understanding of Mt. Etna plume, from source characterisation to downwind impact, Ann. Geophys., 60, doi:10.4401/ag-7106.
Sellitto, P., C. Zanetel, A. di Sarra, G. Salerno, A. Tapparo, D. Meloni, G. Pace, T. Caltabiano, P. Briole, and B. Legras (2017b), The impact of Mount Etna sulfur emissions on the atmospheric composition and aerosol properties in the central Mediterranean: A statistical analysis over the period 2000–2013 based on observations and Lagrangian modelling, Atmos. Environ., 148, 77–88,
doi:10.1016/j.atmosenv.2016.10.032.
Teillet, P. M. (1990), Rayleigh optical depth comparisons from various sources, Appl. Opt., 29(13), 1897–1900, doi:10.1364/AO.29.001897. van de Hulst, H. (1957), Light Scattering by Small Particles, Dover Books on Phys., Dover, New York.
von Glasow, R., N. Bobrowski, and C. Kern (2009), The effects of volcanic eruptions on atmospheric chemistry, Chem. Geol., 263(1–4), 131–142, doi:10.1016/j.chemgeo.2008.08.020.
Watson, I. M., and C. Oppenheimer (2000), Particle size distributions of Mount Etna’s aerosol plume constrained by Sun photometry,
J. Geophys. Res., 105(D8), 9823–9829, doi:10.1029/2000JD900042.
Watson, I. M., and C. Oppenheimer (2001), Photometric observations of Mt. Etna’s different aerosol plumes, Atmos. Environ., 35, 3561–3572, doi:10.1016/S1352-2310(01)00075-9.