HAL Id: hal-00153877
https://hal.archives-ouvertes.fr/hal-00153877
Submitted on 25 Jan 2021
HAL is a multi-disciplinary open access
archive for the deposit and dissemination of
sci-entific research documents, whether they are
pub-lished or not. The documents may come from
teaching and research institutions in France or
abroad, or from public or private research centers.
L’archive ouverte pluridisciplinaire HAL, est
destinée au dépôt et à la diffusion de documents
scientifiques de niveau recherche, publiés ou non,
émanant des établissements d’enseignement et de
recherche français ou étrangers, des laboratoires
publics ou privés.
Role of non-linear oceanic processes in the response to
westerly wind events: new implications for the 1997 El
Niño onset
Jean-Philippe Boulanger, Edmée Durand, Jean-Philippe Duvel, Christophe E.
Menkès, Pascale Delécluse, Maurice Imbard, Matthieu Lengaigne, Gurvan
Madec, Sébastien Masson
To cite this version:
Jean-Philippe Boulanger, Edmée Durand, Jean-Philippe Duvel, Christophe E. Menkès, Pascale
Delé-cluse, et al.. Role of non-linear oceanic processes in the response to westerly wind events: new
implications for the 1997 El Niño onset. Geophysical Research Letters, American Geophysical Union,
2001, 28 (8), pp.1603-1606. �10.1029/2000GL012364�. �hal-00153877�
GEOPHYSICAL RESEARCH LETTERS, VOL. 28, NO. 8, PAGES 1603-1606, APRIL 15, 2001
Role of non-linear oceanic processes
in the response
to westerly
wind events: new implications for the 1997 El Nifio onset
J.-P. Boulanger,
and E. Durand
Laboratoire d'Oc6anographie Dynamique et de Climatologie, Unit6 Mixte CNRS/IRD/UPMC, Paris, France
J.-P. Duvel,
Laboratoire de M•t•orologie Dynamique, Unit• CNRS, Paris, France
C. Menkes, P. Delecluse,
M. Imbard, M. Lengaigne,
G. Madec and S. Masson
Laboratoire d'Oc6anographie Dynamique et de Climatologie, Unit6 Mixte CNRS/IRD/UPMC, Paris, France
Abstract. In March 1997, a strong westerly wind event (WWE)
occurred in the western equatorial Pacific prior to the 1997-1998
E1 Nifio event. It produced downwelling Kelvin waves that
interacted non linearly with the surface temperature, salinity and
zonal current fronts located at the eastern edge of the warm-fresh
pool (EEWP). This non-linear interaction locally increased zonal
currents by a factor of three compared to a theoretical linear
response, and advected the EEWP at an unexpected rate (- l m/s)
to which the ocean-atmosphere coupled system may have been
responding rapidly to trigger E1 Nino conditions.
1. Introduction
Westerly wind events associated to perturbations of the large
scale atmospheric convective activity may determine the onset of
an E1 Nifio [Mc Phaden, 1999; Mc Phaden and Yu, 1999; Boulanger and Menkes, 1999] by forcing oceanic Kelvin waves
in the equatorial Pacific. Indeed, satellite and in-situ observations
indicate a connection between the occurrence and intensity of westerly wind events and the onset of warm ENSO events [Slingo and Delecluse, 1999] such as the 1997-1998 E1 Nifio [Yu and Rienecker, 1998; Mc Phaden, 1999; Boulanger and Menkes, 1999]. Various studies have investigated the spario-temporal
structures of westerly wind events [Giese and Harrison, 1991;
Harrison and Giese, 1991; Harrison and Vecchi, 1997], their
impact in the observed oceanic vertical structure [Cronin et al.,
2000; Delcroix et al., 1993], in simple oceanic models [Kessler and McPhaden, 1995; Boulanger and Menkes., 2001] or in more complex ones [Kindle and Phoebus, 1995; Richardson et al.,
1995]. More precisely, studies based on linear wave theory have
emphasized the role of oceanic Kelvin waves such as those forced by WWE in displacing the EEWP via their geostrophic zonal currents [Picaut et al., 1996; Picaut and Delcroix, 1995]. In particular, various authors [Mc Phaden, 1999; Boulanger and
Menkes, 1999] have suggested that the strong March 1997 WWE
(Figure 1) forced an observed strong Kelvin wave whose directly
associated geostrophic zonal current anomalies advected the eastern edge of the warm-pool eastward and, thus, potentially
initiated an ocean-atmosphere feedback leading to the largest E1
Nifio on record Nifio [Mc Phaden, 1999].
Copyright 2001 by the American Geophysical Union.
Paper number 2000GL012364.
0094-8276/01/2000GL012364505.00
2. Oceanic response
to the March 97 Westerly
Wind Event
2.1. Ocean model and data variability
In order to investigate the actual role of the March 1997 WWE, a first simulation is performed with the ORCA-OPA
Ocean General Circulation Model [Madec et al., 1998; Madec
and Irabard, 1996] starting in 1993, and using the observed ERS wind stress data [Bentamy et al., 1996] and climatological heat and water fluxes computed from the 1980-1993 ECMWF Reanalysis. A flux correction term is also computed as a relaxation of model temperature to Reynolds SST observations
using
a -40W/m2/K
coefficient.
The OPA model
has
been
shown
to have a good skill in simulating the subsurface equatorialtemperature
and zonal
current
structure
and variability,
as well as
surface currents and sea level during the 1997-1998 period when forced by the ERS wind stress data [Vialard et al., 2001]. This gives us confidence in interpreting the simulated processes as relevant for the real ocean. In the following, we will focus on the ocean surface variability. Figure 2 displays the observed and simulated sea surface temperatures on March, l0 th 1997 as wellas the simulated salinity and zonal current fields (observations
are weekly data, and model outputs are 5-day averaged). The 28øC isotherm (Figures 2a-b) together with strong salinity and zonal current fronts were located at the dateline prior to the maximum of the March 1997 WWE (Figures 2c-d). One month later, both model and data show that large SST anomalies (larger
than 1.5øC for both sets) are observed from the dateline to 160øW
(Figures 2e-f). These anomalies are confined in a 3øN-3øS
narrow band around the equator. The model indicates that these anomalies are actually the result of a zonal displacement of the EEWP by currents larger than l m/s (Figure 2h) which are confined in a 50-m deep surface layer (not shown). These currents also advected the salinity front (Figure 2g) into the equatorial saltier waters of the central Pacific (Figure 2c). The
major difference between the model and data SST anomalies is in
their respective maximum (larger than 1.5øC in data and 2.5øC in the model). The large convective activity at that time near the
dateline
(McPhaden,
1999),
the gaps
in the TAO moorings
at the
dateline in March 1997 together with the spatial smoothness ofthe Reynolds
SST data may contribute
to the smaller
amplitude
of the observed positive anomalies. Anyway, aside from the 1 øC difference, the major point highlighted by both model and data is the eastward displacement of the EEWP that linear theory alonecannot explain as will be shown later. 1603
1604 BOULANGER ET AL.' ROLE OF NON-LINEAR OCEANIC PROCESSES
| _q 4s•
Zonal wind stress event pattern on March,l 0th 1997 (N/m2)
, , , 160E 180 140W 120W 100W 150W 140E 160W Longitude -0.16 -0.12 -0.0• -004 0.00 004 0.08 0.12 0.16
Figure 1. Spatial pattern of the March 1997 wind event on the 10th of March as computed from the Local Modal Analysis
method.
Color
intervals
are every
0.02N/m
2.
2.2. Impact of the March 1997 Westerly Wind Event
To document the oceanic response to the March 1997 WWE, a
second simulation was performed using ERS wind stress data to
which the March 1997 WWE is taken out of the wind forcing
field. In order to extract specifically the spario-temporal structure
of this wind event near the equator, a Local Mode Analysis [LMA; Goulet and Duvel, 2000] was applied to the zonal and
meridional wind stress for the equatorial zone (5øS-5øN; 120øE -
250øE) with a spatial resolution of 1 o and with a time window of
140 days. The wind event appears to be the most persistent signal
(a) SST Reynolds on March, 9th 1997 (e) SST Reynolds (April, 8th)-(March, 9th)
*
%
'
140E 160E 180 160W 140W 120W 100W 80W 140E 160E 180 160W 140W 120W IOOW bow
Longitude Longitude
{b} SST ORCA on March, 9th 1997 {0 SST ORCA (April, 8th)-(March 9th}
10Nt
' ' ß
'
10N
l
0
L-
"'v:"
140E 160E 180 160W 140W 120W 100W 80W 1,10E 160E 180 160W 140W 12•0W 100W bOW
Longitude Longitude
(c) S$S ORCA on March, 9th I997 (g) SSS ORCA (April, 8th)-(March 9th)
1oN ... i iON; ...
140E 160E 180 160W 140W 120W 100W •-,OW 140F 160E 180 160W 14•W 120W 100W
Longitude Longitude
(d) Zonal ct•?rent on March, 9th 1997 (h) Zonal current (April. 8th)-(March0 9th)
,oN: ... ; lO•: ...
SN' s•i ,
,
10S ' 10S-•.•. ß ...
140I: 160E 180 160W 140W 120W 100W 80W 140E 160E 180 160W 140W 120W 1O0W •0W
Longitude Longitude
Figure 2. Spatial patterns of respectively (a) Reynolds sea
surface temperature, (b) model sea surface temperature, (c) model
sea surface salinity and (d) model surface zonal currents on
March 9 th, 1997, and of anomalies in (e) Reynolds sea surface temperature, (f) model sea surface temperature, (g) model sea
surface salinity and (h) model zonal current computed as the
differences between April 8th and March 9th conditions. Contour/color intervals are every IøC in (a, b), 0.5øC in (e,f),
0.5psu in (c,g), and 20cm/s in (d,h).
for a time window centred on the 3 ra of March 1997 with a near-
equatorial maximum in the western Pacific on the l0 th of March
1997. The wind event has a maximal amplitude (and is almost stationary) west of the dateline. The largest westerly wind perturbation near the equator is located near 150øE and a
secondary maximum is located near 170øE (Figure 1).
In order to only diagnose the impact of the wind event on the
oceanic response, the heat and water fluxes in the second simulation are identical to the one used in the first simulation. It
is important to note that, in the first simulation, a flux correction
term was computed as a relaxation of model temperature to
Reynolds
SSTs using
a-40W/m2/K
coefficient.
To perform
the
second simulation, this term was added to the ECMWF heat
forcing prior to performing the second simulation which thus
does not use any specific restoring term. This procedure allows
the model SST in that second simulation to adjust freely to
dynamical changes. The difference between the two simulations
thus traces the source of the changes in the equatorial Pacific
Ocean conditions
due only to the dynamical
perturbation
generated by the March 1997 WWE. The differences between the
two simulations
are now examined
along
the equator
(Figures
3)
(a) March 97 wind event anomalies
May 97 T ....
^pr 97 ---7--v.-,• -.--...V.t•,.• ',.-...•
" •d
Mar97
'•'"'
•:
ß ' •-•
Feb 97 • 140E 160E 180 160W 140W IL•W 100W 80W
Longitude ß O, 16 -0.12 -OO7 -0.63 0.01 0.•6 0.10 {b) Sea-level anomalies Jun 97 May 97 Apr 97
Mar 97 1• 40E 160E 180 160W 140W 120W !OOW 80¾¾ Mar 97
Jun 97 Apr 971 t.ongitude - 17.03 . 12.67 -820 4•X! 0.13 4.67 (d) SST anomalies
, p_.!,
I : 1 •x97 ,--4---L-- "* t' /L'"'T-;- v -• I ' It(c) Zonal current anomalies
/
140E 160E ibo 160W 14OW 120W 100W bOw Longitude (e) SSS anomalies i I .! Jun 97 I ,
Apr
97 _...._•,,
• t •
,
Apr
97
Mar
97
•
•F !•'•;' •
I• I•W I•W I•W I•W •WMar
97
1 '
140E I• 1• I•W I•W I•W l•V •W•e Lon•de
/
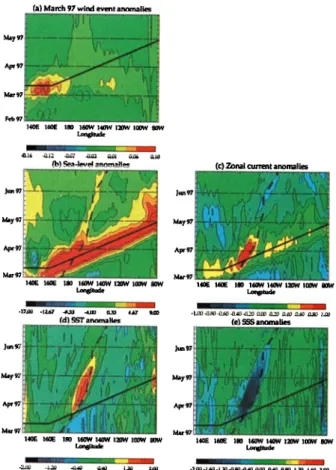
Figure 3. Longitude-time plots of the 2øN-2øS averaged
differences between the two simulations for zonal wind stress of
(a) zonal
wind stress
(color
intervals
are every
0.02N/m2),
(b) sea
level (color intervals are every 2cm), (c) zonal current (colorintervals
are every 20cm/s),
(d) sea surface
temperature
(color
intervals are every 0.5øC) and (e) sea surface salinity (colorintervals
are every
0.40psu).
The straight
line represents
the trace
of the Kelvin wave propagation from the eastern edge of the windevent. The dashed
line is the 1021.5 kg/m
• isopycne
which
characterizes well the eastern edge of the warm-pool simulated in the control run.BOULANGER ET AL.' ROLE OF NON-LINEAR OCEANIC PROCESSES 1605
The equatorial maximum in the westerly wind stress anomalies,
observed on the beginning of March around 150øE (Figure 3a), forces a large downwelling Kelvin wave (Figure 3b) propagating to the eastern Pacific at a phase speed around 2.8m/s (straight line). Although an SST anomaly is observed at the very eastern
boundary (Figure 3d) in direct association with the Kelvin wave,
in agreement with suggestion by data [Boulanger and Menkes,
1999] and other ocean model studies [Boulanger and Menkes,
2000], the main SST anomaly is observed at the eastern edge of
the warm-pool. Simultaneously, a strong sea surface salinity (SSS) signal (Figure 3e) is observed as well at this edge. These SST and SSS signals are displaced more or less at the same velocity (-lm/s). This is much faster than the speed of the
geostrophic zonal current anomaly of about 35-40cm/s produced
by the Kelvin wave only (Figure 3c). This fast propagation is
related to a large eastward zonal current perturbation (-1 m/s)
propagating
from March 15
th to April lY h at the same
speed
as
the SST and SSS signals along the eastern edge of the warm- fresh pool (Figure 3c). Although these large eastward zonal
current anomalies are initiated when the Kelvin wave passes the
dateline, where the salinity front is initially located (Figure 2c), the simultaneous evolution of SST, SSS and zonal current
anomalies continue while the Kelvin wave moves faster further
east. The coupled displacement of the equatorial dynamical and
thermodynamical fronts while the Kelvin wave is gone thus cannot obey to linear dynamics.
3. Non-linear mechanism of displacement of the
eastern edge of the warm-pool
In order to investigate the mechanisms responsible for the
large zonal current response near the dateline, the contributions
of each term of the zonal momentum equation at the surface are
examined. The major terms contributing to the zonal current variability (Figure 4) are the zonal advection of zonal momentum, the zonal pressure gradient and the difference between the zonal wind stress and the vertical friction term over
the 10m-thickness of the first level of the model. All other terms
are negligible and will not be discussed. From these results, we
can draw the following scenario: (i) in response to the westerly
winds, a downwelling Kelvin wave is forced and propagates
eastward (Figure 3b); (ii) a zonal pressure gradient associated to
the Kelvin wave propagation generates an acceleration of the currents west of the Kelvin wave front (Figures 3c and 4c); (iii)
the zonal current increases near the convergence front due to the
wave propagation. Initially, at this front, zonal currents are close
to zero, and the zonal gradient of zonal currents is negative
(Figure 2d). Therefore a non-linear response takes place (Figure
4b) when positive current anomalies induced by the passing Kelvin wave interact with the negative zonal current gradient at
the convergent front. This interaction strongly increases the zonal
current; (iv) the temperature and salinity fronts are displaced by
zonal advection via the enhanced zonal current and generate a zonal pressure gradient moving eastward (Figure 4c); (v) the
zonal pressure gradient at the edge of the warm-fresh pool as well
as the non-linear term of momentum advection (Figure 4b) both
contribute to increase the zonal current locally as the front moves
eastward. Such a process is maintained during about a month
while the vertical diffusion acts against it and increases its negative feedback when the 3øN-3øS/50-m deep fronts propagate
eastward over colder and saltier waters associated to westward
zonal currents [Vialard and Delecluse, 1998a,b].
(a) du/dt May 97 • • • Apr 97 • 140F. 160E 180 160W 140W 120W 100W 80W Longitude May 97 (c) -(dp/dx)/rho ,•. Apr 97 -- May 97 (b) -udu/dx ,, : I Apr 97 • • Mar 97:' Feb 97 •l 140E 160E 180 1601N 140W 120W 100W 80W Longitude I . May 97 I Apr 97 Mar 97 m • Mar 97 I Feb 97 , I ,, j i r•b 971 l.lOE 160E 180 160W 14•V 120W 100W 80W Lonbntude (d) (taux/rho-Kdu/dz)/l 0. 140E 160E 180 160W 140W 120W !00W 80W Lon•ptude -1.20 -0.96 -0.72 -O.4•q -0 24 0•0 0.24 0.48 0.72 0.96 1.20
Figure 4. Longitude-time plots of the 2øN-2øS averaged trends
of the zonal momentum equation: (a) zonal current derivative, (b)
zonal advection of zonal momentum, (c) zonal pressure gradient,
(d) difference over the 10m-thickness of the model first level between the zonal wind stress and the vertical diffusion. Color intervals are every 0.12(m/s)/month. The straight line represents
the trace of the Kelvin wave propagation from the eastern edge of
the wind event. The dashed
line is the 1021.5 kg/m
3 isopycne
which characterizes well the eastern edge of the warm-pool
simulated in the control run.
4. Discussion
Our results
showed
that the simulated
displacement
of the
eastern edge of the warm-pool in March-April 1997 is muchlarger than the one which would have been induced
by the
geostrophic zonal currents associated to the wind-forced downwelling Kelvin wave. While Kelvin waves contribute as an
initiating process,
the non-linear
interaction
of equatorial
dynamical and thermodynamical fronts at the EEWP is anessential
process
in extending
eastward
the warm-fresh
pool
during the onset phase of the 1997-1998 E1 Nifio. This non-linear
interaction is by far the largest signal in response to the March
1997 westerly
wind event with associated
space
and time scales
to which the atmosphere is likely to respond in that sensitiveregion.
Finally, this result suggests that the displacement of the warm- fresh pool is strongly dependent on the oceanic conditions at the
EEWP prior
to the wind event
and
more
precisely
to the strength
of the dynamical and thermodynamical
fronts. A better
knowledge
of such
oceanic
conditions
(through
an assimilation
of
oceanic
observations
and an improvement
in surface
forcings)
is
of crucial importance
to improve ENSO predictions.
This
supports the need for a global/accurate observation system of theocean, including
measurements
of sea surface
salinity in the
Tropics. Last but not least, the potentially important role of thetightness
of the salinity
front in the strength
of the non-linear
interaction highlights the needs for improvements
in the
knowledge and simulation of the hydrological cycle.1606 BOULANGER ET AL.: ROLE OF NON-LINEAR OCEANIC PROCESSES
Acknowledgments. We are thankful to the Institut National des
Sciences de l'Univers (INSU) and the Programme National d'Etude de
la Dynamique
du Climat
(PNEDC)
for their
financial
support,
as well
as to the Institut du D6veloppement et des Ressources en Informatique Scientif'lque (IDRIS) for providing supercomputing facilities. We also thank R. Reynolds and T. Smith at NOAA/NCEP for SST data and the Center ERS d'Archivage et de Traitement located in the Institut Francais de Recherche pour l'Exploitation de la Mer for providing theprocessed
and
gridded
ERS-1
and
ERS-2
zonal
wind
stress
data.
References
Bentamy, A., Y. Quilfen, F. Gohin, N. Grima, M. Lenaour, and J.
Servain, Determination and validation of average wind fields from
ERS-1 scatterometer measurements, The Global Atmopshere and
Ocean System, 4, 1-29, 1996.
Boulanger, J.-P., and C. Menkes, Long equatorial wave reflection in the Pacific Ocean from TOPEX/POSEIDON data during the 1992-1998 period, Clim. Dyn., 15, 205-225, 1999.
Boulanger, J.-P., et C. Menkes, The TRIDENT Pacific model. Part II:
The thermodynamical model and the role of long equatorial wave
reflection during the 1993-1998 TOPEX/POSEIDON period, Clim.
Dyn., 17, 175-186, 2001.
Cronin, M. F., M. J. McPhaden, and R. H. Weisberg, Wind-forced reversing jets in the western equatorial Pacific, J. Phys. Oceanogr., 30, 657-676, 2000.
Delcroix, T., G. Eldin, M. J. McPhaden, and A. Morli•re, Effects of
westerly wind bursts upon the western equatorial Pacific Ocean,
February-April 1991, J. Geophys. Res., 98, 16,379-16,385, 1993. Giese, B. S., and D. E. Harrison, Eastern equatorial Pacific response to
three composite westerly wind types, J. Geophys. Res., 96, 3239-3248,
1991.
Goulet, L., and J.P. Duvel, A new approach to detect and characterise
intermittent atmospheric oscillations: Application on the Intraseasonal Oscillation, (To Appear in the J. Atmos. Sci.), 2000.
Harrison, D.E, and B. S. Giese, Episodes of surface westerly winds as observed from islands in the western tropical Pacific, J. Geophys. Res., 96, 3221-3237, 1991.
Harrison, D. E., and G. A. Vecchi, Surface westerly wind events in the tropical Pacific, 1986-1995, J. Clim., 10, 3131-3156, 1997.
Kindle, J. C., and P. A. Phoebus, The ocean response to operational westerl wind bursts during the 1991-1992 El Nifio, J. Geophys. Res., 100, 4893-4920, 1995.
Kessler, W. S.., M. J.. McPhaden, and K. M. Weickmann, Forcing of intraseasonal Kelvin waves in the equatorial Pacific, J. Geophys. Res.,
100, 10,613-10,631, 1995.
McPhaden, M. J., Genesis and evolution of the 1997-1998 El Nifio, Science, 283, 950-954, 1999.
McPhaden, and X. Yu, Equatorial waves and the 1997-1998 El Nifio, Geophys. Res. Letters, 26, 2961-2964, 1999.
Madec, G., P. Delecluse, M. Imbard, and C. L6vy, OPA 8.1 Ocean
General Circulation Model reference manual. Note du P61e de
mod61isation, Institut Pierre-Simon Laplace, NøI 1, 9 lpp, 1998 Madec G., and M. Imbard, A global ocean mesh to overcome the North
Pole singularity, Clim. Dyn., 12, 381-388, 1996
Picaut, J., M. Ioualalen, C. Menkes, T. Delcroix, and M. J. McPhaden, Mechanism of the zonal displacements of the Pacific warm pool: implications for ENSO, Science, 274, 1486-1489, 1996.
Picaut, J., and T. Delcroix, Equatorial wave sequence associated with warm pool displacements during the 1986-1989 E1 Nifio-La Nifia, J. Geophys. Res., 100, 18393-18408, 1995.
Richardson, R. A., I. G. Ginis, and L. M. Rothtsein, A numerical investigation of the local ocean response to westerly wind burst forcing in the western equatorial Pacific, J. Phys. Oceanogr., 29, 1334-1352,
1999.
Slingo, J., and P. Delecluse, Scale interactions and the tropical atmosphere-ocean system, Proceedings of a conference on the TOGA
Coupled Ocean-Atmosphere Response Experiment (COARE), WCRP-
107, 59-69, 1999.
Vialard, J., C. Menkes, J.-P. Boulanger, P. Delecluse, E. Guilyardi and M. J. McPhaden, Oceanic mechanisms driving the SST during the 1997- 1998 E1Nifio, J. Phys. Oceanogr., in press, 2001.
Vialard, J., and P. Delecluse, An OGCM study for the TOGA decade. Part I: Role of salinity in the physics of the western pacific fresh pool. J. Phys. Oceanogr., 28, 1071-1188, 1998a.
Vialard, J., and P. Delecluse, An OGCM study for the TOGA decade. Part If: Barrier-layer formation and variability, J. Phys. Oceanogr., 28, 1089-1106, 1998b.
Yu, L. and M. Rienecker, Evidence of an extratropical atmospheric influence during the onset of the 1997-1998 E1 Nifio, Geophys. Res. Letters, 25 (18), 3537-3540, 1998.
J.-P. Boulanger, E. Durand, C. Menkes, P. Delecluse, M. Imbard, M. Lengaigne, G. Madec and S. Masson, Laboratoire d'Oc6anographie Dynamique et de Climatologie, UMR CNRS/IRD/UPMC, Universit6 Pierre et Marie Curie, Tour 26/Etage 4/Case100, 4 Place Jussieu, 75252 Paris, Cedex 05, France. (e-mail: jpb, durand, menkes, pna, mi, lengaign, gm or smasson@lodyc.jussieu.fr)
J.-P. Duvel, Laboratoire de Meteorologie Dynamique, ENS, 24, Rue Lhomond, 75231 - Paris Cedex 05, France. (e-mail: jpduvel@lmd.ens.fr) (Received August 23, 2000; accepted January 2, 2001)