Design and Modeling of a PZT Thin Film Based
Piezoelectric Micromachined Ultrasonic Transducer
(PMUT)
by
Katherine Marie Smyth
B.S., Massachusetts Institute of Technology (2010)
Submitted to the Department of Mechanical Engineering
in partial fulfillment of the requirements for the degree of
Master of Science in Mechanical Engineering
at the
MASSACHUSETTS INSTITUTE OF TECHNOLOGY
MASSACHUSETTS INST E OF TECHNOLOGY
JUN 28 2012
LIBRARIES
ARCHIVES
June 2012
@
Massachusetts Institute of Technology 2012.
Author...
All rights reserved.
Department of Mechanical Engineering
May 11, 2012
Certified by ...
Professor
/
Sang-Gook Kim
of Mechanical Engineering
Thesis Supervisor
A ccepted by ...
...
David E. Hardt
Chairman, Department Committee on Graduate Theses
Design and Modeling of a PZT Thin Film Based Piezoelectric
Micromachined Ultrasonic Transducer (PMUT)
by
Katherine Marie Smyth
Submitted to the Department of Mechanical Engineering on May 11, 2012, in partial fulfillment of the
requirements for the degree of
Master of Science in Mechanical Engineering
Abstract
The design and modelling framework for a piezoelectric micromachined ultrasonic trans-ducer (PMUT) based on the piezoelectric thin film deposition of lead zirconate titanate
(PZT) is defined. Through high frequency vibration (1-16MHz) of a thin plate, the PMUT
transmits and receives pressure pulses to construct medical ultrasound images as an alter-native to bulk piezoelectric transducers currently in use. Existing transducers are difficult to fabricate and lack the small scale necessary for small form factor, high resolution 2D imaging arrays. From acoustic priniciples, the potential PMUT acoustic pressure output is determined and compared to a radiating rigid piston model. Acoustic pressure is shown to scale with the volumetric displacement rate, which is related to the plate deflection. A Green's function approach is then used to explicitly solve for the plate deflection of a bi-morph and unibi-morph PMUT with an arbitrary number of circular or ring electrodes. The resulting solution is much simpler and more flexible than previously published solution tech-niques enabling the optimization of electrode configuration for large deflection and acoustic pressure. Additionally, the contribution of residual stress is examined; particularly its effects on bandwidth, sensitivity, and resonant frequency and an appropriate electrode coverage of the PMUT plate is suggested. Based on modelling, an initial PMUT design is proposed and is currently being fabricated.
Thesis Supervisor: Sang-Gook Kim
Title: Professor of Mechanical Engineering
Acknowledgments
There are many people without whom my master's degree and this thesis would not have been possible. First, I would like to thank my advisor Professor Kim for his guidance throughout the past year. His big picture insight and industry background has given me a practical perspective in addition to his technical knowledge, which has taught me a great deal about design and research. I look forward to continuing to work with and learn from him in the future.
I would also like to thank my labmates Heonju Lee, Steve Bathurst and Ray Xu, and our Masdar collaborator, visiting professor Firas Sammoura. I truly appreciate all of the helpful suggestions and guidance that they have provided regarding fabrication and research. As a senior member of the lab, I am especially greatful for Steve's help - he is always available to answer questions and offers to aid in fabrication and other challenges. I would not have been able to make it as far as I have on the project without his insight. Getting started on a project and finishing a Master's thesis in one year is not an easy feat. The intial groundwork performed by Firas and his guidance early on and throughout this year on the PMUT project has been invaluable. I am very greatful for this positive collaboration and support. I would also like to thank Ray Hardin for his administrative work.
The support of the Microsystems Technology Laboratories staff has also been invaluable so far on this research effort. In particular, Dennis Ward has taught me almost all of what I know about practical fabrication and getting things to work using tricks in the MTL. I am also grateful for the training I have received from Dave Terry, Eric Lim, Bernard Alamariu, and Paudely Zamora. I would like to thank Vicky Diadiuk for giving me a chance to start fabrication work early in the MTL based on my sparse fabrication knowledge and faith. Without this added time, the current fabrication progress would not have been possible.
Finally, I would like to thank my mother, father, my brother Jason, and friends for their emotional support. To my mother and father, I cannot imagine growing up in a more supportive household and I am grateful for all of your love. When I am stressed, happy or unhappy, I always feel comfortable talking to both of you and you never manage to miss an
Contents
1 Introduction 25
1.1 Research Objective... ... 28
2 Background 31 2.1 M edical Ultrasound Imaging . . . . 31
2.1.1 History ... ... 31
2.1.2 Basic Ultrasound Physics and Imaging ... 34
2.1.3 Trends toward 3D Imaging ... 41
2.1.4 Bulk PZT Transducer Fabrication . . . 43
2.1.5 Transducer Developments . . . . 45
2.2 Capacitive Micromachined Ultrasonic Transducers (CMUTs) . . . . 47
2.2.1 History and Overview . . . . 47
2.2.2 Fabrication . . . . 48
2.2.3 CM UT M odelling . . . . 51
2.2.4 Recent Innovations . . . . 53
2.2.5 Lim itations . . . . 54
2.3 Piezoelectric Micromachined Ultrasonic Transducers (PMUTs) . . . . 63
2.3.1 Overview of Previous PMUTs . . . . 63
2.3.2 Fabrication . . . . 67
2.3.3 Device Characterization . . . . 69
3 Design and Modelling 77
3.1 Design Framework ... ... 77
3.1.1 Determination of Design Parameters ... 81
3.2 PM UT Plate M odeling ... . 94
3.2.1 Classic Plate Theory [48] ... . 94
3.2.2 Homogeneous Solution ... 100
3.2.3 PMUT Clamped Plate Resonance Example ... 103
3.3 Ultrasonic Acoustics ... 106
3.3.1 W ave Equation [43] ... 106
3.3.2 Acoustic Pressure Output of Vibrating Circular Plate [43] ... 109
3.3.3 Numerical Solution of Acoustic Pressure . . . 110
3.3.4 Acoustic Pressure Comparison between Potential PMUT Designs . . . 112
3.4 Green's Function Solution . . . 114
3.4.1 Derivation of Governing Plate Vibration Equation . . . 114
3.4.2 Bimorph Vibration Equation . . . 117
3.4.3 Unimorph Vibration Equation . . . 118
3.4.4 Arbitrary Electrode Configuration . . . 120
3.4.5 Definition of Green's Function . . . 122
3.4.6 Arbitrary Electrode Green's Function Solution . . . 124
4 Results 129 4.1 M odel Validation . . . 129
4.1.1 Acoustic Pressure . . . 129
4.1.2 Deflection Model Verification . . . 130
4.2 Electrode Configuration Optimization . . . 130
5 Fabrication 135 5.1 Current Progress . . . .. . . . 135
5.1.2 Bottom Electrode Lift-Off . . .. . . . .137 5.1.3 PZT Processing . . .. . . . .139 5.2 Next steps . . . .. . . . . .. . . . .. 142 6 Summary 145 6.1 Conclusions . . . .. . . . .145 6.2 Future W ork . . . .. .. . . . . .. . . . .147 9
Y MKfTFee
sawmaWNeme
asetas
awma
List of Figures
2-1 Array types used for imaging different parts of the body [30] . . . . 36
2-2 Diagram of 1D transducer slicing. Elements have pitch p, width w and length 1 [5 6 ]. . . . . 4 5 2-3 Ultrasonic transducer equivalent circuit model based on lossless system with deflection in plate mode [32] . . . . 55
2-4 Cross-section diagram of CMUT [11] . . . . 56
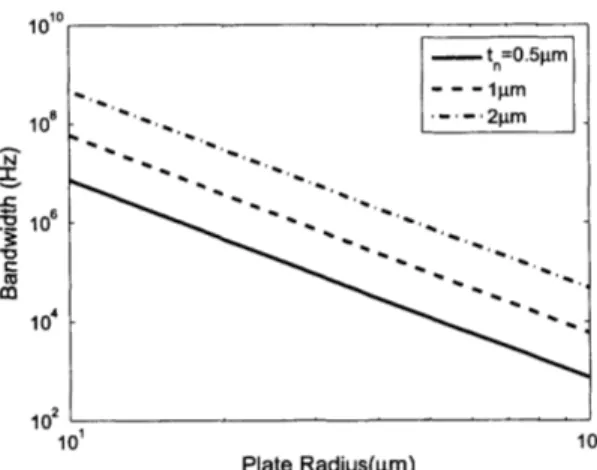
2-5 Bandwidth as a function of plate radius for various membrane thicknesses. . . 57
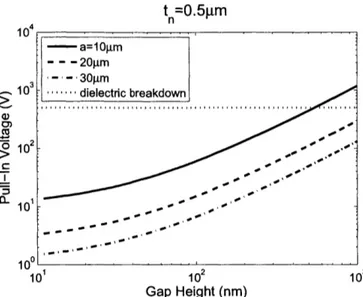
2-6 Pull-in voltage related to gap height of a 500nm thick plate for different plate radii. Dielectric breakdown voltage plotted based on the dielectric strength of silicon nitride. . . . . 59
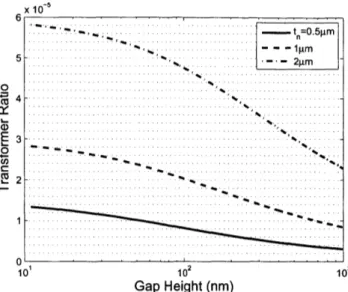
2-7 Transformation ratio as a function of gap height for various plate thicknesses. From Equation (2.13) and the definition of n in 2.2, the transformation ratio is independent of radius near the pull-in voltage. . . . . 60
2-8 Relations between non-dimensionalized values of stiffness kef f/k, restoring force kej f/k (1 - (), and displacement ( 1 -- x/ta. Negative values based on the sign convention of the deflection. Maximum values described above based on absolute value. . . . . 62
2-9 Cross-section of typical PMUT device design . . . . 65
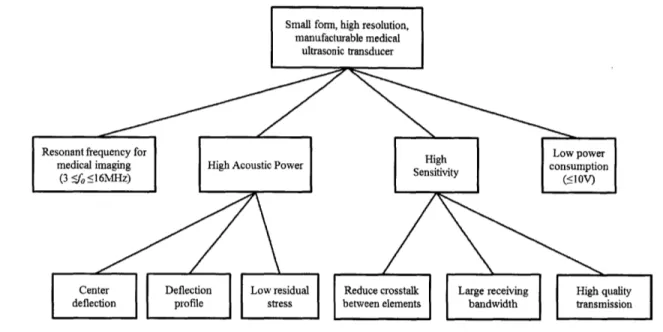
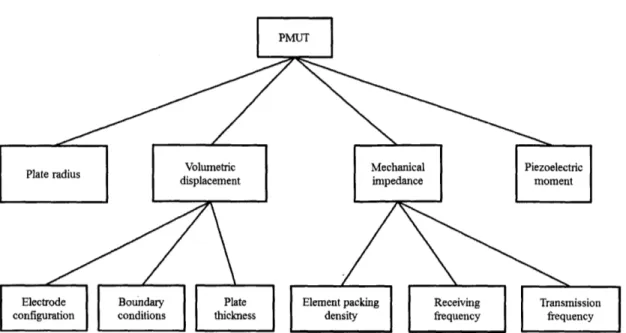
3-1 PMUT functional hierarchy . . . . 78
3-3 Unimorph stack with n with jth layer having thickness hi at a distance zi from
the reference zo = ho = 0 . . . . 83
3-4 Values of _y2 for various boundary conditions [10]. Boundary condition abbre-viations specified in Table 3.1. . . . . 86
3-5 Fundamental frequency based on loaded and unloaded conditions and resonant frequency. Values of
-2
taken from [10] . . . . 883-6 Quality near resonance for
f
< folld based on residual stress. Values shown are for a single layer silicon plate with a = 50pm and hsi = 4pm. . . . . 923-7 Mechanical impedance based on residual stress with 3-dB bandwidth indicated by gray lines. Values shown are for a single layer silicon plate with a = 50Pm and hsi = 4pm .. . . ... ... 93
3-8 Schematics showing coordinate system and geometry of plate displacement . . 96
3-9 Forces and moments acting on an infinitesimal volume element . . . . 98
3-10 Various vibration modes (m, n) of clamped, circular plate [7] . . . 102
3-11 Non-dimensionalized first mode deflection profile . . . 104
3-12 Optimal plate dimensions for various resonant frequencies . . . 105
3-13 Point source geometry of acoustic radiation from a rigid plane boundary . . . 108
3-14 Non-dimensional deflection profile (black) and circular arc fit of deflection profile (blue) . . . 112
3-15 Acoustic Pressure scaling for circular plate with radius a = 50pm resonating at 3MHz with plate thickness set by 3.51 . . . 113
3-16 Basic schematic of PMUT design configurations . . . 116
3-17 Unimorph PMUT with N circular/ring electrodes in d31 mode . . . 121
4-1 Schematics of representative unimorph PMUT test case with specified dimen-sions and m aterials. . . . 130
4-2 Plots of PMUT deflection for geometry pictured in Figure 4-1 for 1st mode and
the first 15 axisymmetric modes (n=15 in equation 3.132). Additional modes added to energy-based derivation by summation similar to that in equation
3 .13 2 . . . 13 1
4-3 Maximized deflection based on electrode geometry determined through
Mat-lab SQP optim ization . . . 132
4-4 Deflection profile with one electrode for maximized deflection and acoustic pressure ... ... 133
5-1 Microscope images of top side alignment marks . . . 137
5-2 Image reversal resist profile and lift-off . . . 138
5-3 Microscope pictures of spin coated PZT after pyrolysis . . . 140
5-4 Square root intensity scaling of XRD raw data with superimposed platinum and perovskite PZT peaks. Numbers on peaks indicate crystal orientation of PZT... ... 141
5-5 Peak matching data with measured XRD peaks on top and perovskite PZT and platinum peaks underneath. Perovskit PZT and platinum match all of the recorded peaks in the XRD data. . . . 141
5-6 Cross-section views of PMUT device throughout fabrication process. Starting from top left and proceeding left to right down the page: oxide growth, bottom electrode lift-off, PZT after wet etch, top electrode lift-off, and back side DRIE144
List of Tables
2.1 Acoustic impedance of water and in various parts of the body [30] . . . . 38
2.2 Approximate equivalent circuit values for CMUT with material properties: dielectric permittivity of gap co and membrane Er, Youngs modulus Y, and poissons ratio 1/ [32], [38], [11] . . . . 56 2.3 Resonant frequency equations and error between analytical and
experimen-tal solution [29], [44], [53], [62], [18], [60], [16]. Variables defined as follows:
flexural rigidity D, tension T, plate radius/square side length a, first mode circular constant a, first mode square constant 3, membrane mode m, plate mode p, plate density p, plate thickness h . . . . 70
2.4 Coupling coefficients for various PMUT designs [44], [5], [16], [60] [53] . . . . . 71
3.1 Abbreviations for boundary conditions shown in Figure 3-4 . . . . 86 5.1 Fabrication Process steps. Steps above the bold line have successfully been
Nomenclature
Latin Letters
A constant related to average or maximum plate displacement
a plate radius
a' inner radius of electrode a" outer radius of electrode
B constant in plate deflection equation
cE compliance
Co parasitic capacitance
Cm plate stiffness capacitance
cm speed of sound in imaging medium
D flexural rigidity when referring to plate bend-ing, electrical displacement in piezoelectric constitutive relations
dai transverse piezoelectric constant d3 3 longitudinal piezoelectric constant
E electric field EL electrical loss
Fe electrostatic force
fa anti-resonant frequency
fd doppler frequency shift
fr resonant frequency
ft transmit frequency
h plate material thickness
I acoustic intensity
Io moment of inertia
I2 second moment of inertia
IL insertion loss
K kinetic energy
k wave number
ki, k2 constants in stressed plate mechanical
impedance equation
kc coupling coefficient
km plate stiffness
keff effective stiffness including spring softening
L distance between source Ro and target R - Ro
1 element length
L' distance between source R' and target R - R'
M bending moment
ma added mass
M, plate mass
N normal force in plate bending, number of circular/ring electrodes in Green's function derivation
p acoustic pressure, element pitch when refer-ring to transducers
Pw magnitude of harmonic pressure independent of time
Q
quality factor in Chapter 2, axial stiffness co-efficient in Chapter 3q multiplicative pressure scaling factor
R distance from source used to calculate acoustic pressure
R1 point source location symmetric to Ro about the z-axis
Ro point source location
ro, 0 coordinate system along plate used in Green's function derivation
Ra acoustic resistance
Rm mechanical resistance SE stiffness
n transformer ratio in Chapter 2, number of ma-terial layer in Chapter 3
T membrane tension
t time
ta gap height
tn membrane thickness
TL transmission loss
(Ur, u0, uz) plate displacement field Ue parasitic capacitance energy
uz time dependent plate displacement velocity
Uw harmonic plate displacement velocity indepen-dent of time
V voltage
v blood flow velocity VP1 pull-in voltage
W acoustic power in Chapter 2, potential energy in Chapter 3
w element width in Chapter 2, plate displace-ment in Chapter 3
x CMUT displacement
Xa acoustic reactance
Xm mechanical reactance
Y Young's modulus
z height of material layer with respect to bottom of stack
Za general acoustic impedance
Zm stressed plate mechanical impedance
ZN neutral axis height measured from plate bot-tom
Zml acoustic impedance of matching layer zus acoustic impedance of tissue
Ztrans acoustic impedance of transducer
Abbreviations
1D, 2D, 3D one-, two-, three-dimensional
AIUM American Institute of Ultrasound in Medicine
AlN aluminum nitride
B-mode brightness mode imaging BOE buffered oxide etchant
CMOS complementary metal oxide semiconductor
CMUT capacitive micromachined ultrasonic
trans-ducer
CT computed tomography
DP design parameter
DRIE deep reactive ion etch FR functional requirement
HF hydrofluoric acid
KOH potassium hydroxide
LPCVD low pressure chemical vapor deposition LTO low temperature oxide
MRI magnetic resonance imaging
PECVD plasma enhanced chemical vapor deposition
PMUT piezoelectric micromachined ultrasonic
trans-ducer
POSFET PVDF metal oxide semiconductor field effect
transistor
PVDF polyvinylidene difluoride
PZT lead zirconate titanate
SOI silicon-on-insulator
SQP sequential quadratic programming
ZnO zinc oxide
Greek Letters
a frequency constant for first vibration mode of circular plate
#3
x (R)
VAW
Af
t-' 600 Er (Err , Eg , Ezz ) 7 (7Yro,72Y.0,7-rz ) A p 0vibration constant: for first vibration mode of
square plate in Chapter 2, clamped circular plate in Chapter 3
particular solution for green's function non-dimensionalized residual stress angular frequency bandwidth
bandwidth
dielectric constant measured at constant strain dielectric permittivity of free space
relative dielectric permittivity of membrane transmit energy efficiency
plate longitudinal strain field
constant from plate vibration equation plate transverse strain field
numerical constant for criticial buckling stress wavelength
poisson's ratio
plate surface mid-plane
characteristic shape profile for vibrating clamped, circular plate
plate material density density of imaging medium residual stress
doppler imaging angle angular frequency
Superscripts
' unimorph or arbitrary layer stack
(0) membrane strain contribution
(1) flexural strain or curvature contribution
* critical value
a residual stress
Subscripts
01 first or fundamental vibration mode
e shape profile dependent on cos (mO) or piezo-electric constant
i stack layer
k electrode
m membrane when referring to previous PMUT resonant frequencies otherwise radial vibration
mode
N neutral axis
n vibration mode in 0 direction
o shape profile dependent on sin (mO)
p plate when referring to previous PMUT res-onant frequencies otherwise piezoelectric in-duced
o- related to 0 dependence of shape profile, stress when referring to plate bending
Chapter 1
Introduction
Considering its relatively brief history, medical ultrasound imaging has made staggering advances in the past 50 years. Starting as an idea inspired by radar and sonar from the military, the first interest in ultrasound's use for therapeutic applications was reportedly in the early 1950's [2]. Later in the decade, one-dimensional ultrasound diagnostic tools had already been developed and showed the ability to monitor heart valves and detect stomach cancer. It was not long into the next decade before the first two-dimensional bright mode (B mode) imaging, which forms the basis for many modern medical ultrasound imaging techniques, had been demonstrated and the diagnostic applications further broadened. Con-ventional ultrasound uses a short ultrasonic pulse (usually a few MHz) to transmit waves into the imaging medium. The incident pulse reflects off features in the human boday and the timing between the incident pulse and the one received by the transducer determines the feature depth. In brightness mode imaging, the relative intensity of the received signal determines the image brightness and a two-dimensional image can be constructed.
Since the 1960's, medical ultrasound sound has found uses in therapeutics through laser ablation and other surgical techniques and in diagnostics, with doppler imaging to measure blood flow, elastography commonly used for breast cancer detection, and three-dimensional fetal imaging [8], [30], [56]. Applications are ever expanding and the enumerated list is hardly exhaustive. In recent years, increasingly improved software capability has resulted
in advances in image construction through electronic beamforming - leading to drastic im-provements in focus and increasing image acquisition speed.
When examined in parallel to ultrasound imaging advances, the developments in trans-ducer technology has remained relatively stagnant over the past five decades. Initial tech-nology, enabling one-dimensional imaging, used a single element of the bulk piezoceramic material lead zirconate titanate (PZT) for transduction. Manufacturing advances have en-abled miniaturization of these elements, which can be assembled into one-dimensional arrays to produce higher resoluation, two-dimensional images. Current fabrication begins when a backing, electrodes, PZT and matching layers are bonded and then manual diced into ele-ments. The elements are then fitted with a lens and another backing layer for damping before final assembly into the ultrasound probe. All of these steps require an immense amount of manual labor, which leads to low yield and makes assembly expensive and inefficient. The latest beamforming techniques for 2D arrays to passively acquire 3D images (other 3D imag-ing techniques rely on controlled mechanical manipulation of a 1D array) require a large number of elements and even more intricate assembly.
Given this difficult fabrication process, producing such arrays is not practical or feasible on a large scale. In addition, assembly also limits element sizes and spacing between elements to slightly less than 1mm introducing interelement cross-coupling issues [25], [54], [34]. If as-sembly did not already limit the possibility of 2D array construction, size constraints would make the arrays bulky preventing use in intravenous surgical applications like angiography. Beyond fabrication, the physics of imaging prevent the bulk PZT transducer from achiev-ing high sensitivity. The impedance mismatch between the elements and imagachiev-ing medium introduce significant losses that can be improved with matching layers but still constrain
bandwidth to 60% [56].
Smaller elements with high packing density and low mechanical impedance that can be easily and inexpensively manufactured are necessary for newly developed advanced imaging techniques to be fully realized. Such miniaturization needs lead naturally to a microfabrica-tion. The latest, fundamental shift in transduction design is the capacitive micromachined
ul-trasonic transducer (CMUT). The CMUT uses an electrostatic actuation and sensing scheme with a plate geometry separated from the substrate by a vacuum gap. Changes in the electric field across the gap generate mechanical movement of the plate for actuation and the opposite effect is utilized for sensing. At small length scales, the electric field is large enabling high sensitivity not feasible with a macro-scale electrostatic device. Small plate mode operation significantly reduces mechanical impedance resulting in remarkably high bandwidth without the need for matching layers [35]. Conventional microfabrication is used construct CMUT element with sizes and spacing on the order of 50[tm creating significantly smaller arrays. With the CMUT, 2D arrays can be more easily manufactured at a much smaller length scale making high resolution 3D imaging and small form factor probes possible. 2D and 3D images have already been demonstrated with CMUT technology and the latest developments are in the incorporation of CMUT devices onto catheter tips as a surgical tool [34].
With the CMUT's success, there are still some drawbacks inherent to a capacitively driven design. A high bias voltage is required for operation stressing the material to the point of electrical breakdown and creating safety concerns. Higher sensitivity is achieved with reducing gap size to the limits of microfabrication capabilities, which constrain plate deflection and reducing the output acoustic pressure. The necessity of a non-linear drive voltage also introduces complexity into operation as conventional transducers respond to linear drive voltages. As such, existing electronic drive technology would have to be altered complicating the electrical system design. As solutions to these problems, piezoelectric micromachined transducers have be introduced as an alternative, microfabricated design solution. Such devices respond linearly to drive voltage, do not require high voltage, and their deflection and fabrication is not constrained by gap size. A similar plate mode actuation to that of the CMUT again lowers impedances making high bandwidth possible.
Despite its promise, most fabricated PMUTs fail to meet performance expectations. Cou-pling between the electrical and mechanical domain is generally much smaller than pre-dicted [44], [5], [16], [53], [60], and sensitivity, especially in transmission, is so poor that researchers have turned to separate devices for transmission [9] or suggest that alternative
applications, not involving ultrasound transmission, would be best for implementation [44]. Many of these shortfalls are attributed to residual stress [44], [29], which has been alleviated through a partially suspended boundary condition [26], [44]. Up to this point, design opti-mization, including the realization of a partially suspended boundary condition, has largely been the result of trial and errer since few analytical models exist to predict device per-formance. Attempts have been made to solve for device deflection [45], [53], [44] but the resulting solution is complex in most cases requiring numerical integration making it difficult to use for design optimization. Analytical models have yet been published for addressing the residual stress problems and defining an equivalent circuit creating further barriers to appropriate PMUT design based on modelling.
1.1
Research Objective
We report analytical modelling of acoustic pressure, deflection, and residual stress that can be used to improve the PMUT design process. The effect of residual stress on perfor-mance including bandwidth, sensitivity and resonant frequency is analyzed, and a means for alleviating the problem through optimized electrode coverage is proposed. Separately the potential acoustic pressure output of the PMUT is explored. High acoustic pressure is necessary for applications like intercranial pressure (ICP) monitoring of head injuries. Nor-mally an invasive procedure that requires immense skill by the technician, a high acoustic pressure array could enable easier image acquisition that is non-invasive and high resolu-tion. Potential acoustic pressure output of the PMUT is determined based on fundamental acoustic radiation equations and is compared to an equivalent rigid piston model based on average displacement previously used to describe CMUT pressure [37]. With the framework established to predict acoustic pressure, the design of the PMUT can be tailored for high acoustic pressure applications.
A novel solution technique for deflection is also introduced using the Green's function
approach. A Green's function is defined for the fourth order plate vibration equation for a bimorph and unimorph PMUT based on [43]. With a stepwise defined forcing function
resulting from the applied piezoelectric moment, the overall plate deflection equation is ex-plicitly solved for an arbitrary number of circular or ring electrode geometries. The resulting equation applies to a much larger variety of potential PMUT designs and can be more easily solved compared to previous solutions [44], [45]. Combined with the acoustic pressure anal-ysis, the flexibility of the deflection solution is preliminarily demonstrated to optimize the plate deflection for high acoustic pressure.
From the modelling, a first generation PMUT design is selected and is currently being fabricated. With completion of the first generation device, we hope to prove the model validity and with performance knowledge and modelling expertise, move forward with more advanced designs. Our goal is to provide a more detailed modelling framework to PMUT design for application to the development of small form factor, high acoustic pressure devices. In the future, such a device could enable 3D real time imaging, and for particular applications like ICP, less invasive screening.
Chapter 2
Background
2.1
Medical Ultrasound Imaging
Ultrasound is an attractive medical imaging alternative to magnetic resonance imaging (MRI) and x-ray computed tomography (CT) scanning because of it is comparatively inex-pensive and less harmful to the body [34]. However, the current 3D imaging capability of medical ultrasound devices lack the resolution and image quality of existing MRI and CT scan technology. With one-dimensional transducer arrays, 3D ultrasound is limited by slow image acquisition rates and dependence on operator expertise, which makes constructing a
3D image slow and lacking repeatability. The advent of a new transducer technology has the
potential to eliminate these limitations making 3D real time imaging rapid and repeatable, and expanding the diagnostic applications of medical ultrasound.
2.1.1
History
In many regards, the use of ultrasound for medical applications is relatively young hav-ing only been commercially available for the past 50 years. Before its advent, ultrasound technology had first been developed in 1917 for sonar applications by the military [34]. The story goes that the observation of small fish killed in the wake of ultrasound beams inspired the application of ultrasound to medical therapeutics [61]. Even if this story does is not
entirely true, its suggestion that medical ultrasound was based on borrowed technology is valid. The first medical ultrasound was pieced together from existing sonar, metallurgical and radar systems at the time [30].
According to the American Institute of Ultrasound in Medicine (AIUM), a group of doctors attending a medical conference in 1951 shared a common interest in the use of ultrasound for therapeutics. In subsequent years, this same group formed the basis of the AIUM and medical ultrasound research efforts began to gain momentum. It was not long before the first images, although primitive, were captured. These A-mode and M-mode images were essentially one dimensional and displayed in the form of line plots. In M-mode, the echo amplitude is plotted as a function time and A-mode displays echo amplitude as a function of depth. These imaging techniques were applied to analyzing the human body with promising results. A-mode image scans showed a distinct difference between a normal stomach wall and one with cancer, and M-mode scans could display the motion of the anterior heart valve.
With these rapid results, it is not surprising that medical ultrasound technology became commercially available in the 1960s, and development of the medical technology continued at a similarly fast pace. The 1960s brought the first fully two-dimensional images; first bistable ones in black and white and then gray scale images not vastly different from those many are familiar with today. In 1964, the first commercially available machine produced by Physionic Engineering, Inc. produced bistable images gaining use in obstetrics, and the diagnosis of abdominal and pelvic diseases. With the availability of commercial machines, education and training programs became an important focus for groups like the AIUM.
More advanced imaging techniques and image quality improvements were gradually de-veloped in subsequent decades. In the 1970s, doppler techniques including spectral, con-tinuous wave, and color imaging, and equipment were developed for analyzing blood flow. Additionally, B-mode or brightness mode imaging, which forms the basis and most commer-cial medical ultrasound imaging today was implemented. An example system used B-mode imaging to detect defects in the human eye. By the end of the 1970s, most of the major
building blocks, particularly two-dimensional Doppler and B-mode imaging, that form the base of medical ultrasound imaging today had been established. Subsequent decades saw the expansion and modification of these techniques for new diagnostic and eventually ther-apeutic applications. Based on doppler techniques, power doppler imaging was developed in the 1980s, and B-mode imaging led to advances such as ultrasound mammography and renal cyst imaging in the 1990s. Stemming from ultrasound mammography, elastography, a technique to measure the effective stiffness of imaged masses, was applied to the detection of breast cancer becoming widely available in the 1990s.
The most logical next step from two-dimensional imaging was the realization of surface and volumetric images in three-dimensions. The first grayscale 3D images were demonstrated in the 1980s and implemented for fetal ultrasound in the 1990s. Until now, developments in the technology include improvements in resolution and scanning techniques [2]. As the development of 3D imaging continues, a final step toward 3D real time imaging (or 4D imaging) is the fundamental limit. For 4D imaging to be commercially realizable, scans must be consistent, high resolution, and occur at a fast acquisition rate. As we will show in the following sections, all of these factors are currently inhibited by transducer technology.
Unless significant advances are made to ultrasonic transducers in the near future, 3D imaging resolution improvements will reach a final limit, and 4D imaging will not be possible.
Not just specific to 3D imaging, high resolution is becoming increasing important in newly defined applications. Improved image quality with aberrations present can be achieved through harmonic imaging, which requires high bandwidth to sense frequencies at twice the transmit frequency. New techniques involving the addition of contrast agents including color agents and micro-bubbles [30] for more detailed imaging similarly require high bandwidth. On top of the need for high bandwidth, superficial target imaging requires high frequencies, which again are not compatible with current transducer technology [8]. For now, we will sideline the topic of transducer technology for future discussion, but it is important to remember that significant current and future advances in medical ultrasound will hinge on its advance.
2.1.2
Basic Ultrasound Physics and Imaging
Imaging Types
From the previous discussion of ultrasound's history, we have already introduced some information related to imaging types, but for further understanding, imaging principles will be explained in greater detail. In general, medical ultrasound imaging is based on the transmission of a short pulse, usually in a form similar to a sine wave, at ultrasonic frequencies on the order of 1-20MHz. Human anatomy is detected based on echo from features at various depth in the patient. As the pulse propagates through the human body, it is reflected and scattered from features in the anatomy, the echo, or the remaining reflected signal, propagates back to the imaging array where it is received. Based on the time between signal transmission and reception and the speed of sound in the media, the depth of the feature is determined. The first imaging techniques in A-mode and M-mode were based on this basic concept. A-mode also incorporated the amplitude of the received signal as a function of the depth.
In a sense, B mode or brightness mode is conceptually an extension of A-mode imaging to two-dimensions. The depth of the signal is determined using the same basic concept, and brightness reflects the relative strength of the received signal. For two dimensions, a longer one dimensional array is required to create a higher number of pixels for which the depth and brightness data can be recorded for construction into a 2D image.
Up to this point, it is assumed that the pulse is transmitted and received at the same
frequency, but this is not necessary. As mentioned previously, receiving at harmonics of the transmitted frequency, usually the first harmonic, reduces imaging artefacts such as side lobes and the effects of non-linear wave propagation resulting in a cleaner signal [30]. For a higher signal to noise ratio, imaging at the first harmonic is preferential and is referred to as harmonic imaging.
Also based on B mode imaging, elastography is used to detect breast cancer. In elastog-raphy, a known force is applied to the tissue and a mass of interest, usually a lump suspected of being cancerous, is imaged during the process. The change in dimensions of the image are measured and the strain, stress, and effective elastic modulus of the mass can be determined.
Since cancerous masses differ in stiffness from conventional tissue, the elastogram can then
be used to decide cancer diagnosis based on the elastic modulus of the lump [30].
Similar to elastography, doppler imaging techniques are used in the measurement of a physical property - in this case, blood flow. Velocity measurements are made by taking advantage of the doppler effect. When there is relative motion between a source and observer, the observed frequency relative to the constant frequency of the source changes with motion, commonly referred to as the doppler effect. For analyzing blood flow, the frequency shift fd related to the transmit frequency ft can be recorded to determine the blood flow velocity v based on the imaging angle p:
fd
- 2ftvcosp(2.1)
Cm
where cm is the speed of sound in the imaging medium [30]. Spectral doppler imaging displays the magnitude of the shifted frequency as a function of time with the intensity denoted by gray scale. When the spectral doppler image is superimposed with a B-mode image, color doppler images can be formed. In a color doppler image, the magnitude of the shifted frequency is denoted by the color scale on the two-dimensional image [30], [2]. More advanced forms of doppler imaging based on the same basic equation 2.1 exist, but their discussion will be excluded for simplicity.
Array Types
The first transducers used to construct the one dimensional A- and M-mode images consisted of a single bulk piezoelectric transducer element. For B-mode imaging, multiple, smaller transducer elements arranged in an array provide a two-dimensional image. The array type most commonly associated with fetal ultrasound is the trapezoidal or curvilinear for a wide viewing field. Resolution increases with the number of transducer elements, which is practically constrained by transducer element size and spacing between elements dictated
Heart
(accessed through ribs)
sector
Liver7
radial
sector linear
Femoral artery curvilinear trapezoidal
(entry point for angiography)
Figure 2-1: Array types used for imaging different parts of the body [30]
arrays can have as many as 256 elements but usually contain 128 elements because of element fabrication limitations. Each element is rectangular with typical width dimension of 1.3A, where A is the wavelength of the imaging frequency. This width is selected to create a narrow enough beam for focusing over a variety of angles while allowing for a wide field of view. The length of the element determines focusing ability with depth and is commonly chosen as 30A to enable weak focusing [30]. For imaging in a water medium at 5MHz, the ideal transducer would then have a width of 0.4mm and length of 9mm.
Other array types include linear, sector and radial arrays, which are used for more spe-cialized imaging. Sector arrays are most widely used for cardiac imaging where an entry point between the ribs requires a much smaller array. Additionally, the geometry of the sector array leads to a wide field of view at elevations consistent with the depth of the heart. When surgical applications require imaging internally, radial, linear and sector probes are used again because of their small form factor. In the radial format, the transducer can consist of one array element, which is rotates to construct a two-dimensional radial image [30].
Basic Imaging Physics
Understanding the basic fundamentals of acoustics is important in understanding the appropriate the design of ultrasonic transducer elements and arrays. As discussed in the previous section, acoustics governs the size and configuration of array elements for optimized focusing and field of view. In later sections, the governing acoustic equations and modelling for a particular element will be described in greater detail; however, for now, we will outline the basic acoustic concepts and associated metrics related to ultrasonic transduction. When referring to any type of acoustic wave propagation, the wave number k, angular frequency w, and wavelength A are basic algebraically defined values that are useful in subsequent, more detailed derivations. w = 27rf (2.2) 27r
A
(2.3)A=
Cm (2.4)In the ultrasonic frequency range, the imaging wavelength in water is small ranging from 75pm for the high frequency of 20MHz to 1.5mm at 1MHz. Considering the density Pm of the imaging media, another fundamental value, acoustic impedance za can be introduced:
Za = PmCm (2.5)
Similar to a mechanical and electrical impedance, the acoustic impedance relates an effort (acoustic pressure) to a flow variable (velocity). Acoustic impedance can thus be manipulated
in the same manner as a lumped circuit element when defining an equivalent transduction circuit. For a radiating boundary, the derived impedance is significantly more complex than the one shown above, but this simple definition still proves useful in understanding basic ultrasonic imaging.
In particular, the acoustic impedance mismatch, based on the definition in equation
2.5, is a significant loss mechanism in transmission. Since the acoustic impedance of the
bulk piezoelectric transducer elements is much higher than tissue, approximately 80% of the transmitted signal is lost at the interface between the tissue and transducer. With such a high signal loss, sensitivity can be dramatically reduced. To overcome this loss, quarter wavelength matching layers with impedance zm, = ,zansztis, are added to the transducer
face reduces signal loss. The quarter wavelength refers to the thickness of the matching layer and is chosen for optimal wave reflection and transmission from the matching layer.
A transmitted pulse reverberates within the matching layer interfering destructively when
reflected back to the transducer elements and constructively to form a larger amplitude pulse into the tissue. Multiple matching layers connected in series can reduce the transmitted signal loss to nearly zero [30]. During a fetal ultrasound, the gel applied to the probe tip in contact with the woman's abdomen serves a similar purpose in impedance matching [34]. Similarly, the interface between bone and tissue suffers from high loss induced by acoustic impedance mismatch, so imaging is usually avoided in regions where transmission is required through bone. Hence, sector arrays are implemented for cardiac imaging through placement between the ribs, preventing any signal transmission through bone.
Table 2.1: Acoustic impedance of water and in various parts of the body [30] Tissue Acoustic Impedance (kg m-2
s-1) Water 1.5-106 Liver 1.66-106 Kidney 1.64.106 Fat 1.33.106 Bone 6.47-106
and limits imaging depth. The transmitted beam signal intensity is attenuated exponen-tially with depth into the tissue, and the rate of this decay is related to frequency. Higher frequency pulses are attenuated more quickly at shallower depths making low frequencies more appropriate for deeper imaging applications. As such, ultrasound frequency selection is a compromise between resolution best achieved at high frequencies and attenuation, which is less pervasive at lower frequencies. Superficial imaging, at depths where attenuation is not significant, is commonly performed at higher frequencies (10-15MHz), and imaging of deep organs or tissue is performed at lower frequencies (3-5MHz) [30].
Imaging Metrics
Large signal loss can be avoided with the incorporation of matching layers and the se-lection of an appropriate transmission frequency resulting in increased sensitivity. However, inherent limitations in sensitivity exist based on the transducer design and other loss mech-anisms that are difficult to circumvent. Array bandwidth provides a direct measure of sensitivity and allows for the comparison of a variety of transducer designs and array con-figurations. A high bandwidth is desirable because sensing can be achieved over a wider range of frequencies, and higher axial resolution is possible. With a high enough bandwidth, transmission and receiving can occur at different frequencies enabling harmonic imaging with a single device. Bandwidth is measured from the signal intensity waveform (wither trans-mitted or received) over range of frequencies. Commonly -3 dB bandwidth is reported and refers to the range of frequencies over which the signal intensity is greater than or equal to half the maximum intensity, which occurs at the center frequency [30]. With matching layers, commercial transducers are capable of -3dB bandwidths of over 60% of the center
frequency [30], [56].
Other metrics including insertion, transducer, and electrical loss are commonly reported to describe device efficiency [56]. Insertion loss compares the equivalent circuit power with the resistive load of the transducer to the power in the same circumstances with no transducer present. Insertion loss is a measure of the overall efficiency as opposed to transducer loss,
which measures one-way efficiency. Overall power compared to the power arriving at the acoustic load denotes transducer loss. Through the definition of electrical loss EL, the transducer TL and insertion loss IL are directly related:
TL=EL-IL (2.6)
With relation between electrical, insertion and transmission loss, the effect of the individual loss factors on the whole can be analyzed [56].
Separate from loss and efficiency, output power, intensity and pressure are also critical to device performance. From acoustics, the radiated pressure from the surface is determined in later sections. Here we will assume that the pressure profile is known and determine the power and intensity accordingly. Formally, the definition of intensity
7
is related to the pressure p and the complex conjugate of the propagating wave velocity profile u*:(7)
= Re {pii-} (2.7)Physically, the intensity has direction and is acoustic power over unit area, and can be reduced to:
III
(2.8)
P mCm
The above intensity equation holds true for plane waves and those emitted radially from a point source [1]. From this physical argument, the power can logically formally written:
W=f f
(7).dS
(2.9)
where S is the surface over which the power is to be computed [1]. For medical ultrasound transducers, the output can be measured in terms of power, intensity or pressure. Most commonly pressure values or sound pressure levels are reported; however, the conventions of intensity and power might also be useful. For example, the intensity can be used to determine the acoustic projection of an array, and since the power is not directionally important, it can
be a more universal metric for comparison.
2.1.3
Trends toward 3D Imaging
3D imaging has generated interest as an attractive application for medical ultrasound
for over 20 years [54], [25] especially given the limitations of 2D imaging, which is highly
dependent on the technician limiting image reproducibility. In comparison to CT or MRI technology, ultrasound equipment is less expensive and can acquire images at a faster rate; however, these capabilities do not come without caveats. Ultrasound is sensitive to noise sources inherent in acoustic physics such as aberrations, speckle, and shadowing, which must be overcome to achieve the necessary resolution for real-time 3D diagnostics. As a result, the first research tackling 3D imaging focused on the development of new techniques to reduce and alleviate the effects of acoustic imaging noise including phase correction, elevation focusing and synthetic aperture imaging approaches [54]. Other work ,examined the system level design laying applying existing technology for clinical testing of 3D imaging for radiology and echo-cardiology [25].
Image acquisition can be achieved via mechanical scanning with a 1D array or 2D array construction. Mechanical scanning is performed free hand with the aid of acoustic, magnetic or articulating arm positioner, or with a mechanical localizer using linear, fan or rotational scanning. With mechanical localization, the image third dimension is acquired through a mechanical mechanism that precisely sweeps the ID array. This varies from the free hand positioning, where a technician moves the ID array guided by a positioning feedback system. With either technique, third dimension acquisition adds significant mechanical and control complexity that could be eliminated through use of a 2D array. Image acquisition rate is also limited and is determined by the speed of the mechanical scanning motion.
Volumetric imaging possible with three dimensions can be useful for a variety of applica-tions - many of which require accurate measurement of physical features. Volumetric imaging has been possible with 1D array scanning for intravascular ultrasound. The resulting vol-ume images were acquired for measurement of vascular dimensions and atheroma volvol-ume.
Although measurement of these dimensions was possible, imaging lacked repeatability mak-ing the initial measurement useless without accurate further imagmak-ing for comparison. In
addition, the motional nature of mechanical scanning introduced imaging distortions further limiting imaging accuracy [25].
The inaccuracy and complexity of 1D array scanning could be overcome with an imaging system utilizing a 2D array that requires no moving parts. The acquisition rate with a 2D array can also be much faster and is only limited by acoustic physics, particularly the speed of sound in the imaging medium. A faster acquisition rate means that patient examination time could be greatly reduced. With its potential, it seems surprising that 2D array imaging has not been the dominant approach for 3D imaging. Many authors argue that the largest challenge in the implementation of a 2D array is existing transducer technology [8], [25]. The labor intensive assembly and low yield of the manufacturing process makes large 2D array nearly impossible to fabricate, and the large number of elements create electrical interfacing problems [25], [34]. A larger number of elements require many electrical connections intro-ducing lead bundling difficulties [25] and crosstalk problems [54]. Beyond manufacturing and array interfacing problems, the high acoustic impedance of the bulk PZT limits resolution reducing bandwidth and sensitivity and increasing insertion loss [54]. Given fabrication and electrical crosstalk challenges, 2D array imaging has best been accomplished by undersam-pling of a large number of array elements. However, undersamundersam-pling limits dynamic range making small features difficult to detect and can excite parasitic, lateral vibration modes in
the bulk PZT devices [54].
In addition to the previously mentioned advantages of the 2D array, noise reduction and imaging resolution improvements to existing transducer technology could broaden the range of 3D medical ultrasound applications. For ideal image resolution, 3D images would be constructed from infinitely thin 2D images along the elevation direction. In reality, slice thickness, the width of the beam in the elevation direction, constrains resolution. For a given height, the slice thickness is determined by beam focus. A larger number of elements electronically controlled in 2D would enable focusing over a wide variety of depths, which
is currently impossible with a 1D array even with the addition of a lens. Electronic beam-forming would also enable focusing in directions within the scan plane [54]. With improved focusing, it might be possible to circumvent imaging noise resulting tissue inhomogeneities including aberrations.
Image acquisition, particularly related to the bulk PZT transducer technology, is the major bottleneck in the implementation of high speed, high resolution 3D imaging [25], [34]. With system level research, image processing and visualization is already possible [25] with existing visualization adapted from MRI and CT technology [30]. Construction of sparse 2D
arrays in a research environment has also enabled the development of the necessary beam forming techniques [54]. The development of new applications based on these beamforming techniques and the potential of real time 3D ultrasound place further requirements on the
design of a new transducer. In vivo elastography requires high resolution and repeatability for stiffness measurements in real time. High acquisition rates and high frequencies are necessary to achieve a high signal to noise ratio with a constant depth scan.
2.1.4
Bulk PZT Transducer Fabrication
As is clear by now, for 3D real time and more advanced imaging to be possible, the transducer technology, particularly manufacturing, needs to be altered. The fabrication technique to produce current transducers has already reached a fundamental limit that is a balance between yield, element size and assembly time [34]. Other packaging and integration factors including wire connections and bundling play a role in the final determined array size [54], but in general, the element size and spacing between elements is dictated by the manufacturing process [20].
Since the manufacture of ultrasound transducers is big business, nearly $1 billion annually [34], it is not surprising that many of the details of the manufacturing process is proprietary; however, a general flow of the process can be pieced together from research and ultrasound related publications. Manufacturing begins with producing a slab of piezoceramic material, usually a particular compound of lead zirconate titanate, that is later diced with a diced
with a diamond wire or wheel dicing saw [20], [54]. The piezoceramic is constructed from a powdered form through conventional powder processing and sintering [51]. Typically the material stack of the main array is then assembled and includes the bulk piezoceramic with top and bottom electrodes, impedance matching layers on the front, and a backing material that acts a support in the subsequent dicing step [56]. For appropriate bonding between layers, lapping and polishing are required before stack assembly with epoxy [58], [51] or the
aid of a bonding jig [54].
A diamond wire or wheel dicing saw is used to the separate the elements in the material
stack. The width of the saw, which can be less than 50pm [20], [58], determines the spacing between elements, referred to as kerf. Kerf is not necessarily the same as the cutter width
- for a 45pm blade, a kerf of 150pm has been reported [58]. The periodicity of elements in the array is the pitch, which is simply the sum of the kerf and sliced transducer width [56]. Cross-coupling between elements is determined by kerf and thus width of the dicing blade. Crosstalk can be parasitic in imaging applications, and the kerf should be A/2 to minimize
coupling. For an imaging frequency of 5MHz, this corresponds to a kerf 150pm, which is
just barely possible with a 45pm blade [58]. As a result, it is difficult to fabricate an array with this kerf specification, so cross-coupling is a problem. A more flexible manufacturing process could tailor the spacing between elements to reduce crosstalk without changing the manufacturing process - here again microfabrication proves to be a nice alternative.
Once diced, the one-dimensional array elements are fitted with a lens for focusing, and then additional bonding is required for electrical connections. Before electrical connections are made, the elements are taken off the backing layer support. In some cases, cleaning has been performed to remove unwanted particles remaining from the cutting process [51]. For research applications, elements are bonded with epoxy before electrical connections are made [51], [54], [58]. Presumably this step is added to make the assembly process easier since later processing does not require the manipulation of individual array elements. In industry, a flexible printed circuit is electrically connected to the top and bottom electrodes, and the final device is secured on a new backing layer that provides damping during operation. All of
layers
Elevation
plane
Azimuth plane
Figure 2-2: Diagram of 1D transducer slicing. Elements have pitch p, width w and length
l [56].
the above processing steps describe fabrication of a one-dimensional array. Two-dimensional arrays are constructed in a similar way except additional dicing and bonding steps are required making the process even more time consuming and labor-intensive [51], [54]. After reviewing the process, the amount of manual labor required for assembly is very clear, and it is understandable that such a process could result in low yield, repeatability, and poor quality devices especially with a brittle piezoceramic base material. The constraints inherent in the fabrication process also directly limit the capabilities of the transducer. Specifically, the dicing saw width introduces cross-coupling that reduces sensitivity. An alternative transducer design involving a new and more innovative fabrication process will be crucial to increasing device sensitivity and improving manufacturing yield.
2.1.5
Transducer Developments
The shortfalls of traditional transducer fabrication has understandably spawned interest in alternatives. With the original development of 3D imaging in the 1980's, 2D array fabri-cation has become increasingly necessary making manufacturing even more difficult. In the
early 1980's, transducer improvement focused largely on developing alternative materials to replace the piezoceramic. Plastics like polyvinylidene difluoride (PVDF) and its derivatives were particularly attractive because of their lower mechanical impedance enabling improved impedance matching and low lateral coupling for better sensitivity. High frequency applica-tions were explored for implementation but low capacitance and high parasitic capacitance made the resulting elements difficult to use [61]. Other interest has been in composite or piezo-polymer materials, which do not require dicing. Despite improvements in fabrication, bandwidth is still limited to ~ 60% (similar to bulk PZT transducers with matching layers) and interelement crosstalk is reduced but not eliminated with contributions of < 30dB [13].
More recent work has shifted to PZT thick film deposition techniques again for high frequency applications. High frequency imaging works best for superficial targets and has generated interest for eye, skin and intravascular imaging. Thick PZT films, still thinner than those produced by conventional manufacturing techniques, would naturally resonant at a high frequency while still functioning like a bulk piezoceramic. Large scale use of thick PZT films is limited by the low porosity which significantly reduces coupling, piezoelectric con-stant and dielectric permittivity. For improved film quality, densification can be performed at higher temperatures with unfavorable results. The large change in temperature neces-sary for densification increases residual stress and at high enough temperatures, lead oxide sublimates creating lead deficiencies in the film. New deposition techniques are currently under development to improve film porosity without requiring and elevated temperature step. Electrophoretic deposition, screen printing, and spin coating are plausible alternatives; however, advanced processing techniques still result in lower film quality compared to thin
film deposition [36].
Perhaps the most promising step in next generation transducer design will come with micro-fabrication. At high volume, micro-fabrication is less expensive and naturally sup-ports the needs for smaller transducers for high resolution imaging. At this scale, entirely new transducers designs must be considered and not just improvements to the piezoelectric material properties and deposition. With the right design, micro-fabrication could
![Figure 2-1: Array types used for imaging different parts of the body [30]](https://thumb-eu.123doks.com/thumbv2/123doknet/14680703.559210/36.918.205.709.143.481/figure-array-types-used-imaging-different-parts-body.webp)
![Figure 2-2: Diagram of 1D transducer slicing. Elements have pitch p, width w and length l [56].](https://thumb-eu.123doks.com/thumbv2/123doknet/14680703.559210/45.918.231.637.129.448/figure-diagram-transducer-slicing-elements-pitch-width-length.webp)
![Figure 2-3: Ultrasonic transducer equivalent circuit model based on lossless system with deflection in plate mode [32]](https://thumb-eu.123doks.com/thumbv2/123doknet/14680703.559210/55.918.200.713.150.332/figure-ultrasonic-transducer-equivalent-circuit-lossless-system-deflection.webp)