HAL Id: hal-01186067
https://hal.archives-ouvertes.fr/hal-01186067
Submitted on 25 Aug 2015
HAL is a multi-disciplinary open access
archive for the deposit and dissemination of
sci-entific research documents, whether they are
pub-lished or not. The documents may come from
teaching and research institutions in France or
abroad, or from public or private research centers.
L’archive ouverte pluridisciplinaire HAL, est
destinée au dépôt et à la diffusion de documents
scientifiques de niveau recherche, publiés ou non,
émanant des établissements d’enseignement et de
recherche français ou étrangers, des laboratoires
publics ou privés.
Phonons in the multiferroic langasite Ba3NbFe3Si2O14 :
evidences for symmetry breaking
C. Toulouse, M. Cazayous, Sophie de Brion, Florence Lévy-Bertrand, H.
Barkaoui, Pascal Lejay, Laura Chaix, Marie-Bernadette Lepetit, J. B.
Brubach, Pascal Roy
To cite this version:
C. Toulouse, M. Cazayous, Sophie de Brion, Florence Lévy-Bertrand, H. Barkaoui, et al.. Phonons
in the multiferroic langasite Ba3NbFe3Si2O14 : evidences for symmetry breaking. Physical Review
B: Condensed Matter and Materials Physics (1998-2015), American Physical Society, 2015, 92 (10),
pp.104302. �10.1103/PhysRevB.92.104302�. �hal-01186067�
breaking
C. Toulouse and M. Cazayous
Laboratoire Mat´eriaux et Ph´enom`enes Quantiques UMR 7162 CNRS, Universit´e Paris Diderot-Paris 7, 75205 Paris c´edex 13, France
S. de Brion,∗ F. Levy-Bertrand, H.Barkaoui, and P. Lejay
Universit´e Grenoble Alpes, Institut N´eel, F-38000 Grenoble, France and CNRS, Institut N´eel, F-38000 Grenoble, France
L. Chaix† and M.B. Lepetit
CNRS, Institut N´eel, F-38000 Grenoble, France
Universit´e Grenoble Alpes, Institut N´eel, 38042 Grenoble, France and Institut Laue-Langevin, 6 rue Jules Horowitz,38042 Grenoble, France
J. B. Brubach and P. Roy
Synchrotron SOLEIL, L’Orme des Merisiers Saint-Aubin, BP 48, F-91192 Gif-sur-Yvette c´edex, France The chiral langasite Ba3NbFe3Si2O14is a multiferroic compound. While its magnetic order below
TN=27 K is now well characterised, its polar order is still controversial. We thus looked at the
phonon spectrum and its temperature dependence to unravel possible crystal symmetry breaking. We combined optical measurements (both infrared and Raman spectroscopy) with ab initio calcu-lations and show that signatures of a polar state are clearly present in the phonon spectrum even at room temperature. An additional symmetry lowering occurs below 120 K as seen from emergence of softer phonon modes in the THz range. These results confirm the multiferroic nature of this langasite and open new routes to understand the origin of the polar state.
PACS numbers: 75.85.+t, 78.30.-j, 78.20.Bh
Keywords: Infra red spectroscopy,Raman spectroscopy, phonons, multiferroics
The Fe langasite Ba3NbFe3Si2O14is a fascinating
ma-terial owing to its original chiral and magnetic proper-ties [1–3]. Recently, its THz spectrum revealed a new kind of electro magnetic excitation, exhibiting all the characters of an optical phonon, plus the ability to be excited by the magnetic field of a THz wave [4]. A model involving a helical polarisation has been proposed, in which the symmetry of the crystallographic structure (P321) is reduced. Two transition temperatures are then expected: the first one involving the magnetic order is clearly observed at TN=27 K, the second one involving
the establishment of a static polarisation and therefore the loss of crystallographic symmetry remains controver-sial. While the THz magneto-electric excitation appears below TP=120 K, no structural transition has been
re-ported so far. Moreover, the compound has been shown to sustain a weak static electric polarisation below TN,
but studies differ concerning the direction of this polar-ization [6, 8]. To unravel possible symmetry breaking in this langasite compound, we probed potential struc-tural changes by looking at the phonon spectrum using
∗Electronic address: sophie.debrion@neel.cnrs.fr
†Present address: Stanford Institute for Materials and Energy
Sci-ences, SLAC National Accelerator Laboratory, Menlo Park, Cali-fornia 94025, USA
infrared and Raman spectroscopies. We also confronted our experimental results with first principle calculations.
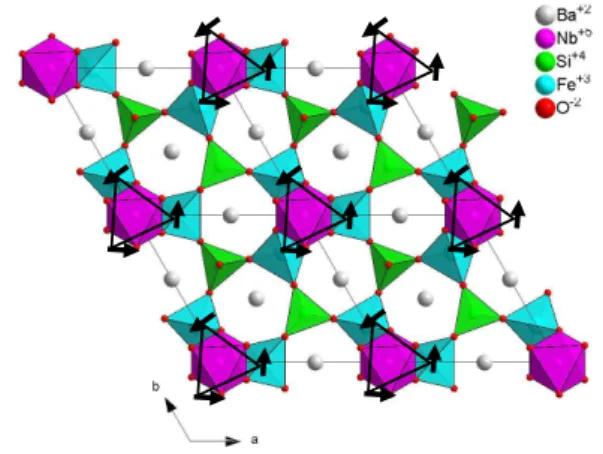
FIG. 1: Ba3NbFe3Si2O14 crystallographic structure and
magnetic order projected along the c-axis. a, b-axes are 2-fold axes while c-axis is the 3-2-fold axis.
Ba3NbFe3Si2O14 crystallises in the P321 space
group [9]. The magnetic Fe3+ ions form a lattice of
tri-angles arranged in a triangular network stacked along the c-axis (see Figure 1) . This space group is non po-lar and contains one 3-fold axis, the c-axis, as well as three 2-fold axes, in the a, b-plane perpendicular to the
2 c-axis. A static polarisation in the a, b-plane is present
only if a symmetry breaking occurs, most probably from P321 to C2, with the loss of the three-fold axis. On the other hand, a static polarisation along the c-axis is not allowed for C2 but possible for P3, the other sub-group of P321 where the 3-fold axis is preserved and no 2-fold axis remains. Finally, in the lowest symmetry, P1, a static polarisation in the a, b-plane as well as along the c-axis is allowed. Optical measurements should be par-ticularly well suited to probe such a symmetry breaking. For P321 symmetry, the 66 optical modes, expected for this compound with 23 atoms per unit cell, consist in 22 E modes that are doubly degenerated, 10 A1modes and
12 A2 modes. Infrared (IR) spectroscopy can probe E
and A2 modes while Raman spectroscopy can probe E
and A1 modes. In C2 symmetry as well as in P3 and P1
symmetry, all 66 modes are no longer degenerated and are all IR and Raman active.
I. LATTICE EXCITATIONS : PHONON MODES
A. Infrared measurements
Infrared measurements were performed using two kind of experimental set-up. Temperature resolved data were recorded from 50 cm−1 up to 700 cm−1 on a powdered sample, using the synchrotron radiation on the AILES beamline at SOLEIL, combined with an IFS 125 spec-trometer and a helium cooled bolometer. The sample temperature was scanned from 8 K to 300 K. Spectra were obtained in the transmission configuration with a resolution of 1 cm−1. The powdered sample was staked between two polymer films stretched on a copper disk with a 4 mm diameter hole. An identical copper disk with polymer film was measured at room temperature and used as a reference to determine the absolute trans-mission T . We present here absorbance data i.e. Abs = −LogT . Single crystal measurements were recorded at room temperature with a vertex 70v spectrometer in a reflection configuration within 10◦ from the normal in-cidence. The refelctivity was measured in two spectral ranges: in the far infrared range, 50-690 cm−1 at 1 cm−1 resolution, we used a mercury lamp, a silicon beamsplit-ter combined with an helium cooled bolomebeamsplit-ter. In the mid infrared range, 560-6000 cm−1at 2 cm−1resolution, we used a globar lamp, a KBr beamsplitter combined with a nitrogen cooled MCT detector. A gold mirror was used as a reference t odetermine the absolute reflection. Two different plaquettes were measured, with the c-axis perpendicular to the plaquette plane (Z configuration) or within the plane (Y configuration). Phonon modes with E symmetry are expected in both Z and Y configura-tion, while A2 symmetry modes should be visible in the
Y configuration only.
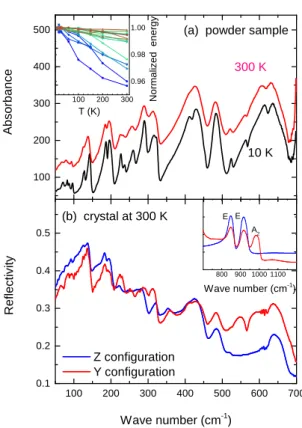
The infrared spectra from 50 cm−1up to 700 cm−1are presented in Figure2 for the powder spectra recorded at different temperatures at SOLEIL as well as for the single
1 0 0 2 0 0 3 0 0 0 . 9 6 0 . 9 8 1 . 0 0 1 0 0 2 0 0 3 0 0 4 0 0 5 0 0 1 0 0 2 0 0 3 0 0 4 0 0 5 0 0 6 0 0 7 0 0 0 . 1 0 . 2 0 . 3 0 . 4 0 . 5 8 0 0 9 0 0 1 0 0 0 1 1 0 0 T ( K ) N o rm a liz e d e n e rg y A b s o rb a n c e ( a ) p o w d e r s a m p l e 3 0 0 K 1 0 K Z c o n f i g u r a t i o n Y c o n f i g u r a t i o n R e fl e c ti v it y W a v e n u m b e r ( c m - 1) ( b ) c r y s t a l a t 3 0 0 K A2 E E W a v e n u m b e r ( c m - 1)
FIG. 2: (a) Infrared Absorbance at 13 K (below TN) and
300 K (above TP) obtained on a powder sample in the energy
range 50 to 700 cm−1 on the AILES beamline at SOLEIL. Insert: Temperature dependence of phonon energy normalised at 13 K. (b) Infrared reflectivity at 300 K obtained on two single crystals (Y and Z configurations) in the energy range 50 to 700 cm−1as well as 700 to 1200 cm−1 (insert).
crystal spectra at room temperature recorded on the Ver-tex spectrometer up to 1200 cm−1. Many phonon modes are visible extending from 70 cm−1 up to 1000 cm−1. The room temperature data from both sets of measure-ments are consistent. The vertex data allow us to iden-tify some A2 and E modes while the synchrotron data
give us the temperature dependence of the whole phonon spectra below 700 cm−1with a high sensitivity. We
iden-tified a total of 30 modes among the 34 expected in P321 symmetry. A close inspection on the powder spectra veals that, the 30 observed total number of modes re-mains constant in the whole temperature range, which extends from well below the magnetic ordering tempera-ture (27 K) to well above the supposed helical polarisa-tion temperature (120 K). Clearly, no signature of sym-metry breaking as a function of temperature is evidenced here.
To further confirm P321 symmetry through the whole temperature range, Raman measurements were per-formed.
B. Raman measurements
Those measurements were performed on the single crystal samples used for reflectivity measurements (Y and Z configurations). Spectra were recorded in a backscat-tering geometry with a triple spectrometer, Jobin Yvon T64000, coupled to a liquid-nitrogen-cooled CCD detec-tor using a Torus 532 solid laser emitting at 532 nm. The high rejection rate of the spectrometer allows to detect low energy excitations down to 5 cm−1. Measurements between 7 and 300 K have been performed using an ARS closed-cycle He cryostat.
Measurements under various polarisation for the inci-dent and scattered light allow to distinguish between E and A1 modes (see Figure 3 for the results at 15 K).
Namely, we expect 54 Raman active phonon modes : 44 E (22 Ex ⊕ 22 Ey) ⊕ 10 A1. Calculated selection rules
using the Bilbao Crystallographic Server Raman tensors appear in Table I for the different polarization configu-ration for the two samples (in the Y and Z configura-tions). These selection rules allowed to assign the sym-metries of the 44 phonon modes observed between 90 and 1000 cm−1: the 10 predicted A1modes and 34 E modes.
Polarization Porto Selected
configuration Notation symmetries
Ei//b, Es//b X∗(Y Y )X ∗ A1 + Ex+ Ey Ei//b, Es//c X∗(Y Z)X ∗ Ex Ei//c, Es//b X∗(ZY )X ∗ Ex + Ey Ei//c, Es//c X∗(ZZ)X ∗ A1
TABLE I: P321 Raman selections rules for the Y configuration crystal.
The assignment of Raman acive phonons are sum-marised in Table II together with the infrared modes. Most of the E modes are observed in both sets of measure-ments as expected, although more modes are evidenced in Raman spectroscopy.
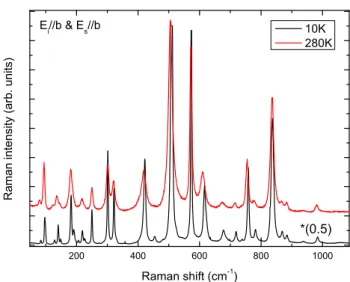
The temperature dependence of the Raman spectrum has been studied from 10 K up to room temperature. Typical spectra recorded at 10 K (below TN) and 280 K
(above TP) are presented in Figure 4. As observed for
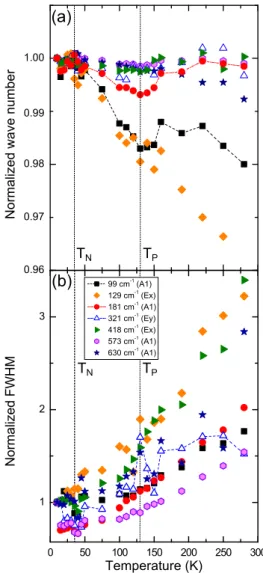
the infrared measurements, the number of Raman modes remain unchanged with temperature changes. Figure5.a shows the energy of the most intense modes normalized by their value at 10 K. Most of them exhibit a hard-ening around 30 K, indicating a sensitivity to the mag-netic transition (TN= 27 K). An additional evolution is
clearly visible: several modes present an unusual soften-ing startsoften-ing at 150 K, followed by a hardensoften-ing around 120 K. This is particularly evident for modes at 99 and 181 cm−1. To complete this observation we have reported on Fig5.b the change in spectral width of these excita-tions (using a lorentzian fit) relative to their values at 10 K. As expected, most of the phononic peaks are thin-ner at low temperature indicating a longer lifetime,
ex-200 400 600 800 1000 R am an In te nsi ty (a rb . u ni ts) Raman shift (cm-1) Ei//c & Es//c Ei//c & Es//b Ei//b & Es//b Ei//b & Es//c A1 A1 A1 Ey Ex Ex Ey
FIG. 3: Raman spectra at 15 K obtained from a single crys-tal (Y configuration) in the energy range 50 to 1100 cm−1 with different polarization configurations. Ei and Es
corre-spond to the electric field of the incident and scattered light respectively. 200 400 600 800 1000 0 20 40 60 80 100 120 140 160 Raman shift (cm-1) 10K 280K *(0.5) R am an in te nsi ty (a rb . u ni ts) Ei//b & Es//b
FIG. 4: Raman spectra at 10 K (below TN) and 280 K (above
TP) obtained on single crystal (Y configuration) in the energy
range 50 to 1100 cm−1.
cept for the mode at 321 cm−1 exhibiting an increase of spectral width around 130 K. The combination of both observations suggests that the compound may undergo a structural transition around 130 K, at TP, when the
magneto-electric excitation has been observed.
Let us now compare our experimental data with cal-culated phonon modes.
4 No rm al ize d wa ve nu m be r 0 50 100 150 200 250 300 0.96 0.98 1.00 0.97 0.99 1
(a)
TN TP Temperature (K) N or m al ize d F W H M Temperature (K) 99 cm-1 (A1) 129 cm-1(Ex) 181 cm-1 (A1) 321 cm-1(Ey) 418 cm-1 (Ex) 573 cm-1(A1) 630 cm-1 (A1)(b)
TN TP 0 50 100 150 200 250 300 1 2 3FIG. 5: Temperature dependence of the phonon energy (a) and spectral width (b), both normalized by their value at 10 K.
II. FIRST PRINCIPLE CALCULATIONS
We used density functional theory (DFT) with the B3LYP [10] hybrid functional to optimize the geometry and compute the phonon spectrum in the P321 space group. Hybrid functionals are known to better treat cor-related systems (such as the present case), since the exact exchange part mostly corrects the self interaction prob-lem and the gap underestimation (known to affect LDA and GGA calculations). The calculation was done with the CRYSTAL [11] code, using 3ζ+p basis set quality for the Fe, O and Si atoms, small core pseudo-potential and associated basis set for the Nb and Ba ions [12]. The opti-mised geometries for all studied space groups compare in a similar way with the experimental data of reference [1] with a maximum displacement of 0.03 located on the oxygen atoms at position O3. The average displacement is less than 0.005 and the degree of lattice distortion is
0.008.
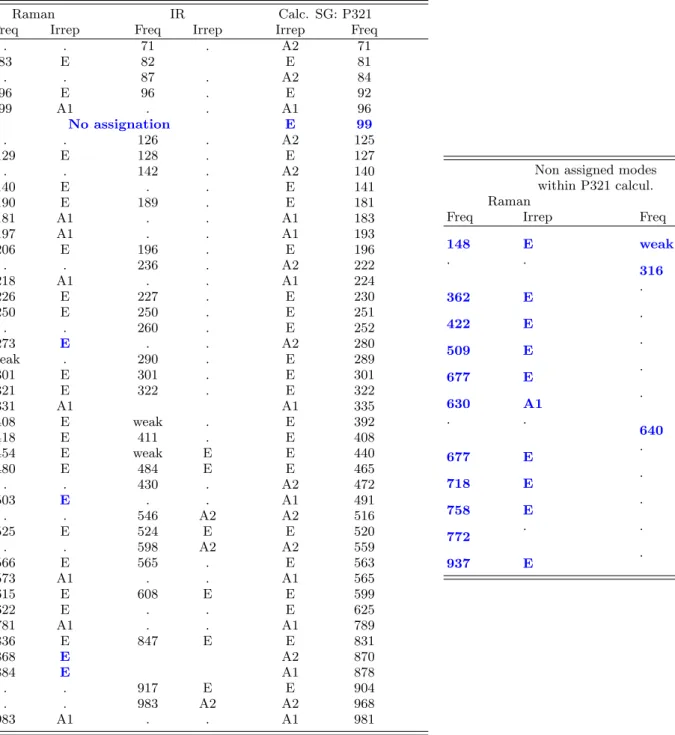
The computed phonons spectrum is reported in Ta-ble II with the experimental assignments in the P321 space group. Among the 66 calculated modes, only one cannot be assigned (99 cm−1). The agreement between optical measurements and calculation seems therefore reasonable since, except for some of the A2 modes for which the difference between the computed and experi-mental frequencies are somewhat larger than usually ex-pected for DFT calculations (∼30-40 cm−1), all other
modes agree within 10 cm−1 with experimental ones. There are however additional non assigned Raman modes (see table II) in addition to the weak modes that may arise from impurities or sample misalignment. Further on, for four observed modes at 273 cm−1, 503 cm−1, 868 cm−1 and 884 cm−1 the wrong symmetry is pre-dicted: E modes according to Raman spectroscopy, while in this energy range only A1 or A2 modes are computed: a A2 mode at 280 cm−1, a A1 mode at 491 cm−1, a A2 mode at 870 cm−1 and a A1 mode at 877 cm−1.
On this basis, it seems clear that the P321 space group must be revisited. A close examination at the non as-signed experimental modes reveals that most of them are very close to a E assigned one. In fact,in the P321 space group, Exand Eyshould be identical and we should only
see 10+22=32 different frequencies in Raman scattering and not 44 as observed. Such a splitting of the doubly de-generated E modes prompt us to abandon the 3-fold axis as a symmetry element. Under this condition the space group should be lowered from P321 to its C2 subgroup. The irreducible representation correspondence between the two groups are as such
P321 C2 A1 → A
A2 → B
E → A + B
TableVreports the phonon modes computed within the C2 group and their experimental assignment. Note that,
within this group, there are two negative phonons fre-quencies in the B irreducible representation indicating that this group is unstable and the C2 symmetry should
also be revisited, at least in the low temperature phase. There are still four computed modes unassigned and a few experimental modes that do not correspond to any calculated frequency (in blue in tableV). We thus com-puted again the phonon spectrum within the P1 space
group (also reported in tableV). As expected, all calcu-lated phonon modes are now found stable. In addition all computed modes can easily be assigned to experimen-tal ones with a good accuracy. Indeed the average error between computed and measured frequencies is within 6.1 cm−1. One should however note that the few exper-imental modes in the 640–770 cm−1 range remain unas-signed.
A few conclusions can be drawn at this point. First, the P321 space group usually assumed in the
litera-ture for this system is not the correct group for the Ba3NbFe3Si2O14 langasite. Indeed, the C3 rotation
around the c-axis is broken, even at room temperature — thus allowing a static polarisation in the (a,b) plane to take place — but also the in plane C2 rotation axis
is expected to be lost, allowing also for a polarisation along the c direction. Even when lowering the symme-try, the calculations could not account for the phonons in the whole frequency range. Since all the other phonon modes are reproduced with a very good accuracy, it is un-likely for the computational technique to be at fault. One should thus look for other reasons. Crystalline phases impurities may be invoked to explain the extra experi-mental modes, however some of the excitations observed in Raman spectroscopy within the 640-770 cm−1 range are very intense. In addition, the 677 and 772 cm1modes
have previously been measured on a different sample by an other group [13]. It is therefore unlikely that impu-rities could explain the experiment-theory discrepancies. The only remaining possibility is that both the initial point group and the unit cell are incorect.
At this point one should remember that the magnetic unit cell corresponds to a c0 = 7c super-cell. We there-fore computed the phonon modes in a double (2c) and triple (3c) cell along the c-direction within the P321 space group. Unfortunately the size of these calculations does not allow to go up to a 7c unit cell or P1 space group. Nevertheless, these calculations clearly show that even in a double or triple unit cell, we still do not find phonon modes in the 640-770 cm−1 range. The spectrum of the triple unit cell however presents the emergence of new phonon modes at very low energy (< 70 cm−1).
We will thus now focus on the low energy part of the phonon spectrum, below (70 cm−1), the calculated cut off energy for the phonons in a single unit cell.
III. LOW ENERGY EXCITATIONS
A. THz measurements
Extension to the lower energy of the infrared spectra was performed on the AILES beamline at SOLEIL on sin-gle crystals using a Helium pumped bolometer with the same experimental conditions as in [4]. Results are pre-sented in Figure 6. Sharp modes are observed between 54 cm−1 and 62 cm−1. Since they are very sharp and
their spectral weight is small compared to the phonon modes above 70 cm−1, we attribute them to localised defects inside the sample or at its surface. Their tem-perature dependence is plotted in Figure7for two differ-ent polarisation of the THz wave. Clearly, the mode at 56 cm−1 splits below TP=120 K, an indication that its
local environment has lowered its symmetry. Such local defects act as a probe of crystallographic changes in the bulk crystal that occur below TP.
At even lower energy, as previously published [4], a magneto-electric excitation is observed below TP=120 K.
5 0 5 2 5 4 5 6 5 8 6 0 6 2 6 4 0 1 2 3 4 5 6 7 8 9 6 K 3 0 K 1 3 0 K A b s o rb a n c e W a v e n u m b e r ( c m - 1 ) 3 0 0 K e / / c
FIG. 6: THz spectra for a single crystal in Y configuration in the energy range 50 to 65 cm−1 on the AILES beamline at SOLEIL. 0 5 0 1 0 0 1 5 0 2 0 0 2 5 0 3 0 0 0 5 0 1 0 0 1 5 0 2 0 0 2 5 0 3 0 0 5 2 5 4 5 6 5 8 6 0 6 2 6 4 6 6 T P e / / c e ⊥ c P h o n o n w a v e n u m b e r (c m -1 ) T ( K ) T N
FIG. 7: Phonon energy measured as a function of tempera-ture for two directions of the THz polarisation.
At 16 K for instance, this electro-active excitation occurs at 29 cm−1 and the magneto-active one at 23 cm−1. Sig-nature of these excitations can also be found in Raman spectroscopy.
6
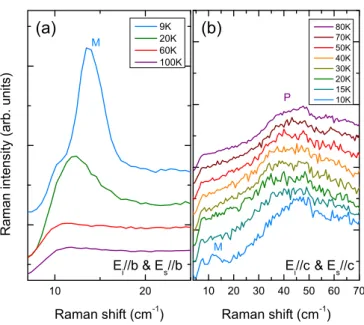
B. Raman measurements
Thanks to our Raman optical set-up, we could mea-sure low energy excitations in the 10 to 70 cm−1 range. The spectra for all polarization configurations in the Y-crystal (back-scattering along the a-axis) are shown on Fig.8. To have a better understanding of the physical nature of these low-energy Raman modes, we also var-ied the temperature between 10 and 100 K, crossing the magnetic transition at TN= 27K. The spectra
temper-ature dependence is reported in Fig.9 for two different polarizations.
At 10 K (Fig.8), an excitation around 12 cm−1, (M), is always present whatever the polarization (with a slight shift), at the same energy as the magnon observed by THz spectroscopy (see Fig.3 in reference [4]). We there-fore assign it to a magnon. This is further confirmed by its temperature dependence (Fig.9)a: as the tempera-ture is increased, it shifts to lower energy and disappears above TN= 27K
Apart from this magnon, other excitations are present: at 29.4 cm−1 and 47 cm−1 for (Ei//c Ef//c), and
weaker modes are obserevd at around 45 cm−1, 50 cm−1 and 62 cm−1 for the other polarization. The mode at 29.4 cm−1, (EM), agrees very well with the electro-magnetic excitation observed in [4]: at the same tem-perature, its electro active part is observed at 29 cm−1. It has been shown that its position does not change substantially with temperature but it disappears above TP=120 K. It is interpreted as a phonon mode
associ-ated to atomic rotations, occuring only below TP=120 K
when a symmetry lowering occurs [4] .
At even higher energy, other excitations are present: at 47 cm −1 for Ei//c Es//c, around 40-50cm −1 and
62cm −1 for the other polarizations. Their tempera-ture evolution is very similar to the electro-magnon at 29.4 cm−1: the excitation (P) at 42cm −1 for instance (see Fig.9b) remains at the same position up to 100 K while its intensity decreases substantially. From all these low energy measurements, we confirm that, below TP=120 K, a symmetry breaking occurs, with several
soft phonon modes emerging in the 25- 65 cm−1 en-ergy range. This symmetry breaking is further evidenced through one narrow phonon mode, attributed to an im-purity, responding to the local symmetry breaking and splits below TP.
IV. DISCUSSION AND CONCLUSION
From the comparison between IR, Raman and theo-retical phonons spectra, its is clear that the P321 space group assumed from X-ray scattering experiments [1, 8] should be questioned. Our work shows that the most probable space group is P1, even if the symmetry break-ing is expected to be weak. Indeed, in the P321 space group, not only many observed modes (13) cannot be as-signed to the computed ones, but four modes (at 273, 503,
10 20 30 40 50 60 10 20 30 40 50 60 70
R
am
an
in
te
nsi
ty
(a
rb
. u
ni
ts)
Raman shift (cm
-1)
Ei//c & Es//cR
am
an
in
te
nsi
ty
(a
rb
. u
ni
ts)
(a)
Ei//b & Es//b Ei//b & Es//c Ei//c & Es//b R am an in te nsi ty (a rb . u ni ts) Raman shift (cm-1 ) 12.6 cm-1 29.4 cm-1 47 cm -1 11.3 cm-1 Ei//b 12.6 cm-1 Ei//c(b)
M
EM
P
M
M
FIG. 8: Low energy Raman spectra obtained for different polarization configurations on the Y crystal at 10 K.
868 and 884 cm−1) detected in Raman scattering as be-longing to the the E irreducible representation can only be assigned to A1or A2computed modes. These
discrep-ancies lead us to abandon the 3-fold axis,and use rather C2 or P1 symmetries. The appearance of computed neg-ative frequencies in the C2 space group suggests that the C2 symmetry is unstable and further symmetry breaking should take place, towards P1 symmetry. Nevertheless, for a large number of modes, the P321 selection rules are nearly respected, showing that the symmetry breaking remains weak. Indeed, using the Bilbao Crystallographic server one finds the maximum distance between the P321 and P1 groups to be only 0.0030˚A and the computed structural lattice distortion estimated at 0.0001.
Nevertheless, this point group symmetry lowering is clearly not sufficient to account for all the experimental observations: five modes in the 640-770 cm−1 range re-main unaccounted for within a simple unit cell. Since we excluded an impurity phase as the origin of these modes, one should thus break the translational symmetry and en-large the unit cell. Calculated phonons spectra in super-cells along the c direction do not however exhibit any sign of new modes in the desired energy range. The only remaining possibility is thus that these modes originate
10 20 30 40 50 60 70 Raman shift (cm-1) 80K 70K 50K 40K 30K 20K 15K 10K M P 10 20 R am an in te nsi ty (a rb . u ni ts) Raman shift (cm-1) 9K 20K 60K 100K Ei//b & Es//b Ei//c & Es//c M
(a)
(b)
FIG. 9: Low energy Raman spectra on the Y sample for sev-eral temperatures taken with the electric field of the incident and scattered light respectively along the b-axis (a.) and the c-axis (b).
from an enlargement of the unit cell in the (a,b) plane, an enlargement present even at room temperature.
At temperatures lower than TP = 120 K, we see
ad-ditional low energy (< 70cm−1) features in the phonons
spectra suggesting a symmetry lowering. First principle calculations in triple-cells along the c axis exhibit new modes in this energy range. This result put into per-spective with the fact that the magnetic unit under TN
is found to be a septuple unit cell along the c axis allow us to propose the following scenario: (i) at room
tem-perature the system crystallises in the P1 group with an enlarged unit cell in the (a,b) plane. (ii) At TP it
un-dergoes a phase transition further increasing the unit cell along the c axis, most probably with an incommensurate vector. Then (iii) at the magnetic transition the latter locks to c’=7c.
In this scenario, the compound can sustain a polarisa-tion, even at room temperature, both in the (a,b) plane and along the c direction. Clearly this polarisation is ex-pected to be faint and difficult to measure, as outlined by the weakness of the predicted symmetry breaking. Since electric domains are likely present, the observed polari-sation may vary from one sample to the other. At lower temperature, when the magnetic order sets in, a coupling mechanism may enhanced the static polarisation that is further enhanced by a static magnetic field [5].
Finally one should point out that the loss of symmetry at room temperature implies that the polar state is not induced by the set in of the magnetic order. The conse-quence is that such crystals can no more be considered as magnetically induced multiferroics and thus the origin of their magneto-electric coupling should be revisited.
Acknowledgments
We acknowledge J. Debray, J. Balay and A. Hadj-Azzem for the powder and crystals preparation. S. de B. and L. C. aknowledge fruitful discussions with R .Ballou and V. Simonet. This work was supported by the French National Research Agency through projects ANR- DY-MAGE, ANR-SUBRISSYME, and ANR-DYMMOS as well as the French General Directorate for Armament (DGA). First principle calculations were done at the IDRIS and CRIHAN computed centers under projects number 91842 and 2007013.
[1] K. Marty et al., Phys. Rev. Lett. 101, 247201 (2008). [2] M. Loire et al., Phys. Rev. Lett. 106, 207201 (2011). [3] V. Simonet, M. Loire, and R. Ballou, Eur. Phys. J.
Spe-cial Topics 213, 5 (2012).
[4] L. Chaix et al., Phys. Rev. Lett. 110, 157208 (2013). [5] L. Chaix et al., submitted.
[6] N. Lee, Y.Jai Choi, and S-W.Cheong, Applied Phys. Lett. 104, 072904 (2014).
[7] C. Lee,E. Kan, H. Xiang and M-H Whangbo, Chem. Mater. 22, 5290 (2010).
[8] H. D. Zhou et al., Chemistry of Materials 21, 156 (2009). [9] B. V. Mill’ et al., Russian Journal of Inorganic Chemistry,
43, 1270 (1998).
[10] A.D. Becke, J. Chem. Phys. 98, 5648 (1993).
[11] R. Dovesi, V.R. Saunders, C. Roetti, R. Orlando, C. M.
Zicovich-Wilson, F. Pascale, B. Cival- leri, K. Doll, N.M. Harrison, I.J. Bush, Ph. D’Arco and M. Llunell, CRYS-TAL09 User’s Manual, University of Torino, Torino, (2009).
[12] Fe, O and Si : M. F. Peintinger, D. Vilela Oliveira, and T. Bredow J. Comp. Chem. 34, 451 (2013) ;
Ba : S. Piskunov, E. Heifets, R.I. Eglitis and G. Borstel, Comp. Mat. Science 29, 165-178 (2004) ;
Nb : S. Dall’Olio, R. Dovesi, R. Resta, Phys. Rev. B 56, 10105 (1997).
[13] M. Hudl, Magnetic materials with tunable thermal, elec-trical and dynamic properties; An experimental study of magnetocaloric, multiferroic and spin-glass materials., PhD Thesis (2012).
8
Raman IR Calc. SG: P321
Freq Irrep Freq Irrep Irrep Freq
. . 71 . A2 71 83 E 82 E 81 . . 87 . A2 84 96 E 96 . E 92 99 A1 . . A1 96 No assignation E 99 . . 126 . A2 125 129 E 128 . E 127 . . 142 . A2 140 140 E . . E 141 190 E 189 . E 181 181 A1 . . A1 183 197 A1 . . A1 193 206 E 196 . E 196 . . 236 . A2 222 218 A1 . . A1 224 226 E 227 . E 230 250 E 250 . E 251 . . 260 . E 252 273 E . . A2 280 weak . 290 . E 289 301 E 301 . E 301 321 E 322 . E 322 331 A1 A1 335 408 E weak . E 392 418 E 411 . E 408 454 E weak E E 440 480 E 484 E E 465 . . 430 . A2 472 503 E . . A1 491 . . 546 A2 A2 516 525 E 524 E E 520 . . 598 A2 A2 559 566 E 565 . E 563 573 A1 . . A1 565 615 E 608 E E 599 622 E . . E 625 781 A1 . . A1 789 836 E 847 E E 831 868 E A2 870 884 E A1 878 . . 917 E E 904 . . 983 A2 A2 968 983 A1 . . A1 981
Non assigned modes within P321 calcul.
Raman IR
Freq Irrep Freq Irrep
148 E weak . . . 316 . 362 E . . 422 E . . 509 E . . 677 E . . 630 A1 . . . . 640 E 677 E . . 718 E . . 758 E . . 772 . . . 937 E . .
Raman IR Calc. SG: C2
Freq Freq Irrep Freq
B -137 B -17 71 B 76 83 82 A 81 87 A 93 99 A 96 96 96 nA 97 B 110 B 116 126 A 124 129 128 B 124 142 B 137 140 A 139 148 weak B 145 B 174 181 nA 179 A 180 190 189 nB 191 A 191 197 196 A 194 206 B 201 218/222 A 223 226 227 A 228 236 B 230 250 250 (B 248 A 249 B 250 260 B 259 273 B 280 290 nA 288 B 290 301 301 A 300 316 B 316 321 322 A 320 331 A 333 362 B 379 A 391 408 411 B 402 418 A 406 422 B 419 430 A 438 454 B 450 A 465 B 469 480 B 473 484 A 488 503 B 515 509 A 517 525 524 B 519 546 B 556 573 A 561 566 565 nA 562 B 563 598 B 591 615 608 A 594 622 B 621 630 A 623 781 A 788 836 A 831 847 B 841 868 B 868 884 A 876 917 nA 905 B 906 937 B 965 983 983 A 978 Raman IR Calc. SG: P1
Freq Freq Irrep Freq
71 A 74 83 (A 82 A 83 A 84 87 nA 93 A 94 96 96 nA 96 A 97 99 A 98 126 A 124 129 128 nA 124 A 124 140 A 139 142 A 140 148 weak A 142 181 (A 179 A 180 A 181 190 189 A 192 197 196 A 194 206 A 196 218 A 222 222 A 223 226 227 A 229 236 A 230 250 250 nA 249 A 250 260 A 250 273 A 279 weak 290 nA 288 A 288 301 301 nA 299 A 301 316 A 319 321 322 A 320 331 A 333 362 nA 392 A 393 408 411 A 407 418 A 408 422 A 439 430 A 440 454 nA 465 A 466 480 A 473 484 A 489 503 A 512 509 A 517 525 524 A 517 546 A 557 566 565 nA 560 A 561 573 A 563 598 A 595 615 608 A 597 622 A 623 630 A 625 781 A 789 836 A 832 847 A 832 868 A 868 884 A 875 917 nA 905 A 905 937 A 963 983 983 A 978
Non assigned modes within C2 and P1 calcul.
Raman freq. IR freq.
. 640
677 .
718 .
758 .
772 .
TABLE V: Calculated (within the C2 and P1 space groups) and measured (IR and Raman) phonons modes. Frequencies are in cm−1.