Design and Acoustic Shielding Prediction of
Hybrid Wing-Body Aircraft
by
Leo Wai-Tsun Ng
Bachelor of Applied Science, University of Toronto (2007)
Submitted to the Department of Aeronautics and Astronautics
in partial fulfillment of the requirements for the degree of
Master of Science in Aeronautics and Astronautics
at the
MASSACHUSETTS INSTITUTE OF TECHNOLOGY
June 2009
@ Massachusetts Institute of Technology 2009.
All rights reserved.
Author ...
...
Department of Aerona
crs and Astronautics
May 22, 2009
Certified by....
...
Zoltan S.
Spakovszky
H. N. Slater Associate Professor
Thesis Supervisor
Accepted by...
MASSACHUSETTS INS E OF TECHNOLOGYJUN 2
4
2009
LIBRARIES
David L.
a mofal
Associate Departmt Head
Chair, Committee on Graduate Students
Design and Acoustic Shielding Prediction of Hybrid
Wing-Body Aircraft
by
Leo Wai-Tsun Ng
Submitted to the Department of Aeronautics and Astronautics on May 22, 2009, in partial fulfillment of the requirements for the degree of
Master of Science in Aeronautics and Astronautics
Abstract
Recent research and developmental efforts in aircraft design have focused on the growing concerns about the environment impact of aviation and the rising costs of fuel. Under NASA's N+2 subsonics fixed-wing project, hybrid-wing-body (HWB) aircraft are investi-gated with the goal to meet the N+2 noise, fuel burn, and emissions requirements. As part of the N+2 program, this thesis is focused on the design and assessment of an HWB aircraft and the development of a prediction method for turbomachinery noise shielding.
Based on MIT's previous experience in the Silent Aircraft Initiative, the SAX-40 aircraft concept was further developed into the N+2 HWB aircraft. The design effort resulted in two aircraft configurations: the N2A aircraft with conventional podded engines, and the N2B aircraft with a distributed propulsion system embedded in the airframe. The initial performance assessment shows that the N2A and the N2B aircraft can both meet the N+2 fuel burn goal and that the N2A aircraft is 5.7 EPNdB short of the noise goal. Also, the assessment revealed that current noise prediction methods cannot model the advanced propulsion system of the N2B aircraft, requiring the development of noise assessment tools for advanced engine-airframe configurations.
NASA's Aircraft Noise Prediction Program employs the barrier shielding method to predict the airframe shielding of engine noise. However, it is an empirical formulation for straight edges and thus it is not appropriate for the planform shape of an HWB aircraft. At the same time, high fidelity methods such as boundary element methods and ray tracing methods are too computationally expensive if used in the early aircraft design and assess-ment stage. A compromise is the previously formulated diffraction integral concept based on the Maggi-Rubinowicz representation of Kirchhoff's diffraction theory. The diffraction integral method was implemented and applied to the N2A and the N2B aircraft. A noise reduction of over 20 dB in OASPL due to airframe shielding was predicted, demonstrating the shielding benefit of the HWB configuration. This shielding method is shown to be applicable to any aircraft configuration and planform geometry.
The contributions of this thesis are the design of an HWB aircraft to be used as a platform for the development and evaluation of advanced analysis methods. In addition, a fast and improved-fidelity method for noise shielding prediction was developed, applicable to conventional and advanced airframe configurations such as, for example, the N2A and the N2B HWB aircraft.
Thesis Supervisor: Zoltan S. Spakovszky Title: H. N. Slater Associate Professor
Acknowledgments
I would like to thank Professor Spakovszky for his guidance and support throughout my graduate studies at MIT. I can always depend on him to take care of his students and provide sound advice. I have learned a lot working with Prof. Spakovszky and it has been a rewarding experience.
I would also like to thank Dr. James Hileman for his help with the project. He is always available to answer questions about the Silent Aircraft Initiative and offer useful suggestions.
I could not have completed the project without my partner, Philip Weed. His willingless to contribute good ideas and help me resolve issues is greatly appreciated.
I have very much enjoyed the company of my officemates and labmates. They are a source of both technical advice as well as much needed distractions throughout the day. Special shoutout to Andreas, Bjorn, Frangois, Hiten, Jeff, Jon, Shinji, Sho, and Tanya for making the GTL a great place to work.
This work is funded by NASA's N+2 Subsonics Fixed-Wing program. I would like to thank Casey Burley, Doug Nark, and Stuart Pope at NASA Langley for their help with ANOPP and for providing the FSC noise shielding data.
Finally, to all my friends at MIT, thanks for making the past two years some of the best experiences of my life.
Contents
1 Introduction
1.1 NASA N+2 Subsonic Fixed-Wing Project .... 1.2 Previous W ork ...
1.3 Thesis Objectives ...
1.4 Thesis Contributions . . . .
2 N+2 Aircraft Definition
2.1 Cambridge-MIT SAX-40 ...
2.1.1 Aircraft Design and Analysis Framework . . . . 2.1.2 Quasi 3-D Aerodynamic Design Method . . . . 2.1.3 Propulsion Weight Scaling . . . . 2.1.4 Structure Weight Response Surface Model . . . . 2.2 Aircraft Definition ...
2.2.1 Comparison between the SAX-40 and the SAX-40F . . 2.2.2 N+2 Hybrid-Wing-Body Configuration: N2A and N2B
3 N+2 Noise Assessment
3.1 FAR 36 Requirements for Noise Certification . . . . 3.2 NASA Aircraft Noise Prediction Program . . . . 3.3 Overview of Noise Sources ...
3.4 Propulsion System Installation Effects . . . . 3.5 N+2 Noise Audit Results ...
3.5.1 N2A Tone-Corrected Perceived Noise Levels
21 . . . . . . 22 . . . . 23 . . . . 24 . . . . . . 25 27 28 29 30 31 33 35 36 37 41 . . . . . . 41 . . . . . 43 . . . . 44 . . . . . 45 . . . . 47 . . . . . 47
3.5.2 N2B Tone-Corrected Perceived Noise Levels . ... 49
3.5.3 Comparison of Effective Perceived Noise Level to N+2 Goal . . 52
4 Acoustic Shielding Prediction 55 4.1 Comparison of Shielding Prediction Methods . ... 55
4.1.1 Boundary Element Method . ... 56
4.1.2 Equivalent Source Method . ... . 57
4.1.3 Ray Tracing Method ... .... 58
4.1.4 Diffraction Integral Method . ... 59
4.2 Derivation of the Diffraction Integral Method . ... 60
4.2.1 Kirchhoff Diffraction Integral ... 61
4.2.2 Maggi-Rubinowicz Transformation . ... 62
4.2.3 Babinet's Principle ... ... 62
4.3 Implementation of the Diffraction Integral Method ... ... .. .... ... 63
4.3.1 Determination of Shielding Object Outline . ... 64
4.3.2 Contour Integral Evaluation . ... 69
4.4 Validation of the Diffraction Integral Method . ... 73
4.5 Acoustic Shielding Results ... ... 77
4.5.1 Comparison between Barrier Shielding, Diffraction Integral, and Ray Tracing ... ... ... 77
4.5.2 Tube and Wing Shielding Prediction . ... 78
4.5.3 N2B Shielding Prediction . ... . 80
4.5.4 N2A Shielding Prediction ... . 82
4.6 Limitations of the Diffraction Integral Method . ... 84
5 Conclusions 87 5.1 Summary of Results ... ... ... .. 87
5.2 Key Contributions . ... . . . . . 88
A Diffraction Integral Method User Manual 91
A .1 File Structure . . . . 91
A .2 Inputs . . . 93
A.2.1 Find Outline ... 93
A.2.2 Calculate Shielding ... 95
A .3 O utputs . . . .. .. . 96
A .3.1 Find Outline ... 96
A.3.2 Calculate Shielding ... 96
List of Figures
2-1 The Silent Aircraft Initiative SAX-40 hybrid-wing-body aircraft . . . 28
2-2 Flowchart of the performance analysis framework . ... 29 2-3 SAX-40F comparison of (a) lift curve, (b) lift-to-drag curve, and (c)
moment curve between the quasi 3-D aerodynamic design method and 3-D viscous CFD (winglets not included) . ... 31 2-4 SAX-40F comparison of pressure coefficient between the quasi 3-D
aerodynamic design method and 3-D viscous CFD (winglets not in-cluded) . . . . .. . . . .. . 32 2-5 Variation in structure weight with respect to (a) propulsion system
weight, (b) fuel weight, (c) wing span, (d) wing area, and (e) payload 34 2-6 Comparison between the SAX-40F and the SAX-40 planform .... . 36 2-7 Comparison of (a) lift-to-drag ratio and (b) spanwise lift distribution
between the SAX-40F and the SAX-40 . ... 37 2-8 Rendering of the SAX-40F based N2A and N2B HWB aircraft [picture
courtesy of D. Odle, Boeing] ... 39
3-1 Tone-corrected perceived noise level for the N2A on approach . . .. 48
3-2 Tone-corrected perceived noise level for the N2A at lateral ... 48 3-3 Tone-corrected perceived noise level for the N2A at flyover ... 49 3-4 Tone-corrected perceived noise level for the N2B on approach .... . 50 3-5 Tone-corrected perceived noise level for the N2B at lateral ... 50 3-6 Tone-corrected perceived noise level for the N2B at flyover ... 51
4-1 Schematic of the fictitious point sources on the object surface in the boundary element method . ... ... 56 4-2 Schematic of the point sources on a smaller auxiliary surface in the
equivalent source method ... ... 57 4-3 Schematic of the two types of rays in the ray tracing method: edge
diffracted rays and creeping rays ... .. 58 4-4 Schematic of the object outline for the contour of integration in the
diffraction integral method ... ... . . 59 4-5 Control surface for Green's theorem behind the screen with an aperture 61 4-6 Illustration of Babinet's principle for complementary screens .... . 63 4-7 Two-part implementation of the diffraction integral method .... . 64 4-8 A hypothetical HWB aircraft with the engine noise source located
be-hind the trailing edge ... ... 65 4-9 Contours tangent to the rays from the noise source for the hypothetical
HWB... ... 66 4-10 Illustration of the projection of a tangent contour onto a spherical
surface centered around the source . ... ... . 66 4-11 Projected contours of the hypothetical HWB in the longitude-latitude
space ... ... . .... ... . 67 4-12 Grid points in the longitude-latitude space for the hypothetical HWB 68 4-13 Final shielding outline for the hypothetical HWB . ... 69 4-14 Illustration of the projection of the object outline and observer points
onto a circular paraboloid ... ... 70 4-15 Illustration of when the integrand singularity occurs and when it does
not occur ... ... 70 4-16 The shielding sphere configuration for the validation of the diffraction
integral method ... ... 75 4-17 Sphere shielding comparison between diffraction integral method,
4-18 SAX-20 shielding comparison between (a) barrier shielding method, (b) diffraction integral method, and (c) ray tracing method by Agarwal et al. [1] . . . . . . .. . . . .. 79 4-19 Outline for the diffraction integral and noise attenuation plot for a
737-sized with the noise source above the wing . ... 80 4-20 Airframe outline and noise attenuation plot for the N2B with winglets 81 4-21 Airframe outline and noise attenuation plot for the N2B without winglets 81 4-22 Noise attenuation along the (a) centerline and (b) sideline for the N2B 82 4-23 Airframe outline and noise attenuation plot for the N2A with vertical
tails . . . .... . . . . . ... . . . ... ... . . . .. . 83 4-24 Airframe outline and noise attenuation plot for the N2A without
ver-tical tails . . . . ... . . . . .. .... .. . . .. . .. . . ... . 83 4-25 Noise attenuation along the (a) centerline and (b) sideline for the N2A 84
List of Tables
1.1 NASA goals for the next two generations of aircraft . ... 22 2.1 Mission comparison between SAX-40F and SAX-40 ... 27 2.2 Aerodynamic data for the SAX-40F and the SAX-40 at the start of
cruise . . . ... . . . .. . . 38 2.3 Weight buildup (in lb) of the SAX-40F and the SAX-40 ... . 38 3.1 Noise source estimation models for N2A and N2B noise assessment . 44 3.2 Noise attenuation estimation models for N2A and N2B noise assessment 45 3.3 Effective perceived noise and FAR 36 Stage 3 noise limits [2] .... . 52
Nomenclature
Abbreviations
ANOPP Aircraft NOise Prediction Program BEM Boundary Element Method
BL Boundary Layer BWB Blended-Wing-Body
CAEP Committee on Aviation Environmental Protection CFD Computational Fluid Dynamics
CMI Cambridge-MIT Institute
EPNL Effective Perceived Noise Level (EPNdB) FAR Federal Aviation Regulations
FSC NASA's Fast Scattering Code for noise shielding prediction GRC NASA Glenn Research Center
HWB Hybrid-Wing-Body
ICAO International Civil Aviation Organization ISA International Standard Atmosphere LaRC NASA Langley Research Center LTO Landing and Take-Off
MTOW Maximum Take-Off Weight
N2A N+2 project hybrid-wing-body aircraft with conventional podded engines N2B N+2 project hybrid-wing-body aircraft with embedded propulsion system NPSS NASA's Numerical Propulsion Simulation software
PNLT Tone-corrected Perceived Noise Level (dB) RANS Reynolds Average Navier-Stokes
RSM Response Surface Model SAI Silent Aircraft Initiative SAX Silent Aircraft eXperimental SPL Sound Pressure Level
UCI University of California at Irvine
Roman Symbols
A area of aperture (m2 ) A surface area (m2 ) A wing area (m2)a reference or characteristic length (m)
Ao area of control surface excluding aperture (m2 )
ci coefficients for structure weight response surface model for i from 1 to 5 CD total drag coefficient
CDf friction drag coefficient
CDi induced drag coefficient CDp pressure drag coefficient
CL lift coefficient
D engine fan diameter (m)
h(l) spherical Hankel functions of the 1 st kind
1 non-singular part of the integrand
12 singular part of the integrand
jn spherical Bessel functions
k wave number (m-')
ML/D flight Mach number times lift-to-drag ratio N number of grid points
Pd diffracted acoustic pressure (Pa)
Pd,A acoustic pressure diffracted through aperture (Pa) Pd,O acoustic pressure diffracted around shielding object (Pa) pi incident acoustic pressure without diffraction (Pa)
Pn Legendre polynomials
F vector from origin to observer (m)
r magnitude of ' (m)
R distance between source and observer (m) s distance along the contour of integration (m) T thrust (N)
V2 reference take-off speed according to FAR 25.107 (knots)
Vref reference landing speed according to FAR 25.125 (knots) Wfuel fuel weight (lb)
Wpay payload weight (lb)
Wprop propulsion system weight (lb) Wstruct structure weight (lb)
x, y, z coordinate system relative to aircraft: x = aft, y = starboard, z = up
7 coordinates of observer (m)
Y coordinates of a point on the contour of integration (m) z coordinates of source (m)
Greek Symbols
P
vector from origin to source p magnitude of 'fChapter 1
Introduction
Although continuing growth in commercial aviation is projected, air traffic is being increasingly restricted by congestion at major airports. This has created demand for a step change in noise reduction for airlines to expand into regional airports and for cargo operators to expand into the night curfew [3]. At the same time, fuel costs and environmental concerns are causing aircraft manufacturers to focus on fuel efficiency in new aircraft designs. In response to these factors, considerable research has been done to reduce aircraft noise and fuel burn.
One such project, funded by the UK government, is the Cambridge-MIT (CMI) Silent Aircraft Initiative (SAI). Its goal was to design an aircraft whose noise outside the airport boundaries is less than the background noise level in a typical urban environment. The result was the Silent Aircraft eXperimental (SAX-40) hybrid-wing-body aircraft concept along with advanced operational procedures that was calculated to achieve 61 dBA with a 25% reduction in fuel burn [4]. The SAX-40 prototype demonstrated that a hybrid-wing-body (HWB) configuration-in which the outer wings smoothly transition to the lifting fuselage-has the potential for both noise and fuel burn reduction. In other words, it is not always necessary to trade fuel efficiency for low noise or vice versa.
Similarly, current NASA funded research focuses on reductions in noise, fuel burn, and emissions of future aircraft in the 2020 time frame. The present work is part of the NASA N+2 project, where N+2 denotes the second generation of aircraft beyond the
Table 1.1: NASA goals for the next two generations of aircraft N+1 N+2 Advanced Conventional HWB 2012-2014 2018-2020 Noise -42 dB -52 dB (cumulative below FAR 36 stage 3)
Emissions
(LTO NOx below CAEP/2) Fuel Burn
-15% -25%
(relative to equivalent current aircraft)
current fleet. The NASA goals are summarized in Table 1.1. The main contributions of this thesis include airframe design, aircraft noise assessment, and an improved noise shielding prediction method.
1.1
NASA N+2 Subsonic Fixed-Wing Project
The research described here is part of a broader collaboration between Boeing Phan-tom Works, the NASA Glenn Research Center (GRC), the NASA Langley Research Center (LaRC), the University of California at Irvine (UCI), and the Gas Turbine Lab-oratory at the Massachusetts Institute of Technology (MIT) funded by NASA's N+2 Subsonic Fixed Wing project. The main objective is to develop advanced methodolo-gies for the design of a quiet, fuel-efficient aircraft that meets the NASA N+2 goals. The project is divided into two phases:
Phase I
* Define a non-proprietary HWB aircraft configuration to be used as a platform for assessment of methods and technologies developed during the project. * Perform an initial noise and fuel burn assessment of the aircraft.
Phase II
* Improve prediction methods for the analysis of unconventional HWB aircraft. * Refine the candidate HWB aircraft to meet the N+2 goals.
* Fabricate the HWB aircraft model for the wind tunnel test.
* Validate prediction methods against aero-acoustic and aerodynamic test data.
The work of this thesis spans Phase I and the beginning of Phase II of the N+2 project. MIT's reponsibility includes the initial airframe design, airframe noise pre-diction, improvements to noise prediction methods, and the overall noise assessment of the aircraft. The engines, in terms of both performance and noise aspects, are investigated by NASA GRC. However, jet noise is handled by UCI. Boeing's role is to develop the final aircraft configuration by integrating the engines with the airframe.
1.2
Previous Work
The hybrid-wing-body aircraft concept has been explored for both commercial use and military use in the past several decades. Many variations of this configuration exist under different names, but a well-known example is Boeing's Blended-Wing-Body (BWB) concept that began circa 1993 [5]. The initial NASA-sponsored study of an 800 passenger, 7000 nm design found 15% reduction in take-off weight and 27% less fuel burn relative to conventional aircraft of that time. Further refinement of the BWB configuration by Boeing resulted in additional performance gains. A chronology of the development of the BWB was given by Leibeck in [6].
Due to integration and coupling of the fuselage, wings, and engines, the BWB aircraft configuration provided an opportunity to to pursue multidisciplinary design and optimization during the development process [7]. Boeing's WingMOD software, originally used to design the wings and tails of conventional aircraft, was adapted to analyze the BWB aircraft. It brings together the aerodynamic, structure, weight,
control, and stability aspects of the analysis to optimize the performance of the BWB aircraft [8].
Most past investigations into the HWB-type configurations focused on its fuel burn and performance rather than noise. Meanwhile, there were many advances in noise reduction technologies for conventional aircraft, including continuous mold-line for high lift devices [9, 10], low-noise landing gears [11, 12], and wing trailing edge brushes [13]. The previously mentioned Silent Aircraft Initiative, launched in 2003, investigated the HWB concept as a way to reduce noise. It was found that, in addition to other low-noise technologies incorporated in the design, the HWB airframe provides a significant amount of noise shielding [14]. Therefore, part of the work during the SAI involved developing a prediction method for noise shielding. Further discussion on the previous work during the SAI as well as on various prediction methods for noise shielding are deferred to Section 2.1 and Secton 4.1, respectively.
1.3
Thesis Objectives
Leveraging off MIT's previous experience in the SAI, the N+2 aircraft was designed using the SAX-40 airframe as a starting point. To ensure a consistent noise com-parison with the current fleet, the N+2 aircraft noise was estimated according to the Federal Aviation Regulations Part 36 (FAR 36) using NASA LaRC's Aircraft NOise Prediction Program (ANOPP). However, ANOPP was developed primarily for con-ventional aircraft and there are challenges in modeling certain aspects of advanced configurations such as an HWB type airframe. One particular shortcoming is the pre-diction of turbomachinery noise shielding, which is an important part of the overall noise reduction strategy. An accurate noise assessment therefore requires improve-ments to ANOPP, one being the establishment of a noise shielding prediction method
for advanced airframe configurations.
ANOPP currently employs the barrier shielding method developed by Beranek [15] and Maekawa [16]. It is based on an empirical correlation of noise attenuation to Fresnel's number for a semi-infinite rectangular screen, i.e. a straight edge. This
is incompatible with the planform shape of an HWB airframe and thus an alternate shielding prediction method is required. However, high fidelity methods such as boundary element methods, equivalent source methods, and ray tracing methods are too computationally expensive for a FAR 36 noise assessment, especially if a large number of aircraft configurations is to be explored. Therefore, a faster, improved-fidelity method (relative to barrier shielding) is proposed.
Based on the diffraction integral method previously formulated by Lummer [17], a noise shielding prediction method was developed for unconventional planform con-figurations such as the HWB airframe. The method is relatively fast and is able to handle high frequencies necessary in a FAR 36 noise assessment. It also retains the simplicity of the current ANOPP shielding method in that only an outline of the shielding geometry is required. This makes the method useful during the initial aircraft design phase when the full 3-D geoemtry is not yet available. When the air-craft configuration is finalized, a more accurate shielding outline can be determined to improve the shielding prediction.
Based on the above, the thesis objectives in support of the N+2 project can be summarized as follows. The objectives are to:
1. Modify and re-design the SAX-40 airframe to meet the N+2 project requirements.
2. Estimate the aircraft noise and evaluate it against the N+2 noise goal. 3. Improve the fidelity of ANOPP's turbomachinery noise shielding prediction1
with the diffraction integral method.
1.4
Thesis Contributions
The preliminary design and assessment of an HWB aircraft to meet NASA's N+2 goals were conducted. ANOPP modules that are not able to model the advanced aircraft configuration were identified for further development. In particular, the diffraction
1
integral method for turbomachinery noise shielding prediction was implemented as an improvement to ANOPP's barrier shielding method. Application of the diffraction integral method to the N+2 aircraft showed that the HWB planform can provide over 20 dB of noise attenuation, demonstrating the low-noise benefit of this aircraft configuration.
The three major topics, aircraft design, noise assessment, and shielding prediction, are described in the following three chapters, respectively.
Chapter 2
N+2 Aircraft Definition
An HWB type airframe configuration was chosen because of its advantages in fuel efficiency and low noise. As demonstrated by the Silent Aircraft Initiative SAX-40 air-craft, the HWB configuration provides a lifting center body to increase aerodynamic efficiency and a large planform for engine noise shielding. With the non-proprietary nature of the SAX-40 geometry and the analysis tools already in place, the SAX-40 was a good starting point for the design of the N+2 aircraft.
Boeing's mission analysis indicated that a cargo freighter would be the appropriate role for a HWB aircraft in the 2020 time frame. Thus, the objective was to convert the SAX-40 passenger aircraft into a freighter, designated here as the SAX-40F. Table 2.1 compares the mission profile of the SAX-40 and the SAX-40F. The payload weight is doubled and the range is extended by 20%.
This chapters describes the development of the SAX-40F and the methods used in its analysis. SAX-40F was further refined by Boeing to produce two aircraft con-figurations for the N+2 project: the N2A and the N2B aircraft.
Table 2.1: Mission comparison between SAX-40F and SAX-40 SAX-40F SAX-40
Payload Type cargo 215 passengers Payload Weight 103,000 lb 51,600 lb Range 6000 nm 5000 nm
Figure 2-1: The Silent Aircraft Initiative SAX-40 hybrid-wing-body aircraft [4]
2.1
Cambridge-MIT SAX-40
The SAX-40, shown in Figure 2-1, was designed with key technologies that enabled it to meet the background noise goal outside the airport boundary while burning 25% less fuel than current aircraft [4].
The center body and the outer wing profiles were tailored for elliptical lift dis-tribution at cruise to achieve ML/D = 20 [4]. For balance, the noise section was cambered to generate lift in the forward position, allowing the use of supercritical outer wing airfoils and less sweep [18]. A distributed propulsion system in which each of the three cores powers three fans results in a high bypass ratio and hence high propulsive efficiency. Furthermore, the engine clusters were partially embedded into the airframe suction surface so that the engines ingest the airframe boundary layer to reduce lost power in the wake [19].
Extensive acoustic liners were employed along the engine ducts to damp out tur-bomachinery noise. In addition, the top-mounted engines benefit from noise shielding provided by the large planform. Thrust vectoring variable area exhaust nozzles were used during take-off to optimize the thrust and climb gradient for low noise and eliminate the need for noisy elevon deflections [20]. On approach, continuous mold-line technology reduces elevon side edge noise and undercarraige fairings reduce shed vortex noise from the struts and the wheels.
The technologies incorporated into the 40 were carried forward to the SAX-40F. However, advanced operational procedures such as thrust vectoring and variable
Figure 2-2: Flowchart of the performance analysis framework
area nozzles were not used in order to remain compliant with the current landing and take-off (LTO) procedures specified by the Federal Aviation Administration.
2.1.1
Aircraft Design and Analysis Framework
For rapid design turnaround, the aircraft analysis framework integrates the quasi 3-D aerodynamic method with performance calculations that include weights and fuel burn estimation. By avoiding costly 3-D computational fluid dynamics (CFD), the framework is able to quickly explore and analyze the design space. It was originally developed during the SAI [4] and was adapted here to the freighter mission profile. The overall procedure, illustrated in Figure 2-2, is explained below followed by a description of the quasi 3-D aerodynamic design method in Section 2.1.2.
The analysis begins with the creation of the airframe geometry, i.e. the airfoil stack, based on input parameters. The weight estimation includes models for struc-ture weight, propulsion system weight, undercarriage weight, and fixed equipment weight [21]. The main algorithm loop then produces the cruise aerodynamic data using the quasi 3-D aerodynamic design method and calculates the fuel weight. Fuel weight is iteratively fed back into the weight model to update the weight estimation until the system converges. A stability check is performed and the outer wing geom-etry is adjusted until the static margin is satisfactory. Finally, a low-speed analysis is performed on the converged and statically stable system.
In order to use this framework to analyze the SAX-40F, the weight model must be updated to reflect a freighter, rather than a passenger, configuration. In addition to changing the fixed equipment weight1, the propulsion system weight was scaled up and the structure weight model was updated. They latter two are briefly discussed in Sections 2.1.3 and 2.1.4 following the description of the quasi 3-D aerodynamic design method.
2.1.2
Quasi 3-D Aerodynamic Design Method
The challenge in the aerodynamic analysis of an HWB is capturing the 3-D effect of the lifting center body as well as estimating the parasitic drag. The quasi 3-D aerodynamic design method avoids a full 3-D viscous CFD calculation by combining 2-D inviscid vortex lattice method (AVL2), 2-D viscous airfoil analysis (MSES3), and Hoerner's empirical drag formulas [22]. The vortex lattice method calculates the spanwise lift, induced drag, and moment distributions used by the 2-D viscous airfoil analysis to obtain the viscous drag, pressure drag, and transonic wave drag of each outer wing section. However, the 2-D viscous airfoil analysis cannot be used at the center body due to the 3-D flow field. Instead, Hoerner's correlations for bodies of revolution were used to estimate the center body's contribution to the viscous drag
1For example, removing passenger seats, galleys, in-flight entertainment systems, meals, etc. 2
Athena Vortex Lattice by Mark Drela. 3
0.6 - 3-D CFD 30 0.6 0.5 25 0.5 0.4 20 0.4 15 0.3 0.3 10 0.2 1 - 0.2 0.1 ' ' ' 0 . 0.1 2 4 6 8 0.2 0.3 0.4 0.5 10 5 0 -5 AoA (deg) CL CM * 1000 (a) (b) (c)
Figure 2-3: SAX-40F comparison of (a) lift curve, (b) lift-to-drag curve, and (c) moment curve between the quasi 3-D aerodynamic design method and 3-D viscous CFD (winglets not included)
and pressure drag.
The quasi 3-D aerodynamic design method compared well with the 3-D RANS analysis conducted by Boeing on the SAX-40F airframe. Figure 2-3 shows good agreement in lift and moment until the stall point and, more importantly, suggests that the 2-D viscous airfoil analysis and the empirical drag formulas produce reason-able drag estimates. To see if the important flow features are adequately captured, pressure coefficient contours of the SAX-40 airframe are compared with 3-D viscous CFD in Figure 2-4. The vortex lattice method produced the expected 3-D effect at the center body and the 2-D viscous airfoil analysis compensated for the inability of the vortex lattice method to predict the shocks on the outer wings.
2.1.3 Propulsion Weight Scaling
The heavier payload and longer range of SAX-40F relative to SAX-40 necessitate a larger engine that must be reflected in the propulsion system weight. This was accomplished by scaling the SAX-40 engine component weights with the top-of-climb
-0.5 0 0.5 0 0.5 1 -1 -0.5 -0.5 3-D CFD Vortex Lattice 0 0.5 1 x/c ... ,...o... 0.5 0 0.5 x/c 3-D CFD Viscous Airfoil
Figure 2-4: SAX-40F comparison of pressure coefficient between the quasi 3-D aero-dynamic design method and 3-D viscous CFD (winglets not included)
AcP
0.5
0thrust4, T. The assumptions made are listed below:
* Since thrust is proportional to mass flow, fan diameter, D, scales with T. * Gas generator weight scales with D2.4 [21].
* Modeling the shafts of the transmission system as torsion rods, transmission system weight scales with T or D2.
* Oil system weight is assumed constant.
* Nacelle weight is calculated as a function of D based on Raymer's military inlet duct formula [23].
* Nozzle weight is calculated as a function of D based on Boeing's formula [24]. * Engine support weight assumed to scale with the sum of all of the above.
Incorporating the above changes into the overall SAX-40F analysis framework resulted in a 36% increase in propulsion system weight over SAX-40, corresponding to 32% increase in top-of-climb thrust.
2.1.4
Structure Weight Response Surface Model
The structure weight, Wstruct, was estimated using a response surface model (RSM) that must be updated before it can be applied to the SAX-40F. The RSM is a least-squares fit of structure weight to a set of parameters. However, the SAX-40F design point was anticipated to lie beyond the range of the parameters used to generate the SAX-40 RSM. Therefore, a new SAX-40F RSM was created based on a more appropriate range of parameters.
The proposed set of parameters for the SAX-40F RSM are wing area, A, wing span, b, payload, Wp,,, fuel weight, Wfuel, and propulsion system weight, Wprop. To generate the data needed for the correlation, these five parameters were perturbed several percentages above and below their anticipated design value and WingMOD
4
Z °m 2 C ) 0 4-o0 2 -O0) C,) C 0) (I) 0 0 4-105r 100 0 95' -90 100 110 Wing Span (% of Design)
(c) 105 100 0 105 C 0) 100 0 O O O (a) 90 100 110
Propulsion Weight (% of Design,
(a) O WingMOD Data -- RSM Fit 105 100 95 90 100 110 Payload (% of Design) (e)
Figure 2-5: Variation in structure weight with respect to (a) propulsion system weight, (b) fuel weight, (c) wing span, (d) wing area, and (e) payload
[25] was used to calculate the structure weight resulting from each perturbation. WingMOD is Boeing's multidisciplinary design and optimization code that consid-ers the aerodynamics, performance, structural loads, weights, stability, and control aspects of a blended wing body aircraft. It was used here, even though the aircraft design it creates is different from the SAX-40 or the SAX-40F, because of a lack of available data on the structure weight of HWB5.
The variation of structure weight with the five parameters generated by Wing-MOD are plotted in Figure 2-5. The data in (a) and (b) shows that perturbations in propulsion system weight and fuel weight produce less than 1% change in structure
5
WingMOD was also used to generate the structure weight RSM for SAX-40 [21]. 95 '
90 100 110
Fuel Weight (% of Design)
(b) 105 C (d) 100 95 C 90 100 110
Wing Area (% of Design)
weight, represented by the dotted horizontal line. Therefore, it is assumed that struc-ture weight is independent of propulsion system weight and fuel weight. Furthermore, the results in Figure 2-5 (c) suggest a quadratic dependence of structure weight on the wing span. Based on these considerations, the following form of the RSM for the SAX-40F was considered:
Wstruct - cA + c2Wpay - c3b + c4b2 + c5 (2.1)
cl = 13.106 lb/ft2 c2 = 0.11283 lb/lb c3 =-4113.0 lb/ft
c4 = 9.6717 lb/ft2 c5 = 421970 lb
The coefficients cl to c5 were found by a least-squares fit with a r.m.s. error of
0.3% and comparison between the RSM and WingMOD data are shown in Figure 2-5 (c), (d), and (e). Replacing the SAX-40 RSM with the new SAX-40F RSM in the SAX-40F analysis resulted in a 0.4% increase in structure weight. While the difference is small, it was important to capture the correct functional dependence for structure weight as the SAX-40F design was optimized.
2.2
Aircraft Definition
Using the modified analysis framework, the SAX-40 design evolved into the SAX-40F for the new freighter mission. Changes to the SAX-40 are:
* Wing span reduced from 67.5 m to 64.5 m to operate in ICAO Annex 14 Code E airports.
* Rear spar across center body moved aft by 84 cm on recommendation from Boeing to accommodate more cargo.
* Fuel tanks moved from the sides of the center body to the outer wings, similar to the fuel tanks on conventional aircraft.
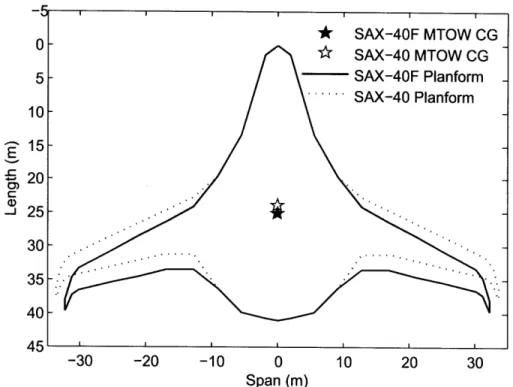
SSAX-40F MTOW CG 0"^ SAX-40 MTOW CG 5 SAX-40F Planform SAX-40 Planform 10 15 20 - 25 . 30 35- 40-45 -30 -20 -10 0 10 20 30 Span (m)
Figure 2-6: Comparison between the SAX-40F and the SAX-40 planform * Outer wing geometry such as sweep, twist, chord, and position adjusted to
maintain static margin as propulsion system weight increased.
The exterior of the center body and all the airfoil shapes remain unchanged from the SAX-40. The adjustments made to the outer wings can be seen in Figure 2-6. The more rearward position of the SAX-40F center of gravity required more sweep on the outer wings in order to move the neutral point rearward.
2.2.1
Comparison between the SAX-40 and the SAX-40F
Performance analysis showed that despite the changes to the outer wings, the SAX-40F was able to maintain the aerodynamic advantages of the SAX-40 design. Com-parison between the SAX-40F and the SAX-40 in Figure 2-7 (a) indicates a similarly high lift-to-drag ratio for both aircraft. The aerodynamic efficiency can be attributed to the HWB type design: the lifting center body and the outer wings were contoured to produce an optimal, near-elliptical lift distribution, as shown in Figure 2-7 (b). For a breakdown of the airframe drag and other aerodynamic data generated by the
30 25 20 0.30 ooo- - -0 20 O O 00 0 . 0.2 10 O SAX-40F E:a0 -- SAX40F 0.1 [ SAX40
-El- SAX40 -- - - - Elliptical
0 0.1 0.2 0.3 0.4 0 0.2 0.4 0.6 0.8 1
CL Spanwise Coordinate
(a) (b)
Figure 2-7: Comparison of (a) lift-to-drag ratio and (b) spanwise lift distribution between the SAX-40F and the SAX-40
quasi 3-D aerydanamic design method for the start of cruise, the reader may refer to Table 2.2.
The weight buildup of the SAX-40F and the SAX-40 is tabulated in Table 2.3. While the OEW increased by only 3%, payload and fuel weight increased by 100% and 50%, respectively, resulting in an overall MTOW increase of 28%. The relatively modest increase in OEW is due to the much lighter fixed equipment weight for a freighter configuration.
The SAX-40F airframe geometry and performance data were delivered to Boeing for further analysis and refinement. Combining the basic airframe design of the SAX-40F and the engine design from NASA GRC, the N+2 aircraft configuration was defined.
2.2.2
N+2 Hybrid-Wing-Body Configuration: N2A and N2B
Based on the SAX-40F airframe, Boeing refined the design and created the N2A and the N2B HWB aircraft as a platform for the assessment of the tools and methods to be developed under the N+2 project. The N2A aircraft, illustrated in Figure 2-8 (a), has two conventional 1.6 FPR pod-mounted engines designed by NASA GRC, two vertical tails, and no winglets. The hypothesis is that the vertical tails provide
Table 2.2: Aerodynamic data for the SAX-40F and the SAX-40 at the start of cruise SAX-40F SAX-40
Wing Area (m2) 845 836 Wing Span (m) 64.5 67.5 Angle of Attack (deg) 3.8 2.7
CL 0.2617 0.2064 ML/D 20.1 20.1 Static Margin (%) 5.5 5.9 CD CDi CDp center body CDp outer wings CDf center body CDf outer wings CD wave CD nacelles 0.0104 0.0043 0.0004 0.0007 0.0026 0.0019 0.0002 0.0004 0.0082 0.0024 0.0004 0.0005 0.0027 0.0018 0.0001 0.0004
Table 2.3: Weight buildup (in lb) of the SAX-40F and the SAX-40 SAX-40F SAX-40
Maximum Take-Off Weight 426,092 332,563
Payload 103,218 51,600
Fuel with Reserves 109,817 73,306 Operational Empty Weight
Structure Propulsion Undercarriage Fixed Equipment 213,057 113,209 49,876 18,499 31,474 207,657 104,872 36,809 14,758 51,219
(a) N2A
(b) N2B
Figure 2-8: Rendering of the SAX-40F based N2A and N2B HWB aircraft [picture courtesy of D. Odle, Boeing]
additional lateral engine noise shielding6. The N2B aircraft, illustrated in Figure 2-8 (b), has three embedded 1.5 FPR engine clusters of nine fans powered by three cores. The configuration is similar to the SAX-40F aircraft except that the engines were redesigned by NASA GRC. The intent of the N2B embedded engine design is to investigate the risk and benefits of more advanced technologies.
Boeing's analysis indicated that the fuel efficiency in terms of payload-range per pound of fuel of the N2A and N2B are 2.47 ton-nm/lb and 2.37 ton-nm/lb, respec-tively. This represents over 25% reduction in fuel burn compared to the B767 freighter, thus meeting the N+2 fuel burn goal. With the aircraft configuration defined, the noise assessment for the aircraft could begin.
Chapter 3
N+2 Noise Assessment
The landing and take-off (LTO) noise of the N2A and the N2B aircraft were estimated using the NASA Aircraft Noise Prediction Program (ANOPP) to both evaluate the aircraft against the N+2 noise goal and to assess ANOPP's applicability to hybrid-wing-body type aircraft. ANOPP has been continually updated by NASA LaRC to include the most recent semi-empirical noise estimation methods. However, many of the methods are based on correlations of noise data from conventional aircraft config-urations and may not be suitable for an HWB type aircraft configuration. Therefore, as a first step towards a complete noise assessment, the current version of ANOPP was used to identify shortcomings in ANOPP's modules when estimating the N2A and the N2B aircraft noise. Much of the work is captured in [26] and as such, only a summary is presented in this chapter.
3.1
FAR 36 Requirements for Noise Certification
In order to make a fair comparison between the N2A and the N2B against current aircraft, noise measurement rules in the Federal Aviation Regulations (FAR) Part 36 were applied to the N2A and the N2B aircraft. Special low-noise operational procedures, such as those used in the SAI, were not considered.
FAR 36 requires LTO noise to be measured at three locations relative to the airport runway: approach, lateral, and flyover [27, 28]. The conditions are summarized below:
Approach
* Observer located along centerline 2000 m before runway threshold. * Maintain -3 °C glide angle, corresponding to 120 m altitude at the
microphone.
* Maintain true airspeed Vef + 10 knots. * Maximum landing weight.
* Noisiest configuration, e.g. landing gear extended, flaps deployed, etc. Lateral
* Observer located 450 m to the side of the centerline where noise after lift-off is maximum.
* Maximum noise can be assumed to occur when aircraft is at 300 m altitude. * Mantain true airspeed between V2 + 10 knots and V2 + 20 knots.
* Full take-off engine power with no thrust cutback. * Maximum take-off weight.
Flyover
* Observer located along centerline 6500 m after brakes-off.
* Mantain true airspeed between V2 + 10 knots and V2 + 20 knots.
* Full take-off engine power until at least 300 m altitude, typically 900 m to 1200 m before observer.
* Cutback thrust level must maintain 4% climb gradient or level flight with one engine inoperative, whichever is greater.
All noise measurements are made at ISA + 10 C day, 70% humidity, zero wind, and sea level conditions. The metric used for FAR 36 noise certification is the effective perceived noise level (EPNL). It is calculated from the intantaneous perceived noise levels, based on noy, and corrected for tones and duration of the sound. The result is a single number, in EPNdB, representing the perceived aircraft noise at each of the approach, lateral, and flyover observer locations. The sum of the three' is the benchmark for the N+2 noise goal.
3.2
NASA Aircraft Noise Prediction Program
ANOPP is a fast noise estimation tool useful for calculating EPNL at FAR 36 condi-tions. It treats each noise generating mechanism on the aircraft as a compact source with directivity. In the current version of ANOPP, all noise sources are assumed to originate from the same location on the aircraft, but the next version of ANOPP is planned to include the actual location of each noise source. The noise sources are propagated at every time step to the observer as the aircraft travels along its LTO trajectory. The propagation includes the effect of spherical spreading, atmospheric absorption, ground reflection and attenuation, and retarded time. The perceived noise at the observer is then summed and converted into EPNL.
ANOPP is organized into many interchangeable modules. There is at least one module for estimating the amplitude and directivity of each noise source. Most of the noise estimation modules are based on empirical wind tunnel or flight test data of past aircraft. As such, the modules may produce erroneous results for aircraft, like the N2A and the N2B, that is outside the design space of the current fleet. If an ANOPP module is found to be unsuitable for the N2A or N2B, noise source data from an external model can be imported into ANOPP.
1Although EPNL is in decibels, FAR 36 uses a regular sum, rather than power 10 sum, for the cumulative EPNdB.
Table 3.1: Noise source estimation models for N2A and N2B noise assessment Noise Source Estimation Method
Fan, forward propagating ANOPP Heidmann Fan Module GE large turbofan method Fan, rearward propagating ANOPP Heidmann Fan Module
GE large turbofan method
Core ANOPP GE Core Module
Jet (N2A) ANOPP Stone 2 Jet Module
Jet (N2B) Scaled SAX-40 jet noise hemisphere
Wing FW-Hall physics-based airfoil self-noise method Undercarriage ANOPP Boeing Airframe Module
Modified landing gear model Elevon ANOPP Boeing Airframe Module
Modeled as aileron
Leading edge droop Droop effect on BL properties included in FW-Hall Contributions from side edge not modeled
Wing tip (N2A) Tip vortex noise model by Brooks & Marcolini [29] Winglet (N2B)
Vertical Tail (N2A) ANOPP Fink Airframe Module
3.3
Overview of Noise Sources
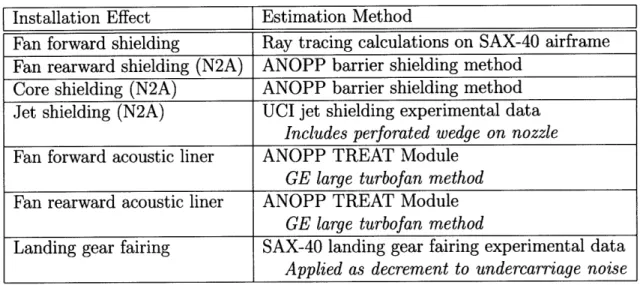
For the N2A and the N2B, a combination of ANOPP modules and several external models were used to calculate their noise sources. The models are summarized in Table 3.1.
Engine noise estimation was provided by NASA GRC. ANOPP modules were used for engine noise with input from NASA's Numerical Propulsion System Simulation (NPSS) code. However, due to the triple-slotted configuration of the N2B exhaust nozzle, the ANOPP Stone 2 Jet Module cannot adequately model the N2B jet noise. Therefore, the jet noise hemisphere2 from the SAX-40 was scaled up using the ratio of the SAX-40F jet Mach number to the SAX-40 jet Mach number. Based on di-mensional analysis, the acoustic pressure is proportional to the 8th power of jet Mach number [30].
ANOPP modules were used for most of the airframe noise sources. For wing noise, 2
The noise hemisphere is sound pressure level measured on a 100-ft radius hemisphere on the right side of the aircraft.
Table 3.2: Noise attenuation estimation models for N2A and N2B noise assessment Installation Effect Estimation Method
Fan forward shielding Ray tracing calculations on SAX-40 airframe Fan rearward shielding (N2A) ANOPP barrier shielding method
Core shielding (N2A) ANOPP barrier shielding method Jet shielding (N2A) UCI jet shielding experimental data
Includes perforated wedge on nozzle Fan forward acoustic liner ANOPP TREAT Module
GE large turbofan method Fan rearward acoustic liner ANOPP TREAT Module
GE large turbofan method
Landing gear fairing SAX-40 landing gear fairing experimental data Applied as decrement to undercarriage noise
an airfoil self-noise method based on the the FW-Hall formulation was used. It was conceived during the Silent Aircraft Initiative by Manneville, Pilczer, and Spakovszky [31] and further developed by Hileman and Spakovszky. The noise amplitude due to the scattering of turbulent eddies at the trailing edge was calculated using Lighthill's acoustic analogy based on the work of Ffowcs-Williams and Hall [32], while the direc-tivity and spectral shape were calculated from empirical correlations. The advantage is that the FW-Hall method is based on boundary layer properties derived from a viscous airfoil calculation, rather than broad correlations using global geometric pa-rameters. Its results were found to agree well with ANOPP's Fink method.
3.4
Propulsion System Installation Effects
Similar to the noise sources, a combination of ANOPP modules and external models were used to estimate the attenuation of the noise sources due to installation effects of the propulsion system on the N2A podded engine aircraft and the N2B embedded engine aircraft. These are calculated separately from the noise source estimation and applied as an increment or decrement in AdB to the source sound pressure level (SPL). The models are summarized in Table 3.2.
current barrier shielding method is unsuitable for HWB aircraft configurations such as the N2A and the N2B. It was derived from the work of Beranek [15] and Maekawa [16] to estimate the effectiveness of noise barriers based on an empirical correlation of noise attenuation to Fresnel's number for a semi-infinite rectangular screen. Essentially, it calculates noise attenuation due to a straight edge and is therefore incompatible with the planform shape of the N2A and the N2B. Furthermore, it considers only a monopole source and cannot handle the distributed nature of the jet noise source. Based on these considerations, the applicability of the barrier shielding method in the N2A and N2B noise assessment was limited.
Thus, previously computed ray tracing results for the SAX-40 [1] were applied to the fan forward noise in the N2A and N2B noise assessment. Although ray tracing is a higher fidelity method, it is also much more complex and computationally expensive. Therefore, ray tracing was not computed directly on the N2A and N2B airframe. Instead, the SAX-40 ray tracing results were applied to the N2A with the caveat that the N2A has two engines instead of three and vertical tails instead of winglets. For the N2B, the geometry is similar to the SAX-40 geometry such that the SAX-40 ray tracing results were expected yield reasonable results.
ANOPP's barrier shielding method was applied to estimate the rearward propa-gating turbomachinery noise, i.e. fan rearward and core, of the N2A configuration3. This is because shielding is provided by the aircraft trailing edge, which can be reason-ably approximated as a straight edge. For the distributed N2A jet noise source, UCI performed experimental measurements of trailing edge shielding attenuation that was applied to the noise assessment. A perforated wedge was inserted into the top part of the nozzle annulus to compact the distributed noise source and increase shielding effectiveness.
It was clear that in order to perform a more rigorous noise assessment of the N2A and the N2B and to evaluate the benefits of other noise reduction techniques, an improved noise shielding prediction method is required. To this end, a diffraction integral method for turbomachinery noise shielding prediction was implemented and
3
is described in Chapter 4. At the same time, UCI is developing a jet noise shielding method based on their experimental findings.
3.5
N+2 Noise Audit Results
Combination of all noise sources and effects in ANOPP over the FAR 36 compliant LTO trajectories revealed that the N2A was close to meeting the N+2 noise goal. The results of the noise assessment are presented in Sections 3.5.1 and 3.5.2 as time histories of tone-corrected perceived noise level (PNLT) for each of the approach, lateral, and flyover conditions. The PNLT plots were broken down into each of the noise sources, including separate entries for the nose and main landing gears. The N2A elevons were also divided into inboard elevons and outboard elevons relative to the location of the vertical tail. The PNLT data were then integrated to obtain the EPNL for comparison to NASA's N+2 noise goal.
3.5.1
N2A Tone-Corrected Perceived Noise Levels
The N2A approach, lateral, and flyover noise are shown in Figures 3-1, 3-2, and 3-3, respectively. The times at which the aircraft is directly above the observer (or to the side, in the case of the lateral noise monitor) are also indicated on the plots. The drop in engine noise at about 91 seconds during flyover is due to thrust cutback, while the jump in fan rearward and core noise at about 71 seconds during lateral and 117 seconds during flyover are due to the observer moving out of the shadow zone of the trailing edge. Due to its distributed nature, the jet noise source did not exhibit the same sharp jump.
The noise assessment of the N2A aircraft indicates that jet noise and fan rearward noise need further reduction. The two noise sources are the dominant contribution to the total noise at both take-off monitor locations, i.e. lateral and flyover. However, the margin for improvement in flyover is much lower unless elevon noise is also reduced along with the jet noise and the fan rearward noise. On approach, the airframe noise sources are more significant due to the low engine power setting. The loudest approach
Total Fan Fwd Fan Rwd Core Jet Wing ...- - Wing Tip ---- Vertical Tail
Inbrd Elevon -- - Outbrd Elevon - -- -- - Main Gear --- -- Nose Gear 100 90. N2A Approach 80-70 20 -10 -observer
0"
...
..
, .
-
..
-
...
-
-..
-
-
-
-
-
---
-
-
-
--40 -35 -30 -25 -20 -15 -10 -5
Time Before Runway Threshold (s)
Figure 3-1: Tone-corrected perceived noise level for the N2A on approach
Total Fan Fwd Fan Rwd - Core
Jet - Wing -- -- -- -Wing "ip -- Vertical Tail
Inbrd Elevon --- Outbrd Elevon -- -- - -Main Gear -- -- -- -Nose Gear 100 90 80 70 60 50 40 30 20 10 0 130 30 50 70 90 110
Time After Brakes Off (s)
Total Fan Fwd Fan Rwd Core
- Jet - Wing - -- -- --Wing Tip ---. Vertical Tail Inbrd Elevon --- Outbrd Elevon - -- -- --Main Gear -- -- --... Nose Gear 100 90 80 70 60 50 40 30 20 10 0 150 50 70 90 110 130
Time After Brakes Off (s)
Figure 3-3: Tone-corrected perceived noise level for the N2A at flyover
noise source is the main landing gear, followed by the elevons.
3.5.2
N2B Tone-Corrected Perceived Noise Levels
The N2B approach, lateral, and flyover noise are shown in Figures 3-4, 3-5, and 3-6, respectively. The times at which the aircraft is directly above the observer (or to the side, in the case of the lateral noise monitor) are also indicated on the plots. Like the N2A, the drop in engine noise at about 91 seconds during flyover is due to thrust cutback. However, unlike the N2A, there is no jump in fan rearward or core noise due to the lack of engine exhaust shielding.
Due to the complexity of the embedded propulsion system and the lack of ANOPP's capability to model such a propulsion system, the N2B engine noise, while dominant in all three cases, may not be representative of the actual noise level. Current ANOPP modules were not developed to model the N2B engine configuration of three fans pow-ered by a single core. Furthermore, the ANOPP TREAT acoustic liner module was limited by the length of acoustic liners it could model and was not able to estimate
-Total - Fan Fwd - Fan Rwd Core Jet
Wing - -- -Winglets Elevon - -- - -- -Main Gear - -- -- --Nose Gear 110 100 N2B Approach 90 80 70 -J 50 -z S 40 30 -20 10 -10 'observer 0--40 -35 -30 -25 -20 -15 -10 -5
Time Before Runway Threshold (s)
Figure 3-4: Tone-corrected perceived noise level for the N2B on approach
Total - Fan Fwd - Fan Rwd Core - Jet
Wing ... Winglet .-..--.. Elevon -- - -- Main Gear - -- -- -- Nose Gear 110 100 90 80 70 60 50 40 30 20 10 0 30 50 70 90 110
Time After Brakes Off (s)
130
Total - Fan Fwd - Fan Rwd - Core - Jet
- Wing --- Winglets .-... Elevon ... Main Gear --- Nose Gear
110 100 N2B 90 80-70 60 50 40 30 20 -0 ' observer 30 50 70 90 110 130
Time After Brakes Off (s)
Figure 3-6: Tone-corrected perceived noise level for the N2B at flyover
the noise attenuation for the full length of the acoustic liners in the N2B engines. This, in combination with the lack of shielding for the engine exhaust, resulted in the significant overestimation of the engine noise compared to the Silent Aircraft Ini-tiative. Unfortunately, the SAX-40 engine noise was estimated using Rolls-Royce's proprietary codes and is not available for the N+2 project. Therefore, until advanced ANOPP engine noise prediction methods are in place, the N2B noise results should be considered preliminary.
An exception to the otherwise overestimated N2B engine noise is the jet noise. It is suspected that the low power setting on approach made it inappropriate to scale the SAX-40 jet noise hemisphere, resulting in unreasonably low jet noise. Overall, refinement and improvement in engine noise modeling is recommended before further analysis into the N2B noise results. This is the focus of current and future work under the NASA N+2 program.
Table 3.3: Effective perceived noise and FAR 36 Stage 3 noise limits [2] N2A Stage 3 N2B Stage 3 Approach 86.8 102.7 93.6 102.7
Lateral 90.1 100.4 94.1 100.4
Flyover 76.9 97.0 87.0 100.0
Cumulative 253.8 300.1 274.7 303.1 Difference from N+2 Goal -5.7 -23.6
3.5.3
Comparison of Effective Perceived Noise Level to N+2
Goal
Table 3.3 shows that the N+2 noise goal of -52 EPNdB relative to Stage 3 was not yet achieved. The N2A is 5.7 EPNdB short of the noise goal but further low-noise improvements to the aircraft are expected to bring the N2A to the goal. The N2B is 23.6 EPNdB short of the noise goal but, as mentioned previously, adequate noise estimation methods for the N2B engines are not yet in place. Thus, the reliability of the N2B EPNL is uncertain.
In order to meet the N+2 noise goal, the following modifications to the N2A and N2B are suggested:
* Redesign the engine cycle at a lower fan pressure ratio to reduce jet noise and fan noise.
* Employ more acoustic liners along the N2B engine ducts. * Further develop advanced low-noise landing gear fairings.
* Mitigate elevon side edge noise with continuous mold-line or other techniques. The above suggestions were made based on the breakdown of PNLT for each noise source in Sections 3.5.1 and 3.5.2. In particular, the engine cycle redesign for low noise takes advantage of the gap between the fan and jet noise and the next loudest noise source in the lateral monitor case, as shown in Figure 3-2. Figure 3-1 shows that advanced landing gear fairings can be used to lower the peak main gear noise on
approach by about 3 dB. Further noise reduction will require concurrent mitigation of elevon side edge noise.
To evaluate the suggested modifications and to increase the fidelity of the noise assessment, the following improvements to the noise estimation methods are recom-mended:
* Develop engine noise estimation methods for the N2B engine configuration. * Increase the fidelity of turbomachinery noise shielding prediction for the HWB
planform geometry.
* Develop a jet noise shielding prediction method that accounts for the distributed nature of the jet noise source.
* Increase the fidelity of the acoustic liner model.
Advanced method development for unconventional aircraft is one of the main objectives of the N+2 project. Turbomachinary noise shielding was part of MIT's responsibility and is the subject of the next chapter.

![Figure 2-1: The Silent Aircraft Initiative SAX-40 hybrid-wing-body aircraft [4]](https://thumb-eu.123doks.com/thumbv2/123doknet/14676820.558187/28.918.152.768.144.322/figure-silent-aircraft-initiative-sax-hybrid-wing-aircraft.webp)