HAL Id: hal-02105858
https://hal.archives-ouvertes.fr/hal-02105858
Submitted on 22 Apr 2019
HAL is a multi-disciplinary open access
archive for the deposit and dissemination of sci-entific research documents, whether they are pub-lished or not. The documents may come from teaching and research institutions in France or abroad, or from public or private research centers.
L’archive ouverte pluridisciplinaire HAL, est destinée au dépôt et à la diffusion de documents scientifiques de niveau recherche, publiés ou non, émanant des établissements d’enseignement et de recherche français ou étrangers, des laboratoires publics ou privés.
Jones’ Factors
François Mariotti, Daniel Tomé, Philippe Mirand
To cite this version:
François Mariotti, Daniel Tomé, Philippe Mirand. Converting Nitrogen into Protein – Beyond 6.25 and Jones’ Factors. Critical Reviews in Food Science and Nutrition, Taylor & Francis, 2008, 48 (2), pp.177-184. �10.1080/10408390701279749�. �hal-02105858�
Converting nitrogen into protein – beyond 6.25 and Jones’ factors
François Mariotti 1*, Daniel Tomé 1 and Philippe Patureau Mirand 2
1 AgroParisTech, INRA, UMR914 Nutrition Physiology and Ingestive Behavior, Paris, France
and 2 INRA, UMR 1019, UNH, Clermont-Ferrand - Theix, France
* Correspondence to François Mariotti, UMR914 AgroParisTech-INRA Nutrition Physiology and Ingestive Behavior, AgroParisTech, 16 rue Claude Bernard, F-75005 Paris Cedex 05, France ; Tel.: +33 1 44 08 72 86; Fax: +33 1 44 08 18 58; E-mail: mariotti@agroparistech.fr.
Abstract
The protein content in foodstuffs is estimated by multiplying the determined nitrogen content by a nitrogen-to-protein conversion factor. Jones’ factors for a series of foodstuffs, including 6.25 as the standard, default conversion factor, have now been used for 75 years. This review provides a brief history of these factors and their underlying paradigm, with an insight into what is meant by “protein”. We also review other compelling data on specific conversion factors which may have been overlooked. On the one hand, when 6.25 is used irrespective of the foodstuff, “protein” is simply nitrogen expressed using a different unit and says little about protein (s.s.). On the other hand, conversion factors specific to foodstuffs, such as those provided by Jones, are scientifically flawed. However, the nitrogen:protein ratio does vary according to foodstuff considered.
Therefore, from a scientific point of view, it would be reasonable not to apply current specific factors any longer, but they have continued to be used because scientists fear opening Pandora’s box. But because conversion factors are critical to enabling the simple conversion of determined nitrogen values into protein values and thus accurately evaluating the quantity and the quality of protein in foodstuff, we propose a set of specific conversion factors for different foodstuffs, together with a default conversion factor (5.6). This would be far more accurate and scientifically sound, and preferable when specifically expressing nitrogen as protein. These factors are of particular importance when “protein” basically means “amino acids”, this being the principal nutritional viewpoint.
Keywords: nitrogen; protein; amino acids; dietary protein; protein quality; protein chemistry; nutrition
Introduction - 6.25, the flawed viewpoint
The protein content in a foodstuff is estimated by multiplying the nitrogen content by a nitrogen-to-protein conversion factor, usually set at 6.25. This historical factor (dating back to the 19th century) assumes the nitrogen content of proteins to be 16%. Although widely
accepted, this practical rule is little resistant to closer scrutiny.
Firstly, it has long been acknowledged that pure proteins differ in terms of their nitrogen contents (Jones, 1941). This results from differences in their amino acid composition, because the nitrogen content of amino acids can vary considerably, being high in arginyl, histidyl, glycyl and asparagyl residues and low in phenylalanyl and tyrosyl residues. Jones (1941) reported that avocado protein contains 13.4% nitrogen and amandin (an almond protein) 19.3%. In such cases, using a 6.25 conversion factor can lead to a 15-20% error in the protein content. Different values have been reported by other authors for other proteins, and even for different protein fractions within the same protein source. For example, the nitrogen content of collagen is 18%. Consequently, the nitrogen-to-protein ratio in meat products will vary as a function of the collagen level (Benedict 1987).
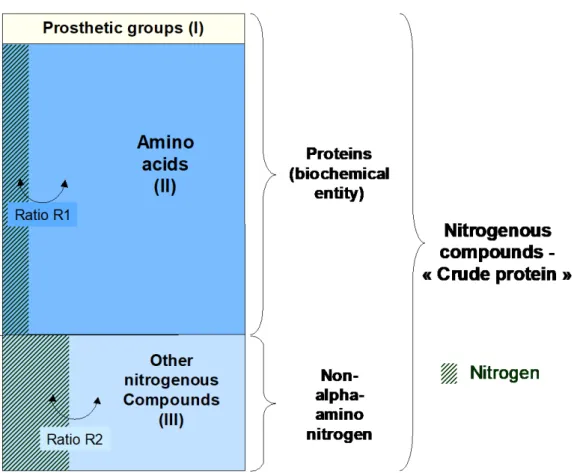
Secondly, nitrogenous compounds in foodstuffs do not only comprise protein or amino acid, they also include numerous substances such as nucleic acids, amines, urea, ammonia, nitrates, nitrites, phospholipids, nitrogenous glycosides, etc. (Figure 1). The fraction of non alpha-amino nitrogen is highly variable for a given protein source, depending on the production process and the degree of purification of the protein source.
Therefore, in many cases, multiplying the nitrogen content of a protein source by 6.25 cannot provide a sound estimate of the protein content (Figure 1). N x 6.25 is referred as the “crude protein” content, a term that is now less and less employed in human nutrition.
What is meant by “protein”?
Nowadays, the conversion factor should not be an issue for nutritionists when the amino acid content of a foodstuff is known. Because protein requirements correspond to the increasingly well-understood requirements for specific indispensable amino acids and to a non-specific need for non-indispensable amino acids, the nutritional value of a protein source can be estimated adequately from an analysis of the nitrogen and amino acid contents (Schaafsma 2005). However, the persisting use of the dietary protein concept by most dieticians (and also in trade and food regulations) requires a practical method to determine the “protein content” of food. This concept is highly ambiguous because “protein” and “protein”-related compounds refer to a variety of very different substances considered as a whole but differing
in terms of their biochemical and analytical nature (Figure 1). In particular, “protein” can either refer to specific, purified compounds –the biochemical viewpoint – or to the main function of “protein”, that is to provide amino acids – the most nutritionally relevant although other nitrogenous compounds can affect the body nitrogen balance (Kies, 1974). Clearly, the choice between one or several conversion factors depends on the objective. If the purpose is to indicate the amount of nitrogen but to express it as an average protein content (the “crude protein” content), one factor is enough. In contrast, specific coefficients, calculated from nitrogen and amino acid contents, are more relevant than a single default factor when the objective is to indicate the potential to provide dietary amino acids.
Methods to estimate specific conversion factors
Only a few studies (most of them published many years ago) have reported specific nitrogen-to-protein conversion factors for different protein sources. The authors resorted to different methods. One was to determine the nitrogen content of one (or a few) important protein(s) extracted from the foodstuff. This method is highly dependent on the degree of purification and the representativeness of the purified protein with respect to all the other proteins in the foodstuff. Another method was based on knowledge of the amino acid composition or sequence of all the constitutive proteins in a source, so that their nitrogen content and conversion factor (K) could be calculated. This method, which was mainly applied to milk proteins, provides an estimate that does not take account of non-protein nitrogen and overestimates the potential of a source to provide amino acids when the peptide chains include glycosylated or phosphorylated residues (Table 1 and Figure 1). Using these data, however, a conversion factor (K’) independent of the prosthetic groups can be recomputed, which better describes the ability of these proteins to provide amino acids. It is lower than, or equal to, factor K, depending on the presence of prosthetic groups.
Lastly, a conversion factor for dietary proteins that allows an estimate of their potential to provide amino acids (as is achieved with the K’ factor), can also be calculated from their nitrogen and amino acid contents (Mossé, 1990). In this context, two types of conversion factors have been proposed. The first, kP, is the ratio of the sum of the weights of anhydrous
amino acid residues to total nitrogen content (Sosulski and Holt, 1980). kP is well designed to
assess protein content from nitrogen content, but because it depends on analytical recovery during amino acid analysis, it tends to underestimate the protein content. The second factor, kA, is the ratio of the sum of anhydrous amino acid residue weights to nitrogen from
recovered amino acids (including amide nitrogen – for methods see Mossé et al. 1985). Because, this factor does not take account of nitrogen from dietary non-protein constituents (Figure 1), both protein levels inferred from this factor and the total nitrogen content are
overestimated. Interestingly, a mean factor, i.e. k = (kA + kP)/2, has been proposed as being
a good compromise because kP and kA are respectively lower and higher than the true factor
(Mossé, 1990). However kA should be preferred for purified protein fractions where the
amount of non-protein nitrogen is very low, such as in purified protein products extracted from milk, cereals or soybean.
Shortcomings and inherent problems in the development and accuracy of specific conversion factors.
If the amounts of constitutive proteins in a food and their amino acid sequences are known, the conversion factor can be calculated exactly (as shown above for milk). In other cases, the amino acid and nitrogen composition are needed. Nitrogen can be analyzed using the classical Kjeldahl method or the alternative Dumas approach. The former has proved to be simple and accurate and constitutes a reference method while the latter, which is considered as a challenger method, accurately assays total nitrogen and is of particular interest for high nitrogen contents (Wiles et al., 1998). Slightly higher levels of nitrogen are usually found using the Dumas method and this can be explained by a greater total efficiency in assessing all forms of nitrogen in the sample (Daun and Declercq, 1994 ; Thompson et al., 2002). However, methodological bias and reliability issues are usually minimal when determining a total nitrogen content, and indeed, the development of accurate conversion coefficients depends on accurate amino acid analysis. k values (mean of kP and kA) are little sensitive to errors of accuracy and repeatability in amino acid analysis. Using a Monte-Carlo-like simulation approach (data not shown) we have calculated that a random error in individual amino acid concentrations within the range ± 20% results in an average accuracy error with a coefficient of variation (CV) that is lower than 3.5% and 1.5% for kP and kA respectively, translating into a final CV of less than 2% for k. This is consistent with the homogeneity of the k values obtained by different groups, despite some variations in the results concerning individual amino acids. By contrast, k is more prone to a methodological systematic bias. Two important steps have to be considered: the hydrolysis releasing amino acids from protein and amino acid determinations in hydrolysates. Importantly, an error in global hydrolysis recovery is transferred directly on kP (Mossé, 1990). This can be overcome by optimizing several parameters to achieve efficient hydrolysis: the hydrolysis reagent (nature and concentration), temperature, duration and amount of reagent, which may depend on the protein concentration in food. This question has been dealt with in details in several reviews (Darragh and Moughan, 2005 ; Mosse et al., 1985 ; Peace and Gilani, 2005). Specific hydrolysis conditions are required to obtain the composition in the 18 common amino acids, including amide nitrogen for kA calculation (Mosse, 1990; Mosse et al., 1985). The
determination of amino acids released by hydrolysis can be performed using different methods. The reference method is ion-exchange liquid chromatography with ninhydrin post-column derivatization because it assays all amino acids in the same run and has been proved to be repeatable. The somewhat low sensitivity of this method is not a practical problem since the sample size is rarely limiting. But because this method is time-consuming, other techniques have been applied which are based on amino acid separation by gas chromatography, RP-HPLC, ULPC and capillary electrophoresis with pre- or post-column derivatization (Peace and Gilani, 2005). Recently, liquid chromatography coupled to tandem mass spectrometry (ESI-MS/MS) has demonstrated higher amino acid resolution and detection than classical methods (Piraud et al., 2005 ; Qu et al., 2002).
Real specific conversion factors have been overlooked and Jones’ factors remain
The conversion factors computed by this method using data from the literature vary depending on the dietary protein sources (Table 2). The factors differ for animal and plant products because of differences in their amino acid composition and because non alpha-amino nitrogen levels are higher in plant products than in animal products. It is noteworthy that differences within animal and plant products are more marked than the average difference between animal and plant products. For a given foodstuff, the conversion factor may differ according to species and nitrogen content (Huet et al., 1988, Mossé, 1990) and depends on the purification rate of protein extracts (Mossé, 1990) (Figure 1). However, in a given specie, reported values are very close. Furthermore, the K' conversion factor for milk is quite similar (when computed from an amino acid sequence which excludes prosthetic groups but includes non-protein nitrogen (5.80, Table 1)) to the factor k calculated from amino acid and nitrogen compositions (5.85, Table 2). When the most recent values are considered, the factors range from 5.85 to 6.15 for milk products, from 5.38 to 5.74 (averaging 5.6) for meat, fish and eggs, and an average of 5.5 for soybean. For other legumes (pea, lupine, dry beans), estimates range from 5.24 to 5.64 (average: 5.4). For most cereal products, the range is between 5.3 and 5.8 (average: 5.4), despite quite considerable discrepancies in the literature. For most fruits and vegetables, the factor varies as a function of the product and the authors. It is low (4.3) and could even be considered lower if kP is
used, which may be more relevant than kA for these low protein sources rich in non-protein
nitrogen (Fujihara et al., 2001, Jones, 1941, Mossé, 1990, Sosulski and Imafidon, 1990). In practice, these data are rarely used even though they are more relevant than those applied at present. Indeed, the conversion factors most frequently employed are those of Jones (Table 3), which were first published in a USDA report in 1931 (slightly revised in 1941) and consist in a compilation of published and unpublished results.
However, Jones’ values are erroneous for two main reasons. They result from the extrapolation of the amount of nitrogen in a purified fraction of the major proteins without any guarantee concerning the purification rate, and they take no account of the non-protein nitrogen fraction (Tkachuk, 1969, Jones, 1941) (Figure 1). Although several authors have reported their inadequacy during the past sixty years, these data are still used in food composition tables (USDA data bank, Souci-Fachmann-Kraut tables (Scherz and Senser,2000), Danish Food Composition Databank (Møller et al. 2005), Ciqual Databank (Favier et al. 1995), etc.), although sometimes with slight adaptations (e.g., USDA data bank), in order to indicate the protein content of dietary products (FAO, 2003). Furthermore, when a specific factor is not determined, the default factor is set at 6.25 whereas the average factor is clearly closer to 5.6. In most trade and food regulations, the official factor is set at 6.25. Interestingly, a major controversy has recently arisen after it was proposed by the latest Codex Alimentarius committee guidelines for infant formula standards that, at variance with standard regulations, 6.38 rather than 6.25 should be used for cow milk protein (Koletzko and Shamir 2006). Indeed, conversion factors have huge financial implications. In the present case, the difference between 6.38 and 6.25 in this regulatory setting would translate into a $96M difference affecting the European dairy industry (Koletzko and Shamir 2006).
Mismatches in estimating protein quantity and quality
What are the consequences of using 6.25 and/or Jones’ factors? First, the protein levels estimated using Jones’ factors or a constant factor often differ from the real levels estimated using specific factors. The discrepancies can be considerable for some animal protein sources, and even more so for plant sources. For instance, using Nx6.25, some protein isolates from plants with a specific conversion factor lower than 6.25 are reported to have protein content higher than 100% of dry matter. Calculating the protein content of a source using a constant factor (such as 6.25) basically means expressing the nitrogen content in another unit, which would prove highly unrealistic in this case. Second, if the amino acid composition of the product is reported in grams per 100 g of “protein” calculated using 6.25 or a specific Jones factor (which is usually not clearly stated), these levels are over- or underestimated depending on whether the conversion factor is lower or higher than the appropriate specific factor. Therefore, the chemical score (FAO/WHO, 1991), which is calculated almost systematically using the constant factor 6.25, clearly refers to the nutritional value of nitrogen rather than that of proteins. Consequently, foods with a real conversion factor lower than 6.25 lose in quality what they gain in quantity.
Two examples are shown in Table 4. In the case of wheat, when expressing the nitrogen content as crude protein (Nx6.25), the chemical score is 0.50, exactly as it is when using nitrogen. When resorting to Jones' factor, the use of 5.83 as a conversion factor decreases the estimate of protein and accordingly increases the chemical score, or quality index. The use of a real specific conversion factor (Nx5.49) further decreases the estimate of protein content (as it is more accurate with respect to amino acids) and increases the quality index (“protein”-amino acids being, of course, richer in lysine). A similar impact on estimates of protein quantity and quality are shown for navy bean (Table 4). Interestingly, in this latter example, if the real conversion factor is used rather than the standard method of converting nitrogen to “protein”, the real protein content is 15% lower and the chemical score is no longer below the unit. The final conclusion is thus that if protein per se is considered, navy bean protein is not deficient in sulfur amino acids. Please note that for sake of clarity in these examples, we set the lysine reference at 51 mg/g_protein although when resorting to real specific conversion factors, the average conversion factor of 5.6 is preferable to 6.25 when expressing the reference pattern as protein and therefore calculating a chemical score based on protein in both the foodstuff (Nx5.4 in the example) and the reference (Nx5.6). If this system is applied, the reference for lysine (320mg/g_N) would be better set at 51x6.25/5.6 = 57 rather than 51 mg/g_protein, which would result in the most accurate estimate of protein quality. This slightly differs from the chemical score based on nitrogen or Nx6.25, depending on whether the specific foodstuff factor is distant from 5.6.
However in these examples, we can see that the nutritional value of a foodstuff estimated from the amount necessary to meet all amino acid requirements (the product of both quantity and quality) is obviously the same whatever the conversion factor. These examples also clearly illustrate that the use of specific factors is preferable because it draws far more accurate estimates for “protein” regarding both the quantity and quality of a foodstuff.
A proposal for a set of real specific conversion factors as replacements for 6.25 and Jones factors
More recent data have provided a clearer understanding of variations in nitrogen-to-protein conversion factors. Genetic variability in foodstuffs and the effects of how protein sources are produced and processed may to a certain extent explain the discrepancies between values determined for the same type of foodstuff. However, the most recent extensive data published by Mossé et al. (1990) and by Sosulski & Imafidon (1990) are sufficiently broad-ranging and methodologically reliable to be considered. Data from Tkachuk (1969) have also been included. Some additional values have been calculated from complete amino acid analyses, including amide nitrogen determinations. Finally, the results obtained by these
authors concerning the same plant protein source are often very similar, even if some exceptions exist. The data as a whole are consistent enough to derive a series of nitrogen-to-protein conversion factors that, despite some uncertainties, can be used to estimate more accurately the potential of a protein source to provide nitrogen and amino acids (Table 5). These data also allow us to propose an average default factor (5.60) which is more appropriate than 6.25. A summary of the average factors for the main classes of dietary protein foodstuffs is given in Table 6.
Conclusions
Because Jones’ factors have been used for more than 75 years to convert nitrogen into protein, despite their flawed scientific foundations, it is clearly difficult to move from the current position. However, from a scientific point of view, it is no longer reasonable to apply these factors. We recommend that the present set of data, which is based on a robust paradigm and a review of accurate determinations, should be used when the aim is to specifically express nitrogen in terms of protein. These factors are of particular importance when “protein” in fact means “amino acids”. We hope that the present critical review will stimulate further scientific and regulatory discussions concerning this issue.
Table 1. Conversion factors calculated from the amino acid sequences in milk proteins1 Factor 2 K K’ Casein αs1 6.36 6.19 Casein αs2 6.30 6.06 Casein β 6.37 6.28 Casein κ 6.35 6.11 β lactoglobulin 6.29-6.38 6.34 α lactalbumin 6.26 6.26 Serum albumin 6.08 6.08 Casein 3 6.36 6.22 Milk protein 3 6.32 6.19 Milk 3 5.92 5.80
1 data from Farell et al. (2004)
2 K: factor calculated including prosthetic groups in the polypeptide mass. The results are
identical to those obtained by van Boeckel and Ribadeau-Dumas (1987). K’: factor excluding prosthetic groups in the mass of polypeptide mass.
3 The factors for casein, milk protein and milk, were calculated from their content in the 7 main
constituent proteins, and for milk on the basis of non protein nitrogen levels reaching 6.4 percent of total nitrogen (Barbano et al., 1991).
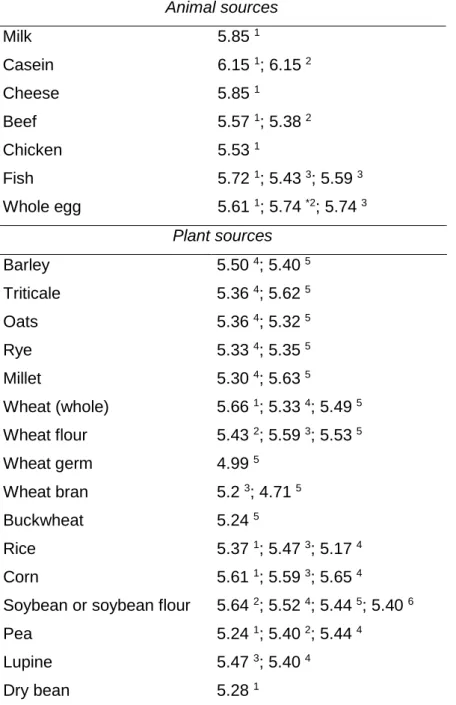
Table 2. Conversion factors calculated from amino acid analysis Animal sources Milk 5.85 1 Casein 6.15 1; 6.15 2 Cheese 5.85 1 Beef 5.57 1; 5.38 2 Chicken 5.53 1 Fish 5.72 1; 5.43 3; 5.59 3 Whole egg 5.61 1; 5.74 *2; 5.74 3 Plant sources Barley 5.50 4; 5.40 5 Triticale 5.36 4; 5.62 5 Oats 5.36 4; 5.32 5 Rye 5.33 4; 5.35 5 Millet 5.30 4; 5.63 5 Wheat (whole) 5.66 1; 5.33 4; 5.49 5 Wheat flour 5.43 2; 5.59 3; 5.53 5 Wheat germ 4.99 5 Wheat bran 5.2 3; 4.71 5 Buckwheat 5.24 5 Rice 5.37 1; 5.47 3; 5.17 4 Corn 5.61 1; 5.59 3; 5.65 4
Soybean or soybean flour 5.64 2; 5.52 4; 5.44 5; 5.40 6
Pea 5.24 1; 5.40 2; 5.44 4
Lupine 5.47 3; 5.40 4
Dry bean 5.28 1
* Egg white; 1 Sosulski and Imafidon (1990) ; 2 Sarwar et al. (1983) 3 Pion
and Prugnaud (personal communication) ; 4 Mossé (1990) ; 5 Tkachuk
(1969) ; 6 Morr (1982)
Methods : Complete amino acid determination involving 6N HCl hydrolysis once (1, 6) or on several occasions (2 - 5), specific hydrolysis for
tryptophan or sulfur amino acid determinations (1 – 6) and amide nitrogen
measurements with specific hydrolysis (1, 4) or calculated from ammonia in
Table 3. Specific usual conversion factors, as proposed by Jones 1
Proteins Factor
Milk 6.38
Other animal products 6.25
Gelatin 5.55 Barley 5.83 Oats 5.83 Rye 5.83 Wheat (whole) 5.83 Wheat (endosperm) 5.70 Wheat (bran) 6.31 Rice 5.95 Corn 6.25 Sorghum 6.25 Soybean 5.71 Other legumes 2 6.25 Peanut 5.46 Almonds 5.18 Brazil nut 5.46
Other oil seeds and nuts 5.30
1 Jones (1941), cited in subsequent literature (for example: Pellett and Young,
1980, Leung et al., 1968) ; 2 Data corresponding to the following legume pulses:
Table 4. How the nitrogen conversion factor affects estimates of protein content and protein quality in wheat and bean.
Wheat 1
Nitrogen basis
Crude protein basis
Jones factors Real specific factor Nitrogen 2.35 g/100 g Protein 2.35x6.25= 14.69 g/100 g 2.35x5.83= 13.70 g/100g 2.35x5.49= 12.90 g/100 g Lysine 378 mg/100 g Lysine 161 mg/g_N 25.7 mg/g_prot 27.6 mg/g_prot 29.3 mg/g_prot Lysine, reference pattern2 320 mg/g_N 51 mg/g_prot (Nx6.25) 51 mg/g_prot (Nx6.25) 51 mg/g_prot (Nx6.25) Chemical score 161/320= 0.50 25.7/51= 0.50 27.6/51= 0.54 29.3/51= 0.57 Navy bean 1 Nitrogen basis Crude protein basis
Jones factors Real specific factor Nitrogen 1.317g/100g Protein 1.317x6.25= 8.23 g/100 g 1.317x6.25= 8.23 g/100 g 1.317x5.28= 6.95 g/100 g Sulfur amino acids 187 mg/100 g Sulfur amino acids 142 mg/g_N 22.7 mg/g_prot 22.7 mg/g_prot 26.9 mg/g_prot Sulfur amino acid reference pattern2 156 mg/g_N 25.0 mg/g_prot (Nx6.25) 25.0 mg/g_prot (Nx6.25) 25.0 mg/g_prot (Nx6.25) Chemical score 142/156= 0.91 22.7/25= 0.91 22.7/25= 0.91 26.9/25= 1.08
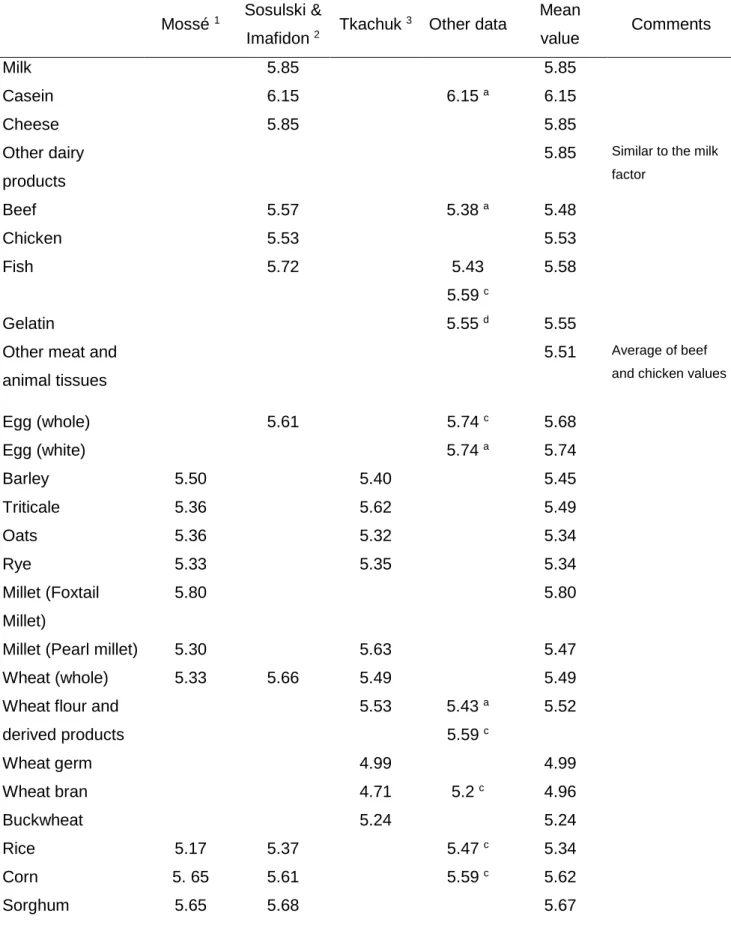
Table 5. Conversion factors, mostly drawn from the studies by Mossé, Sosulski & Imafidon and Tkachuk, and average specific conversion factors to be retained
Mossé 1 Sosulski &
Imafidon 2 Tkachuk
3 Other data Mean
value Comments Milk 5.85 5.85 Casein 6.15 6.15 a 6.15 Cheese 5.85 5.85 Other dairy products
5.85 Similar to the milk factor Beef 5.57 5.38 a 5.48 Chicken 5.53 5.53 Fish 5.72 5.43 5.59 c 5.58 Gelatin 5.55 d 5.55
Other meat and animal tissues
5.51 Average of beef and chicken values
Egg (whole) 5.61 5.74 c 5.68 Egg (white) 5.74 a 5.74 Barley 5.50 5.40 5.45 Triticale 5.36 5.62 5.49 Oats 5.36 5.32 5.34 Rye 5.33 5.35 5.34 Millet (Foxtail Millet) 5.80 5.80
Millet (Pearl millet) 5.30 5.63 5.47
Wheat (whole) 5.33 5.66 5.49 5.49
Wheat flour and derived products 5.53 5.43 a 5.59 c 5.52 Wheat germ 4.99 4.99 Wheat bran 4.71 5.2 c 4.96 Buckwheat 5.24 5.24 Rice 5.17 5.37 5.47 c 5.34 Corn 5. 65 5.61 5.59 c 5.62 Sorghum 5.65 5.68 5.67
Other cereals 5.5 Average of Cereal factors Soybean or soybean meal 5.52 5.44 5.64 a 5.40 c 5.50 Pea 5.44 5.24 5.40 d 5.36 Lupin 5.40 5.47 c 5.44 Dry bean 5.28 5.28
Other legumes 5.40 Average of 4
legumes
Mustard (yellow) 5.12 5.12
Rapeseed 5.29 5.41 a 5.35 4
Sunflower (hulled) 5.29 5.29
In absence of specific factors Vegetables, mushrooms and leaf proteins 4.4 5, 6 Average default factor 7 5.6
1 Mossé (1990); 2 Sosulski and Imafidon (1990); 3 Tkachuk (1969); 4 Less well-documented data, such as that generated
by Henkle & Mosenthin (1989, cited by Zeb, 1998) and Simbaya et al. (1996) were not retained; 5 Fujihara et al. (2001),
Sosulski and Imafidon (1990), Mattila et al. (2002), see also other notes; 6 Yeoh and Wee (1994) see also other notes; 7
When there is no specific factor for a protein source and for mixed products made of several different protein sources. The factor is based on the mean of average animal and average plant protein factors.
a : From the data put forward by Sarwar et al. (1983); b : Jones (1941) ; c : Pion et Prugnaud (personal communication) ; d :
calculated from Morr's data (1992).
Methods : Complete amino acid determination involving 6N HCl hydrolysis once (2, d) or on several occasions (1, 3, a, c),
specific hydrolysis for tryptophan or sulfur amino acid determinations (1, 2, 3, a, c, d) and amide nitrogen measurements with
specific hydrolysis (1, 2) or calculated from ammonia in 6N HCl hydrolysates (3, a, c, d).
Other notes: Some factors for low protein sources such as chocolate or coffee (Leung et al.. 1968) or concerning for example flaxseed (Tkachuk, 1969) or wild or tropical plants (Ezeagu et al., 2002) were not included. Only an average conversion factor was presented for all vegetables. Indeed, the factor for vegetables is highly variable as a function of species (for example tomato and lettuce) and according to different authors (Fujihara et al., 2001. Mattila et al., 2002. Sosulski and Imafidon, 1990). Furthermore, the average conversion factor reported in the present study for vegetables and leaf proteins is kP whereas the other factors in this table are means of kP and kA. Indeed kP is more appropriate for those low protein sources that are rich in non-protein nitrogen.
Table 6. Average conversion factors for the main classes of protein sources 1
Sources Conversion factor
Milk and dairy products 5.85
Purified milk proteins 6.15
Meat, fish and eggs 5.6
Cereals: wheat, barley, oats, rye, triticale 5.4
Corn 5.6
Soybean 5.5
Other legume pulses 5.4
Vegetables and mushrooms 4.4
Other sources 5.6
Figure 1. Nitrogenous material in foodstuffs consists in (1) protein (s.s.) and free amino acids, the former being protein-bound amino acids (which contain the nitrogen) and non-nitrogenous groups in protein (the prosthetic groups) and (2) various non-nitrogenous compounds other than amino acids. The percent of Nitrogen in protein amino acids (Ratio R1) varies depending on the specific composition of amino acids, because amino acids differ in terms of their nitrogen content. The percentage of nitrogen in other nitrogenous compounds varies according to the nature of these compounds. « Protein » can be understood as either bulk nitrogen, irrespective of the nature of the nitrogenous compounds (« crude protein »), or as the amount of protein from a biochemical viewpoint (protein-bound amino acids plus prosthetic groups), or as the amount of amino acids (the most nutritionally relevant, although other nitrogenous compounds can affect the nitrogen balance). Therefore, in foodstuffs, translating the total amount of nitrogen into an amount of « protein », such as amino acids, cannot be achieved using a single factor (e.g. 6.25) because the specific factor varies according to (1) the proportion of each component ( I, II and III) and (2) the R1 and R2 ratio. Notwithstanding this complexity, we propose a compendium of specific factors that are based on a more realistic view than those adopted by Jones, which could interestingly be used to convert nitrogen into “protein” (as amino acids) in various foodstuffs.
Reference List
Barbano, D.M., Lynch, J.M., and Flemming, R.J. (1991). Direct and indirect determination of true protein content of milk by Kjeldahl analysis: collaborative study. J. Assoc. Off. Anal.
Chem. 74: 281-288.
Benedict, R.C. (1987). Determination of nitrogen and protein content of meat and meat products. J Assoc. Off. Anal. Chem. 70: 69-74.
Darragh, A. J., and Moughan, P. J. (2005) The effect of hydrolysis time on amino acid analysis. J. Aoac Int. 88: 888-893.
Daun, J. K., and Declercq, D. R. (1994) Comparison of Combustion and Kjeldahl Methods for Determination of Nitrogen in Oilseeds. J. Am. Oil Chem. Soc. 71: 1069-1072.
DRI (2005). Dietary reference intakes for energy, carbohydrate, fiber, fat, fatty acids, cholesterol, protein and amino acids. Institute of Medicine of the National Academies, Washington, DC.
Ezeagu, I.E., Petzke, J.K., Metges, C.C., Akinsoyinu, A.O., and Ologhobo, A.D. (2002). Seed protein contents and nitrogen-to-protein conversion factors for some uncultivated tropical plant seeds. Food Chem. 78: 105-109.
FAO/WHO (1991). Protein quality evaluation. FAO Food and Nutrition Paper 51. FAO, Rome, Italy.
FAO (2003). Food energy - methods of analysis and conversion factors. FAO Food and Nutrition Paper 77. Rome, Italy.
Farrell, H.M., Jimenez-Flores, R., Bleck, G.T., Brown, E.M., Butler, J.E., Creamer, L.K., Hicks, C.L., Hollar, C.M., Ng-Kwai-Hang, K.F., and Swaisgood, H.E. (2004). Nomenclature of the proteins of cows' milk - sixth revision. J. Dairy Sci. 87: 1641-1674.
Favier, J. C., Ireland-Ripert, J., Toque, C., and Feinberg, M. (1995). Ciqual databank - Répertoire général des aliments - Composition tables. 2nd ed. Lavoisier Tec & Doc, Paris.
Fujihara, S., Kasuga, A., and Aoyagi, Y. (2001). Nitrogen-to-protein conversion factors for common vegetables in Japan. J. Food Sci. 66: 412-415.
acid scores and of the nitrogen-to-protein conversion factors in barley grain as a function of nitrogen content as compared with wheat and rye. Plant Food Hum. Nutr. 38: 175-88.
Jones, D. B. (1941). Factors for converting percentages of nitrogen in foods and feeds into percentages of protein. US Department of Agriculture - circ. 183. Washington, DC.
Kies, C. (1974). Comparative value of various sources of nonspecific nitrogen for the human.
J. Agric. Food Chem. 22: 190-193.
Koletzko, B. and Shamir, R. (2006). Standards for infant formula milk. BMJ 332: 621-622.
Leung, W. W., Busson, F., and Jardin, C. (1968). Food composition table for use in Africa. FAO, Bethesda, MD:
Mattila, P., Salo-Väänänen, P., Konko, K., Aro, H., and Jalava, T. (2002). Basic composition and amino acid contents of mushrooms cultivated in Finland. J. Agric. Food Chem. 50: 6419-6422.
Møller, A, Saxholt, E., Christensen, A. T., Hartkopp, H. B., and Hess Ygil, K. (2005). Danish Food Composition Databank. 6 ed.Food Informatics, Department of Nutrition, Danish Institute for Food and Veterinary Research;.http://www.foodcomp.dk/.
Morr, C.V. (1982). Recalculated nitrogen conversion factors for several soybean protein products. J. Food Sci. 47: 1751-1752.
Mossé, J. (1985). The amino acid composition of wheat grain as a function of nitrogen content. J. Cereal Sci. 3: 115-130.
Mossé, J. (1990). Nitrogen to protein conversion factor for ten cereals and six legumes or oilseeds. A reappraisal of its definition and determination. Variation according to species and to seed protein content. J. Agric. Food Chem. 38: 18-24.
Peace, R. W., and Gilani, G. S. (2005) Chromatographic determination of amino acids in foods. J. Aoac Int. 88: 877-887.
Pellett, P. L., and Young, V. R. (1980). Nutritional evaluation of protein foods. United Nations University Press, Tokyo, Japan.
Piraud, M., Vianey-Saban, C., Bourdin, C., Acquaviva-Bourdain, C., Boyer, S., Elfakir, C., and Bouchu, D. (2005) A new reversed-phase liquid chromatographic/tandem mass
spectrometric method for analysis of underivatised amino acids: evaluation for the diagnosis and the management of inherited disorders of amino acid metabolism. Rapid Com. Mass
Spectrom. 19: 3287-3297.
Qu, J., Wang, Y. M., Luo, G., Wu, Z. P., and Yang, C. D. (2002) Validated quantitation of underivatized amino acids in human blood samples by volatile ion-pair reversed-phase liquid chromatography coupled to isotope dilution tandem mass spectrometry. Anal. Chem. 74: 2034-2040.
Sarwar, G., Christensen, D.A., Finlayson, A.J., Friedman, M., Hackler, L.R., Mackenzie, S.L., Pellett, P.L., and Tkachuk R., (1983). Inter- and intra-laboratory variation in amino acid analysis of food proteins. J. Food Sci. 48: 526-531.
Schaafsma, G. (2005). The protein digestibility-corrected amino acid score (PDCAAS) - a concept for describing protein quality in foods and food ingredients: a critical review. J.
AOAC Int. 88: 988-994.
Scherz, H., and Senser, F. (2000). Souci-Fachmann-Kraut food composition and nutrition tables. 6 ed. Medpharm Scientific Publishers, Stuttgart, Germany.
Simbaya, J., Slominski, B.A., Guenter , W., Morgan, A., and Campbell, L.D. (1996). The effects of protease and carbohydrase supplementation on the nutritive value of canola meal for poultry: In vitro and in vivo studies . Anim. Feed Sci. Technol. 61: 219-234.
Sosulski, F.W. and Imafidon, G.I. (1990). Amino acid composition and nitrogen-to-protein conversion factors for animal and plant foods. J. Agric. Food Chem. 38: 1351-1356.
Sosulski, F.W. and Holt, N.W. (1980). Amino acid composition and nitrogen-to-protein factors for grain legumes. Can. J. Plant Sci. 60: 1327-1331.
Thompson, M., Owen, L., Wilkinson, K., Wood, R., and Damant, A. (2002) A comparison of the Kjeldahl and Dumas methods for the determination of protein in foods, using data from a proficiency testing scheme. Analyst 127: 1666-1668.
Tkachuk, R. (1969). Nitrogen-to-protein conversion factors for cereals and oilseed meals.
Cereal Chem. 46: 419-423.
USDA data bank (2005) http://www.nal.usda.gov/fnic/foodcomp/Data/SR18/SR18_doc.pdf.
factor for conversion of the nitrogen content of milk and milk products to protein content.
Neth. Milk Dairy J. 41: 281-284.
Wiles, P. G., Gray, I. K., and Kissling, R. C. (1998) Routine analysis of proteins by Kjeldahl and Dumas methods: review and interlaboratory study using dairy products. J. AOAC Int. 81: 620-632.
Yeoh, H.H., and Wee, Y.C. (1994). Leaf protein content and nitrogen-to-protein conversion factors for 90 plant species. Food Chem. 49: 245-250.
Zeb, A. (1998). Possibilities and limitations of feeding rapeseed meal to broiler chicks. Georg-August University,Academic Department, Faculty of Agricultural Sciences, Göttingen, Germany. http://webdoc.sub.gwdg.de/diss/1998/zeb/inhalt.htm.