HAL Id: hal-02326073
https://hal.archives-ouvertes.fr/hal-02326073
Submitted on 18 Dec 2019HAL is a multi-disciplinary open access
archive for the deposit and dissemination of sci-entific research documents, whether they are pub-lished or not. The documents may come from teaching and research institutions in France or abroad, or from public or private research centers.
L’archive ouverte pluridisciplinaire HAL, est destinée au dépôt et à la diffusion de documents scientifiques de niveau recherche, publiés ou non, émanant des établissements d’enseignement et de recherche français ou étrangers, des laboratoires publics ou privés.
Assessing the Surface Oxidation State of Free-Standing
Gold Nanoparticles Produced by Laser Ablation
Manuel de Anda Villa, Jérôme Gaudin, David Amans, Fahima Boudjada,
John Bozek, Robert Evaristo Grisenti, Emily Lamour, Gaétan Laurens,
Stéphane Macé, Christophe Nicolas, et al.
To cite this version:
Manuel de Anda Villa, Jérôme Gaudin, David Amans, Fahima Boudjada, John Bozek, et al.. Assessing the Surface Oxidation State of Free-Standing Gold Nanoparticles Produced by Laser Ablation. Lang-muir, American Chemical Society, 2019, 35 (36), pp.11859-11871. �10.1021/acs.langmuir.9b02159�. �hal-02326073�
ASSESSING THE SURFACE OXIDATION STATE
OF FREE-STANDING GOLD NANOPARTICLES
PRODUCED BY LASER ABLATION
Manuel De Anda Villaa, Jérôme Gaudinb, David Amansc, Fahima Boudjadac, John Bozekd, Robert
Grisentie,f, Emily Lamoura, Gaétan Laurensc, Stéphane Macéa, Christophe Nicolasd, Irene
Papagiannoulib, Minna Pataneng, Christophe Prigenta, Emmanuel Robertd, Sébastien Steydlia,
Martino Trassinellia, Dominique Vernheta and Anna Lévya*
a Institut des Nanosciences de Paris, Sorbonne Université - Pierre et Marie Curie, CNRS
UMR7588, 75005 Paris, France. Email : levy@insp.jussieu.fr
b Univ. Bordeaux, CNRS, CEA, CELIA (Centre Lasers Intenses et Applications), UMR5107,
F-33405 Talence, France.
c Univ Lyon, Université Claude Bernard Lyon 1, UMR5306 CNRS, Institut Lumière Matière,
F-69622, Villeurbanne, France.
d Synchrotron SOLEIL, L’Orme des Merisiers, Saint-Aubin, BP 48, F-91192 Gif-sur-Yvette
Cedex, France.
e GSI Helmholtzzentrum für Schwerionenforschung GmbH, Planckstr. 1, 64291 Darmstadt,
Germany
f Institut für Kernphysik, J. W. Goethe-Universität, Max-von-Laue-str. 1, 60438 Frankfurt am
g Nano and Molecular Systems Research Unit, Faculty of Science, University of Oulu, P.O. Box
3000, FI-90014, Finland.
KEYWORDS: gold nanoparticles; pulsed laser ablation in liquids; x-ray photoelectron spectroscopy; oxidation state; Bayesian statistics.
ABSTRACT: Surface chemistry of gold nanoparticles produced by pulsed laser ablation in liquids method is investigated by X-ray Photoelectron Spectroscopy (XPS). The presence of surface oxide expected on these systems is investigated using synchrotron radiation in conditions close to their original state in solvent, but free from substrate or solvent effects which could affect the interpretation of spectroscopic observations. For that purpose, we performed the experiment on a controlled free-standing nanoparticle beam produced by the combination of an atomizer and an aerodynamic lens system. These results are compared with those obtained by the standard situation of deposited nanoparticles on silicon substrate. An accurate analysis based on Bayesian statistics concludes that the existence of oxide in the free-standing conditions cannot be solely confirmed by the recorded core-level 4f spectra. If present, our data indicate an upper limit of 2.15 ± 0.68 % of oxide. However, a higher credence to the hypothesis of its existence is brought by the structure-less valence profile of the free-standing beam. Moreover, the cross-comparison with the deposited nanoparticles case clearly evidences an important misleading substrate effect. Experiment with free-standing nanoparticles is then demonstrated to be the right way to further investigate oxidation states on Au-NP.
INTRODUCTION
Matter at the nanoscale level is at the crossroads of material science, chemistry and physics. It has led to outstanding developments of different applications1 in various fields ranging from medicine to information technology. The promising properties of nanoparticles (NPs) are related to their reduced size and surface properties. Among the different nanoscale materials, gold is mostly studied due to its noble character, low toxicity and good biocompatibility. For these reasons, several investigations are being carried out in the field of medicine2 and catalysis3-5. Surface
chemistry is at the heart of such studies which are very sensitive to the composition/structure/oxidation states of the surface atoms.
Gold nanoparticles are usually produced in liquid phase (colloids) by wet chemical reduction6-8. This synthesis, achieved by the reduction of a metal salt precursor, requires the use of stabilization agents. These long molecular chains adsorbed on the nanoparticle surface are used to control the nanoparticle size and prevent their aggregation. However, most applications are based on a further surface functionalization or on plasmonic properties, which both could be prevented/modified by the presence of the stabilizing agent at the nanoparticle surface. The required and challenging subsequent colloid purification9 can be circumvented by using another nanoparticle synthesis technique10. The Pulsed Laser Ablation in Liquids (PLAL) method, widely developed in the past
few years11-15, is based on laser irradiation of a solid target in a liquid environment and results in the formation of ligand-free nanoparticles. These bare nanoparticles in organic or non-organic solvents are well-suited for the development of the above-mentioned applications, which nevertheless require a precise knowledge of their surface properties16.
In the present experimental study, we address the question of the surface chemical composition of bare nanoparticles produced by laser ablation using X-ray Photoelectron Spectroscopy (XPS). As important properties of gold NP colloids produced by PLAL such as their stability have been attributed to the presence of oxides on NP surface, numerous other studies1617-21 have tracked these oxidation states using XPS measurements. However, as reported in Table 1 (upper part), if present17,18,21, the amount of oxide atoms in PLAL produced nanoparticles is always estimated to be below 10%, while some studies19 report no surface oxidation for particles produced in pure
water. One should stress that, in all cases, the measurements are performed on nanoparticles deposited on a substrate. The disparity in the reported oxide presence illustrates the complexity of core-level XPS peak fitting for a precise quantification of this oxide component, especially when present in such a low amount. It is also related to the difficulty of peak attribution to a specific oxide complex like AuO, Au2O or Au2O3 for instance - their expected binding energies and peak
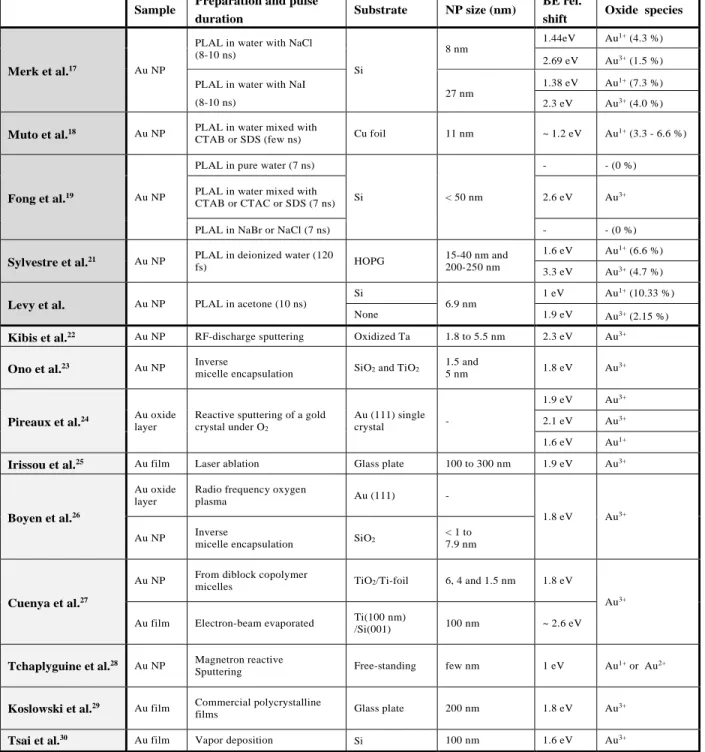
widths being highly dependent on substrate and nanoparticle size. The variety of reported results recorded on gold films or NP produced by various techniques is summarized in Table 1 extracted from references 17 to 19 and 21 to 30, together with results presented in this paper.
Hereby, we present an alternative experimental and data analysis approach in order to circumvent the above-mentioned challenges. We report XPS measurements performed on free-standing nanoparticles which are subsequently accurately analysed using a Bayesian statistical method for hypotheses tests31 of the core-level peak fitting. This specific data treatment method is also applied to results obtained in the standard situation of deposited nanoparticles. Results comparison led us to conclude on the substrate influence on the nanoparticle surface oxidation.
Table 1 Overview surface oxide species on gold films or nanoparticles (NP) reported in published studies and this work. The upper part of the table is dedicated to NP produced by
PLAL. The lower one reports results obtained on other systems including NP produced through other synthesis techniques and bulk samples. The identified oxide species Aun+ are reported with their binding energy shift of the 4f electronic level relative to Au0.
Sample Preparation and pulse
duration Substrate NP size (nm)
BE rel.
shift Oxide species
Merk et al.17 Au NP
PLAL in water with NaCl (8-10 ns)
Si
8 nm
1.44eV Au1+ (4.3 %)
2.69 eV Au3+ (1.5 %)
PLAL in water with NaI
(8-10 ns) 27 nm
1.38 eV Au1+ (7.3 %)
2.3 eV Au3+ (4.0 %)
Muto et al.18 Au NP PLAL in water mixed with
CTAB or SDS (few ns) Cu foil 11 nm ~ 1.2 eV Au
1+ (3.3 - 6.6 %)
Fong et al.19 Au NP
PLAL in pure water (7 ns)
Si < 50 nm
- - (0 %) PLAL in water mixed with
CTAB or CTAC or SDS (7 ns) 2.6 eV Au
3+
PLAL in NaBr or NaCl (7 ns) - - (0 %)
Sylvestre et al.21 Au NP PLAL in deionized water (120
fs) HOPG
15-40 nm and 200-250 nm
1.6 eV Au1+ (6.6 %)
3.3 eV Au3+ (4.7 %)
Levy et al. Au NP PLAL in acetone (10 ns)
Si
6.9 nm
1 eV Au1+ (10.33 %)
None 1.9 eV Au3+ (2.15 %)
Kibis et al.22 Au NP RF-discharge sputtering Oxidized Ta 1.8 to 5.5 nm 2.3 eV Au3+
Ono et al.23 Au NP Inverse
micelle encapsulation SiO2 and TiO2
1.5 and
5 nm 1.8 eV Au
3+
Pireaux et al.24 Au oxide
layer
Reactive sputtering of a gold crystal under O2 Au (111) single crystal - 1.9 eV Au3+ 2.1 eV Au3+ 1.6 eV Au1+
Irissou et al.25 Au film Laser ablation Glass plate 100 to 300 nm 1.9 eV Au3+
Boyen et al.26
Au oxide layer
Radio frequency oxygen
plasma Au (111) -
1.8 eV Au3+
Au NP Inverse
micelle encapsulation SiO2
< 1 to 7.9 nm
Cuenya et al.27
Au NP From diblock copolymer
micelles TiO2/Ti-foil 6, 4 and 1.5 nm 1.8 eV
Au3+
Au film Electron-beam evaporated Ti(100 nm)
/Si(001) 100 nm ~ 2.6 eV
Tchaplyguine et al.28 Au NP Magnetron reactive
Sputtering Free-standing few nm 1 eV Au
1+ or Au2+
Koslowski et al.29 Au film Commercial polycrystalline
films Glass plate 200 nm 1.8 eV Au
3+
EXPERIMENTAL SECTION
Material
Commercial ligand-free gold nanoparticles in pure acetone have been acquired from the NanoBio Division of IMRA America, Inc. Company, specialist in the production of noble metal nanoparticle colloids by PLAL. This volatile solvent (acetone vapour pressure at 20°C = 240 hPa) has been chosen in order to maximize its evaporation and to ensure the probing of solvent-free nanoparticles. The nominal concentration of the stock solution was 1 g/L. Two nearly identical sample batches have been used for the optimization of the preparation procedure, sample characterization and XPS measurements in deposited conditions (batch A) and the XPS measurements on the free-standing nanoparticles beam (batch B).
Transmission electron microscopy and centrifugal sedimentation
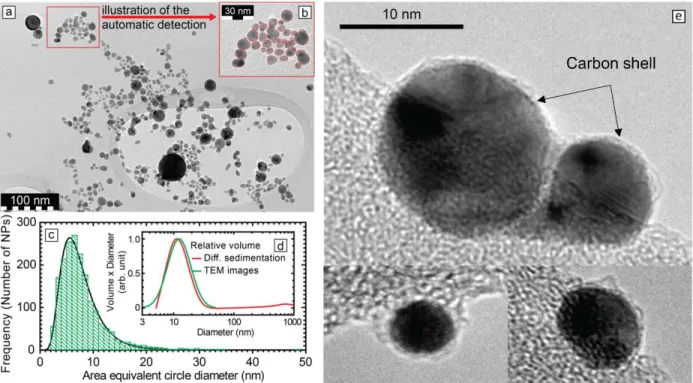
The sample size characterization is performed using transmission electron microscopy (TEM) and centrifugal sedimentation techniques. For TEM measurements, 30 µL of the pristine solution (batch A) is diluted in 1470 µL of acetone (1/50). Then a droplet of the diluted colloidal solution is poured onto a 400-mesh copper grid covered with ultrathin carbon film on lacey carbon support film (reference 01824 from Ted Pella, inc.). TEM is carried out on a JEOL 2100HT microscope operating at 200 kV. Images are acquired using a Gatan Orius 200 camera. The size distribution is deduced from the analysis of images with magnification of 50 kX and 120 kX. A representative image is shown in Figure 1a (50 kX). Nanoparticles were automatically detected with the plugin Particles Sizer in ImageJ32 (see Figure 1b). 1847 nanoparticles were detected and led to the size
the area equivalent circle. The size distribution is characterized by a median size of 6.9 nm, and a standard deviation of 4.2 nm. The distribution follows a log-normal law (see Figure 1c).
In order to cross-check the size distribution deduced from TEM, the centrifugal sedimentation is performed with the disc centrifuge system DC24000 from CPS Instruments. The measurement is based on the differential sedimentation of the particles in a sucrose density gradient. A calibration is performed before each measurement using a calibration standard of 263 nm PVC spheres dispersed in water (from CPS instruments). Since the sucrose gradient is only suitable for aqueous colloids, an exchange of the solvent is performed as a first step. 1 mL of the pristine solution (batch A) is diluted in 9 mL of deionized water. Acetone is slowly evaporated at room temperature and reduce pressure (0.200 bar) using a rotary evaporator. Then 100 µL of the remaining aqueous colloidal solution is injected in the disc centrifuge system. The speed ramping option is selected to finely probe sizes from a few nanometers to one micrometer. In Figure 1d, the relative volume distribution obtained from the differential sedimentation is compared to the one deduced from the log-normal fit of the size frequency deduced from the TEM images (Figure 1c). Both methods lead to consistent results.
Finally, high resolution TEM images were achieved by operating the JEOL 2100HT microscope at the reduced voltage of 120 kV. For that purpose, 25 µL of the pristine solution (batch A) is diluted in 475 µL of acetone (1/20). Then a droplet of the diluted colloidal solution is poured onto a 400-mesh copper grid covered with an holey carbon film (reference AGS147-4 from Agar Scientific Ltd). This specific measurement has been performed in order to investigate the possible presence of a carbon shell surrounding the nanoparticle when produced in organic solvents, as reported in the literature14,33-40. It is confirmed in Figure 1e where a low-Z non continuous shell is observed around the nanoparticles, attributed to one or two graphite monolayers (see below).
Figure 1 (a) Representative TEM image for a 50 kX magnification. The inset (b) shows an
example of the automatic detection of the NPs. (c) Frequency of the particle diameters deduced
from the TEM images (1847 particles, median size 6.9 nm, standard deviation 4.2 nm). The
distribution is fitted assuming a log-normal distribution 𝜌𝜌(𝑑𝑑) (black curve, adjusted R2 = 0.99,
median size 6.8 nm, standard deviation 3.5 nm). (d) Relative volume distribution 𝝆𝝆𝒗𝒗(𝒅𝒅) times
the particle diameter 𝒅𝒅. The red curved is measured with differential sedimentation system. The
green curve is deduced from the fit of the frequency count (𝜌𝜌𝑣𝑣(𝑑𝑑) 𝛼𝛼 𝑑𝑑3𝜌𝜌(𝑑𝑑)). (e) High resolution
TEM images evidencing a thin monolayer graphitic shell. Raman Spectroscopy
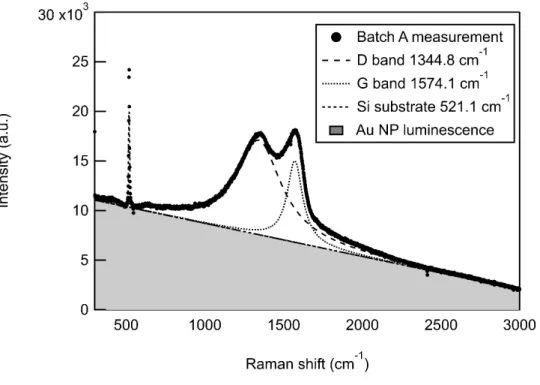
In order to confirm the graphitic shell existence in our experiment, Raman spectroscopy measurements have been performed on batch A at 1 g/L. A colloid droplet is dried on a Si substrate: the sample is first dried during two hours in an oven at 70°C and then freeze-dried. Raman spectra
were measured on a LabRAM HR Evolution Raman microscope from HORIBA, using a laser line at 660 nm (180 mW). The spectral resolution is 4.7 cm-1 FWHM (full width at half maximum).
Three features are clearly observed in the spectrum displayed in Figure 2: a signal at 521.1 cm-1 which correspond to the Si substrate, both D (1344.8 cm-1) and G (1574.1 cm-1) bands from the sp2 hybridized carbon materials, and a smooth slope attributed to gold luminescence.
Figure 2 Raman spectra from Au NP 1 g/L batch A deposited on Si substrate.
The G band corresponds to ordered sp2 hybridized carbon materials (E2g mode), while the D band
can be associated to a defect activated band in sp2 hybridized carbon materials41 and/or can be caused by a breakdown of the k-selection rule in small crystallite size of polycrystalline graphite42.
The G band appears slightly shifted downward compared to what expected for graphite, i.e. 1582 cm-1. However, the same shifted is observed for carbon onions43 and is attributed to tensile strain in the graphene planes induced by the curvature. The Raman spectrum reported in Figure 2 is then
consistent with a very thin graphitic shell of a few layers surrounding gold nanoparticles44. Thus, the observation of both D and G bands in our measurement, expected from a few graphene layers, is in agreement with high resolution TEM images reported above (see Figure 1e).
In addition, the ratio of D and G bands (ID/IG) is commonly used to give an estimate about defect
densities33. Broad peaks and high values of the ratio I
D/IG observed in Figure 2 suggest a large
amount of defects in the graphitic shell, but graphene oxide can also lead to similar features, with a broad D band41,45,46. However, the wavenumber reported for the G band is shifted toward the high wavenumbers in graphene oxide, above 1594 cm-1 (ref. 45-46), which is not consistent with the Raman shift observed for the G band in our sample (1574.1 cm-1). Glassy carbon (amorphous) which contains sp3 hybridized carbon can also present a large D band47-49 and a downward shift of
the G-band49. Thus, contributions from glassy carbon cannot be excluded.
Finally, one can note that the deposit consists in a dendritic layer, i.e. a stacking of gold nanoparticles from 2 nm to 20 nm. Such geometry leads to a strong surface enhanced Raman scattering (SERS) for compounds adsorbed on the gold nanoparticles surface, then for the expected graphite layers. Moreover, there is a synergic effect in dimer, with a strong field enhancement in a volume between two close nanoparticles at 660 nm50, a configuration which would frequently occur in a dendritic layer. It could explain the rather strong signal observed from D and G bands while high resolution TEM only show a few layers of carbon shell on the particles (see Figure 1e).
Deposited x-ray photoelectron spectroscopy measurements and surface characterization
In order to perform a comparative study of deposited and free-standing nanoparticles, standard XPS measurements have been carried out at the Center of Microscopy and Nanotechnology, University of Oulu (Finland). For that purpose, Thermo Fisher Scientific ESCALAB 250Xi (UK)
with a monochromatized Al Kα x-ray source (1486.7 eV of photon energy with 900 µm spot size, operated at 300 W) was used to record XPS spectra of samples deposited on Si substrate. An electron flood gun was used for charge compensation. All measurements were made in an ultrahigh vacuum chamber (5.10-9 mbar). Si discs were first cleaned using Ar ion bombardment. Four Si substrates were prepared: one reference without a sample, one on which pure acetone was drop casted, and two for Au NP (batch A at 1 g/L). As the cleaned substrates had to be exposed to ambient conditions for a short time when the samples were drop casted on them, the plain Si substrate served as a reference to monitor how much contamination resulted from this exposure. C 1s spectrum indicated that this contamination remained very low. The binding energy scale has been calibrated based on the Si 2p peak position51. The x-axis is, in this case, relative to the Fermi level.
Using this setup, the Au NP surface oxidation is investigated by measuring the Au 4f core-level fitted with the Bayesian procedure described below. The corresponding results are reported in the RESULTS AND DISCUSSION section in comparison with what obtained in free-standing conditions.
Figure 3 C 1s spectrum from Au NP 1g/L batch A and dried acetone on Si substrate.
In addition, the presence of the graphitic shell surrounding the nanoparticle evidenced by high resolution TEM and Raman spectroscopy has been also examined by probing the C 1s core-level of the deposited sample. The corresponding spectrum reported in Figure 3 is indeed representative of reduced graphite oxide46. The difference observed on this spectrum compared to dried acetone on Si substrate confirms that the graphite signature originates from the nanoparticle itself.
Preparation
For the purpose of free-standing nanoparticle XPS measurements, the colloid concentration has been increased up to the required value (~ 2 to 5 g/L) on both sample batches. It has been achieved by a gentle partial evaporation of the solvent at moderate temperature (~ 50°C) and reduce pressure (~ 0.5 bar) using a rotary evaporator.
UV-visible spectroscopy
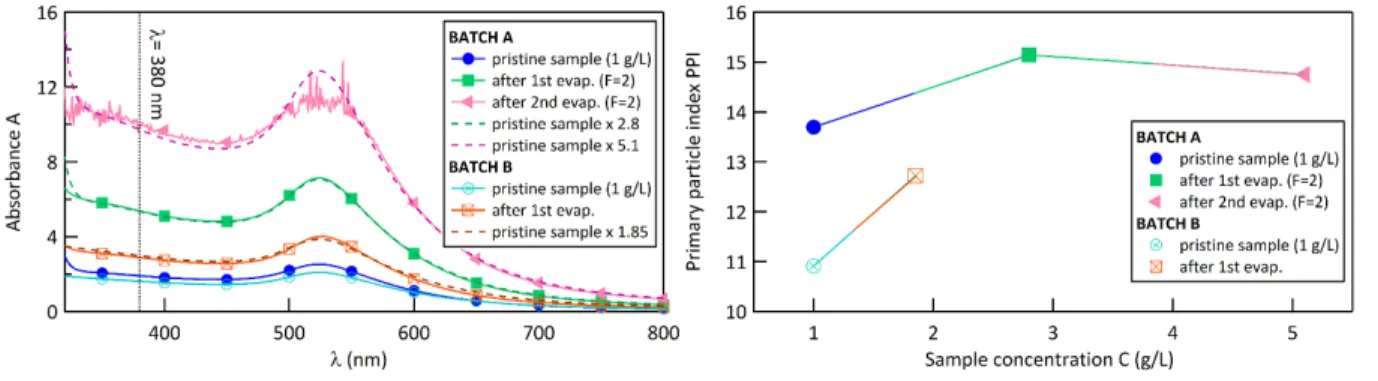
The visible spectra reported in Figure 4 have been collected with an Agilent Cary 4000 UV-Vis spectrophotometer. Using an optical glass cuvette of 1 mm path length, the sample absorbance A is recorded in the wavelength range of 300 to 800 nm. In the following, this measurement is used to retrieve the sample concentration according to the absolute absorbance increase after solvent evaporation. Besides the expected plasmon peak profile centred around 525 nm, the absorbance spectra are also sensitive to the nanoparticle aggregation quantified by the primary particle index52,53 (PPI). The PPI is defined as the ratio between the interband absorption at λ = 380 nm, mainly related in a first approximation to the mass concentration of gold in the colloidal solution, and the scattering signal of aggregates and larger particles at λ = 800 nm: PPI =
A380/A800nm. Hence, this parameter is inversely related to the agglomeration: a relative decrease
would be interpreted as a partial aggregation of the NPs in the colloid.
Figure 4 UV-Vis absorbance spectra (left) and calculated primary particle index (PPI) (right)
of (A) Batch A: before any evaporation (pristine sample) in filled dark blue circles; after a 1st
evaporation in filled green squares; after a 2nd evaporation in filled pink triangles and (B) Batch B: before any evaporation (pristine sample) in crossed light blue circles (this specific curve is extracted from the technical datasheet provided by IMRA America Inc.); after a 1st evaporation in crossed orange squares. Absorption spectra of Batch A 1st and 2nd evaporation and the pristine sample of Batch B have been recorded after dilution by a factor F indicated in the legend but the associated curves are corrected by this factor. The dotted lines correspond to the pristine sample absorbance spectrum multiplied by the adequate factor reported in the legend to fit the absorption curves after evaporation. This procedure is used to evaluate the sample concentration after solvent evaporation. PPI are calculated using the absorbance at 380 and 800 nm for each sample batch and evaporation.
Nanoparticle beam generation: aerodynamic lens system
The nanoparticle beam generation is achieved by using a specific instrument of the PLEIADES beamline of SOLEIL synchrotron facility (Saint-Aubin, France). A detailed description of this
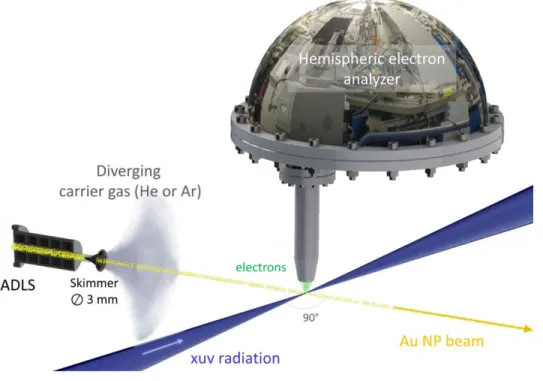
system has been reported in ref. 54. Briefly, the nanoparticle colloidal solution is first converted into an aerosol produced by a commercial atomizer source (TSI Inc. 3076). The droplets are thereafter steered through a silica gel dryer in order to evaporate the residual solvent. The nanoparticle flow is then focused in the interaction chamber thanks to an aerodynamic lens (ADLS), schematized in Figure 5, with an entrance pinhole of 300 µm diameter.
Figure 5 Experimental setup of the XPS measurement of the Au NP beam generated by means of the ADLS.
The ADLS apparatus, initially proposed by McMurry and co-workers55,56, consists in a succession
of coaxial apertures of decreasing diameters throughout in which an inert carrier gas (Ar or He in our case) transports the nanoparticles into the vacuum environment. A 3 mm diameter skimmer at the output beam of the ADLS contributes to the separation of the diverging carrier gas from the collimated nanoparticle flow and ensures the good vacuum in the interaction chamber required for the XPS detection system (< 10-5 mbar). The nanoparticle beam diameter is expected57 to be < 230
µm. This aerosol setup is therefore used to (i) efficiently extract the nanoparticles from their liquid environment and (ii) achieve a sufficiently high particle density (106 particles/cm3) at the
interaction point with the synchrotron radiation beam, enabling their detection within a reasonable accumulation time (less than 2 hours for the present experimental results).
Free-standing x-ray photoelectron spectroscopy measurements
Au 4f core-level and valence band XPS spectra of the free-standing nanoparticles have been recorded using the permanent end-station of the PLEIADES beamline with a VG-Scienta R4000 electron energy analyzer. Using 600 µm monochromator exit slit, 800 µm Scienta entrance slit, circular left polarization and a pass energy of 200 eV, the soft X-ray photon energy was set to 200 eV (Au 4f) and 100 eV (valence) with 0.6 and 0.2 eV estimated overall spectral resolutions respectively (FWHM of the Gaussian spectral resolution function). The transverse photon beam size is set to 120 x 780 µm² (FWHM). Owing to the position sensitive detector of the electron analyzer operated in transmission mode, the signals coming from the collimated nanoparticle beam and diverging gas phase components (carrier gas, residual solvent) can be discriminated. As represented in Figure 5, the electron energy analyzer stands up to the horizontal plane defined by the nanoparticle and photon beams which cross with an angle of 90°. The energy calibration is determined with respect to the vacuum level using both the Ar 3s satellites58 and the Ar 2p core level (located at 248.4 and 250.6 eV binding energies), the latter originating from the 2nd order synchrotron radiation. The uncertainty on the calibration may induce non negligible systematic uncertainty which are not discussed here since the analysis relies only on the relative shift of the different components.
The core-level spectra are fitted using a home-made program31 procedure, Nested_Fit, based on Bayesian statistical methods59. Such data analysis procedure is more robust than
the standard ones usually based on the maximization of the likelihood function or the minimization of the chi-square, i.e. an estimation of the fitting quality for a given model function. Indeed, it also provides the complete probability distribution for each fitting parameter, the conjunct probability of pairs of parameters, and, last but not least, the Bayesian evidence. The latter is a quantity required to compare different fitting models. In other words, from this output value, the relative probability of different hypotheses for modelling the spectra can be determined in such a way that one can discriminate the most probable one. The analysis is based on the assumption of Poisson distribution for the counts in each spectrum channel which is especially adapted for low statistics data. Such cautious analysis is especially useful for XPS data in two situations: the presence of various overlapping components in one single core-level peak and low statistics data associated to the presence of minor components60. The results presented in this contribution correspond to both cases: (i) the possible presence of gold oxide components in the Au 4f core-level spectra is expected to be in a low relative amount (below 10% according to literature17,19,21), (ii) the acquisition count rate is especially low (1000 to 2000 total counts in 2h acquisition time), especially in the case of a such dilute sample, i.e. a free-standing nanoparticle beam and (iii) the measured core-level peaks are expected to be the results of partially overlapping surface, bulk, metallic and oxide components.
Using this method, two model functions have been used and compared to fit the Au 4f spectra. Their difference is only related to the number of peak components included in the model function. In all cases, all components are treated by pairs associated with a branching
ratio fixed to 4:3 due to the spin-orbit splitting of the gold 4f level. Each peak component is fitted using a Voigt function: the Gaussian component is representative of the overall spectral instrumental resolution and the Lorentzian one to the natural lifetime broadening. In SOLEIL’s experiment, the width of the former is fixed in our procedure to the known experimental value of 0.6 eV while the Lorentzian width is a free fitting parameter. For the standard deposited XPS measurement, the unknown width of the monochromatized Al Kα
x-ray source led us to use free Gaussian and Lorentzian widths. In both cases, an active Shirley background for the inelastic photoelectron signal subtraction is used with a constant baseline. The different doublets included in the fit corresponds to:
(1) the non-oxide metallic bulk (Au(b)0) component;
(2) the non-oxide metallic surface (Au(s)0) component expected to be located 0.4 eV toward lower binding energies (BE) relative to Au(b)0 (see ref. 61);
(3) the oxide surface component Au(s)1+ or Au(s)3+ respectively expected below or
above 1.5 eV shifted toward higher BE relative to Au(s)0.
The latter peak identification is justified by the literature results summarized in Table 1. The two different models compared in this study are associated with the absence or the presence of gold oxide, i.e. include respectively only the components (1) and (2) or all three. Finally, the surface sensitivity of the XPS diagnostic is related to the electron inelastic mean free path (IMFP) in gold. In SOLEIL’s experiment, the photon energy was tuned to maximize the surface sensitivity leading to ~ 100 eV electron kinetic energies both for 4f core-level and for valence electrons. According to ref. 62, we are therefore probing a depth of about 0.8-1 nm (~ 3 x IMFP x 0.67 where the last constant corresponds to the topofactor described in ref. 63 in order to take into account the NP topology) below the NP surface.
Using the Kα radiation, the electron kinetic energy of about 1400 eV increases the probing depth up to about 3.3-3.6 nm.
RESULTS AND DISCUSSION
An upstream study on gold colloid preparation and characterization was made necessary by the difficulty of producing free-standing gold nanoparticle beams using ADLS. This difficulty is illustrated by the low number of experimental studies64,65 publishing measurements on Au nanoparticle beams produced by ADLS, none reporting XPS spectra. Since various experimental evidences of light material nanoparticle beam generation using such experimental apparatus are reported in the literature66-69, we attribute this difficulty, in our case, to the atomic weight of gold and nanoparticle size which substantially reduces the ADLS transmission efficiency. Indeed, beam production using ADLS is highly dependent on the mechanical design65 (material, number of apertures, diameter, vacuum pressure…) which is optimized for a specific set of sample parameters70-72 (concentration,
material density, nanoparticle size, solvent properties, carrier gas). As a result, for a given ADLS, one should explore the sample parameters space in order to maximise the transmission. For our specific set-up, the most important parameter was the sample concentration.
Thus, XPS measurements using a hemispherical analyzer on a gold nanoparticle beam were achieved only for high sample concentration. Below about 2 g/L, no detectable XPS signal coming from gold nanoparticles was recorded. As reported in the experimental section, this colloid concentration was obtained by a partial and gentle solvent evaporation of the pristine sample using a rotary evaporator. However, colloids produced by PLAL are dispersed in pure solvent, with no stabilizing agent which could prevent their possible
agglomeration. A careful analysis of the final product obtained after partial solvent evaporation was therefore mandatory in order to ensure the probing of rather individual nanoparticles during XPS measurements, instead of micrometric aggregates. These measurements have been used also in order to evaluate the sample concentration.
This sample preparation procedure was tested on one sample batch (A) and reproduced on the second one (B) dedicated to XPS measurements. The corresponding UV-Vis spectra and PPI evolution as a function of the sample concentration are reported in Figure 4. On the left, the absorbance spectra are reported for each batch. The two pristine samples have been provided by the supplier at a nominal concentration of 1 g/L. After two successive solvent evaporations, the concentration of batch A has been increased up to 5.1 g/L with an intermediate step at 2.8 g/L while batch B reached 1.85 g/L in a single step of evaporation. In all cases, the absorbance spectra exhibit a sharp peak λ = 525 nm associated with the well-known surface plasmon resonance of spherical gold nanoparticles. No evident distortion and/or peak shift is observed after solvent evaporation which is a first direct evidence of no nanoparticle agglomeration73. In addition, the primary particle index before and after each evaporation is calculated as a function of sample concentration. As mentioned earlier, a decrease of the PPI would indicate a partial nanoparticle aggregation. The stable PPI, which even tends to increase with evaporation reveals also that no sample aggregation occurred at higher concentrations. In conclusion, the 1.85 g/L sample, used for the XPS measurements, is preserved in terms of nanoparticle size.
Au 4f core-level
The Au 4f photoelectrons have been recorded using 200 eV photon energy on the free-standing nanoparticles beam (batch B at 1.85 g/L) and using 1486.7 eV radiation on the
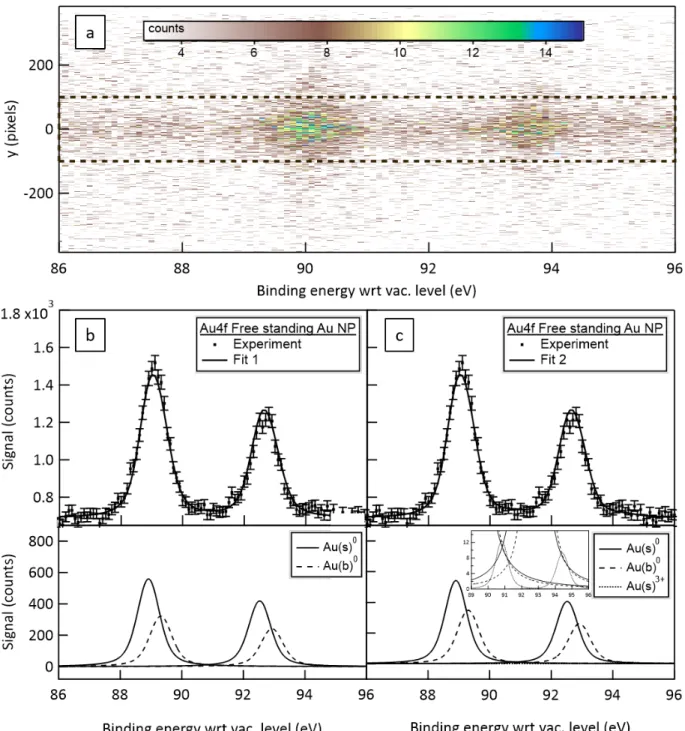
deposited sample (batch A at 1 g/L) in order to characterize the nanoparticle surface oxidation and isolate a substrate effect on the oxidation state. The “free-standing” spectra fitted with the two model functions described above are reported in Figure 6b and 6c associated with numerical results of the fits listed in Table 2.The data points are deduced from the 2D image of the XPS detection system, which holds an imaging capacity (Figure
6a). The x-axis corresponds to the electron binding energy. The y-axis is associated to a
spatial dimension: gas phase like components, not focused by the ADLS, are rather uniformly distributed on the vertical dimension while electrons coming from the focused nanoparticle beam are concentrated in the central region. For core-level, no background subtraction from the gas phase component was necessary. Therefore, the spectrum is deduced from a spatial integration over the black dashed area. The “deposited” spectra reported with respect to the Fermi level and associated fits applying the same Bayesian procedure are reported in Figure 7a and 7b. Their numerical results are compared to the free-standing conditions in Table 2.
The fit results of the free-standing nanoparticles beam’s spectrum reported in Figure 6b and 6c are nearly identical but the second one includes an additional doublet component (evidenced in the insert of Figure 6c) with an intensity close to the background level. In both cases, the fitting results of the main peaks (BE position of the Au(b)0 4f7/2 ~ 89.3 eV
with respect to vacuum level, FWHM ~ 0.42 eV, spin-orbit splitting ~ 3.61 eV) are in good agreement with what is expected for gold samples. It justifies the use of bulk and surface components for the non-oxide peak since the use of a single one leads to an overestimation74 of the natural lifetime broadening of about 0.57 eV FWHM (not reported here).
Figure 6 Au 4f spectra of the free-standing Au NPs beam from 1.85 g/L batch B probed by 200 eV photon energy beam: (a) 2D image of the XPS detection system; (b) integration over the
dashed area compared to fitting result assuming 2 doublets associated to 4f7/2 and 4f5/2 of Au(s)0
and Au(b)0 (upper panel) and corresponding fitted doublets (lower panel); (c) integration over the dashed area compared to fitting result assuming 3 doublets associated to 4f7/2 and 4f5/2 of Au(s)0,
Au(b)0, Au(s)3+ (upper panel) and corresponding fitted doublets (lower panel) - the inset corresponds to a zoom on the y-axis in order to visualize the weak Au(s)3+ component.
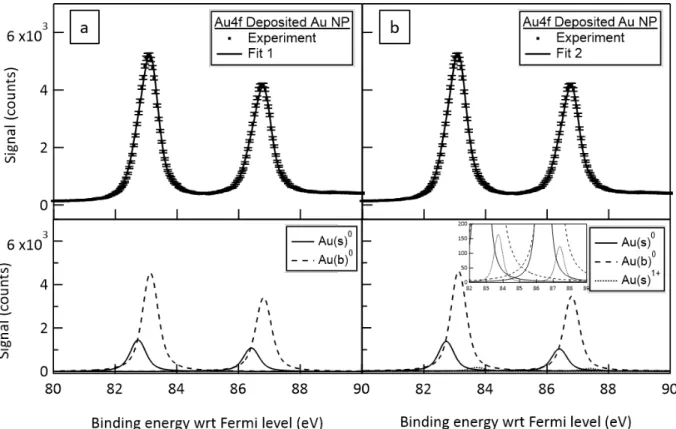
Figure 7 Au 4f spectra of deposited Au NPs from 1 g/L batch A on Si substrate probed by 1486.7 eV photon energy: (a) recorded spectrum compared to fitting result assuming 2 doublets
associated to 4f7/2 and 4f5/2 of Au(s)0 and Au(b)0 (upper panel) and corresponding fitted doublets
(lower panel); (b) recorded spectrum compared to fitting result assuming 3 doublets associated to 4f7/2 and 4f5/2 of Au(s)0, Au(b)0, Au(s)1+ (upper panel) and corresponding fitted doublets (lower
panel) - the insert corresponds to a zoom on the y-axis in order to visualize the weak Au(s)1+ component.
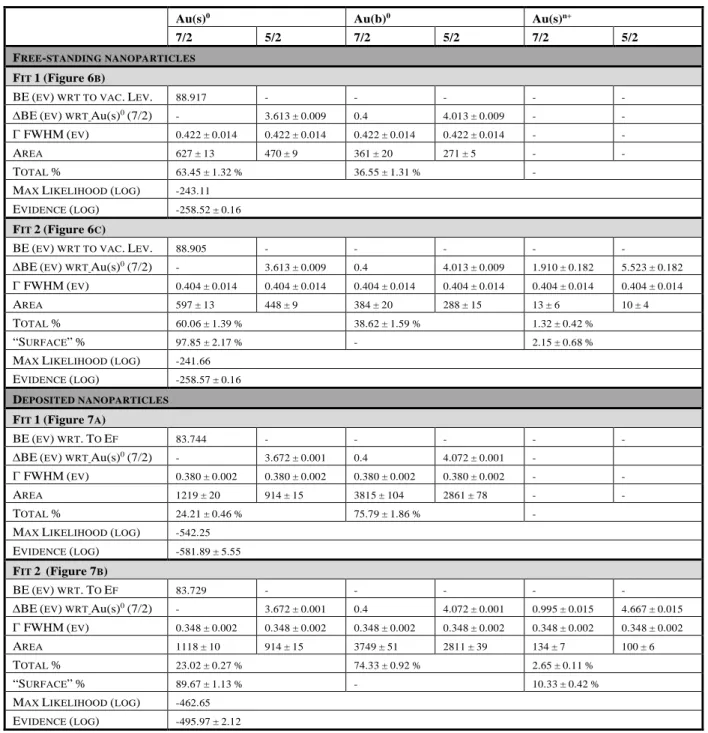
Table 2 Fitting parameters for each component using 2 or 3 doublets (Fit 1 and Fit 2) of the spectra of free-standing nanoparticles beam and the deposited nanoparticles: binding energy
position of the first component Au(s)0 (7/2); relative shift of the other components with respect to Au(s)0 (7/2) and statistical uncertainties; FWHM of the Lorentzian function; total area; percentage
Au(s)0 Au(b)0 Au(s)n+
7/2 5/2 7/2 5/2 7/2 5/2 FREE-STANDING NANOPARTICLES
FIT 1(Figure 6B) BE(EV) WRT TO VAC.LEV. 88.917 - - - - - ∆BE(EV) WRT Au(s)0(7/2) - 3.613±0.009 0.4 4.013±0.009 - - Γ FWHM(EV) 0.422±0.014 0.422±0.014 0.422±0.014 0.422±0.014 - - AREA 627±13 470±9 361±20 271±5 - - TOTAL % 63.45±1.32% 36.55±1.31% - MAX LIKELIHOOD (LOG) -243.11 EVIDENCE (LOG) -258.52±0.16 FIT 2(Figure 6C) BE(EV) WRT TO VAC.LEV. 88.905 - - - - - ∆BE(EV) WRT Au(s)0(7/2) - 3.613±0.009 0.4 4.013±0.009 1.910±0.182 5.523±0.182 Γ FWHM(EV) 0.404±0.014 0.404±0.014 0.404±0.014 0.404±0.014 0.404±0.014 0.404±0.014 AREA 597±13 448±9 384±20 288±15 13±6 10±4 TOTAL % 60.06±1.39% 38.62±1.59% 1.32±0.42% “SURFACE”% 97.85±2.17% - 2.15±0.68% MAX LIKELIHOOD (LOG) -241.66 EVIDENCE (LOG) -258.57±0.16 DEPOSITED NANOPARTICLES FIT 1(Figure 7A) BE(EV) WRT.TO EF 83.744 - - - - - ∆BE(EV) WRT Au(s)0(7/2) - 3.672±0.001 0.4 4.072±0.001 - Γ FWHM(EV) 0.380±0.002 0.380±0.002 0.380±0.002 0.380±0.002 - - AREA 1219±20 914±15 3815±104 2861±78 - - TOTAL % 24.21±0.46% 75.79±1.86% - MAX LIKELIHOOD (LOG) -542.25 EVIDENCE (LOG) -581.89±5.55 FIT 2 (Figure 7B) BE(EV) WRT.TO EF 83.729 - - - - - ∆BE(EV) WRT Au(s)0(7/2) - 3.672±0.001 0.4 4.072±0.001 0.995±0.015 4.667±0.015 Γ FWHM(EV) 0.348±0.002 0.348±0.002 0.348±0.002 0.348±0.002 0.348±0.002 0.348±0.002 AREA 1118±10 914±15 3749±51 2811±39 134±7 100±6 TOTAL % 23.02±0.27% 74.33±0.92% 2.65±0.11% “SURFACE”% 89.67±1.13% - 10.33±0.42% MAX LIKELIHOOD (LOG) -462.65 EVIDENCE (LOG) -495.97±2.12
of each doublet in the overall signal; percentage of each surface doublet in the surface signal; maximum likelihood value; final evidence.
The same observation is valid for the fit results of the deposited nanoparticles’ spectrum except for absolute binding energy position of the core-level peaks (BE position of the Au(b)0 4f
7/2 ~ 84.1 eV with respect to Fermi level, FWHM ~ 0.38 eV, spin-orbit splitting ~
3.67 eV) which are calibrated, in this case, relative to the Fermi level. Furthermore, the additional doublet associated to the oxide component is more intense than in the free-standing situation. Moreover, one can notice that the surface to bulk ratio of the Au0 doublets are very different in the two measurements. It is indeed expected since the free-standing and the deposited experiments differ also in the probing x-ray photon energy leading to a much deeper signal collection in the latter case. This important difference is at the origin of the ratio inversion.
In the free-standing case, the component associated with the possible presence of gold oxide on the nanoparticle surface represents 2.15 ±0.68 % of the surface signal (see Table 2). It stands at 1.91 eV toward higher BE with respect to Au(s)0. Hence, if present, this gold oxide
component must be associated with Au3+ (see Table 1). Given this small contribution of Au3+, its presence is highly questionable. A standard fitting analysis, based on chi-square minimization is equivalent to a likelihood maximization method included in this Nested_Fit program. A comparison of maximum likelihood values reported in Table 2 might lead to the erroneous conclusion that the model associated to Fit 2 is more probable since its maximum likelihood value is higher. However, such conclusion is intrinsically incorrect since any profile shape can be fitted with a weighted sum of voigt functions and increasing the number of components will, in most cases, increase the fitting quality, i.e. the maximum
likelihood, even if the presence of the additional component is not physically justified. In consequence, the comparison of different maximum likelihoods is meaningless.
A correct model comparison can be done with a Bayesian statistics procedure as applied in this contribution. In that case, the comparison of two input models is justified through the so-called Bayesian evidence output value (see Table 2).
This output and their difference between two models are related to the relative probability of the two models. A model comparison through the Bayesian evidence, in fact, does not consider only the maximum value of the likelihood function but its value over the entire model parameter space taking into account parameter prior knowledge. In the present case, the evidence values assigned to the two models are not distinguishable. In fact, the reported difference of 0.05 (corresponding to a p-value of 0.2591) is much smaller than the uncertainty associated with the evidence calculation (the evidence error represents the standard deviation obtained after multiple computational runs31). Hence, the gold oxide presence probed in free-standing conditions, i.e. free of substrate influence, can neither be confirmed nor excluded, the two model functions are equiprobable when prior probability of the two different hypotheses are considered the same. An unambiguous conclusion on the presence and amount of oxide on the nanoparticle surface requires additional observables and/or a higher signal to noise ratio.
On the contrary, the spectrum recorded on deposited nanoparticles leads to clear conclusions based on the important difference between the Bayesian evidences of the two models: the gold oxide presence in this case is confirmed. However, its binding energy and surface coverage are not in agreement with what has been deduced from the previous free-standing case. The relative shift of the two surface components is evaluated here around 1
eV which is compatible with an oxidation state of Au1+, instead of Au3+. Moreover, the surface oxide percentage is increased by a factor of about 5 compared to the free-standing situation. Such an important discrepancy between the two results must be associated to a substrate effect since the measurement have been performed on the same sample and an identical fitting procedure is applied.
Based on the above observations, the standard measurements on deposited nanoparticles are in rather good agreement with published results on this topic17,18,21 while the free-standing
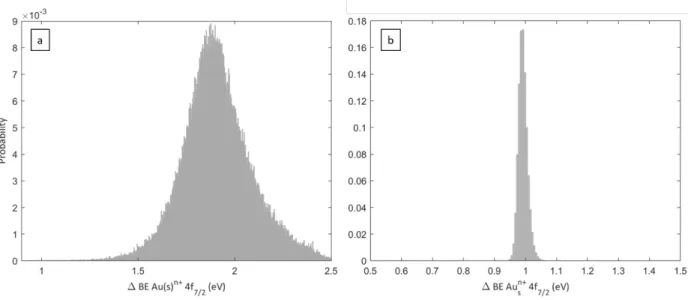
experiment leads to substantial differences. However, the Bayesian analysis applied on these data ensures the oxide identification and quantification through a complete calculation of the probability distribution of the BE position and area of this oxide peak. It is illustrated in Figure 8 which presents the results of the BE calculation corresponding to the fits of Figure 6c and Figure
7b (Fit 2). No a priori on the oxidation degree was introduced in the fitting process since the
associated BE range explored by the fitting program was chosen sufficiently broad (+0.9 to + 2.5 eV from Au(s)0 4f7/2 peak) to include Au1+ and Au3+ components. The clear bell shapes centred at
∆BE = 1.910 eV (free-standing NP) and 0.995 eV (deposited NP) with no evident component at lower or higher BE (close to Au3+ or Au1+ BE) validates the convergence quality of the fits and demonstrates that, in free-standing conditions, if present, the oxide component must be associated to Au3+, while, on the contrary, in deposited conditions to the Au1+ state. Therefore, the substrate
is accountable for the discrepancy with other publications and the measurements on deposited NP of this work.
Figure 8 Probability distribution histogram of the binding energy shift of the oxide peak Au(s)n+ 4f7/2 with respect to Au(s)0 corresponding to Fit 2 in the (a) free-standing experiment
(Figure 6c) and in the (b) deposited one (Figure 7b). Au valence band
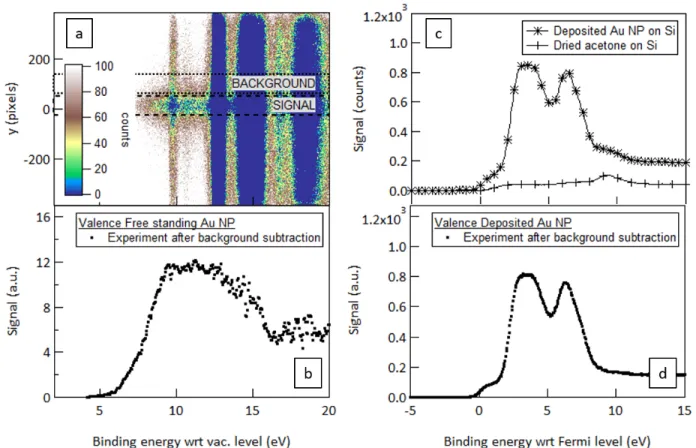
With the same aerodynamic lens apparatus and experimental procedure, the nanoparticle valence band has been also recorded in free-standing conditions using 100 eV photon energy and compared to the standard case of deposited nanoparticles using 1486.7 eV radiation. In the free-standing situation, gas-phase residual solvent signal76 (bands at 9.7,
12.6-14.8, 15.6 eV) and residual water signal (bands at 12.6, 14.7 and 18.5 eV) are overlapping with the one of interest. It is clearly visible in Figure 9a where strong homogeneous emission is detected along the y-axis while the focused nanoparticle signal is concentrated in the centre of the detector image. In this case, a background subtraction is required. Therefore, the spectrum reported in Figure 9b is deduced by subtracting the two signals obtained from an integration over the regions highlighted in dashed and dotted lines respectively.
Figure 9 Valence band spectrum of the Au NP beam from 1.85 g/L batch B probed by 100 eV photon energy beam (left) and of the deposited Au NP from 1 g/L batch A probed by 1486.7 eV photon energy radiation (right): (a) 2D image of the XPS detection system; (b)
resulting spectrum of the free-standing Au NP beam after background subtraction; (c) valence band spectrum from the deposited Au NP and from dried acetone: (d) resulting spectrum of the deposited Au NP after background subtraction.
The same overlapping arises in deposited conditions but the nanoparticles and residual solvent and water are not distinguishable by any imaging capacity and thus, must be subtracted by recording the spectrum successively of dried acetone and the colloid droplet. The corresponding spectra and subsequent subtraction are reported in Figure 9.
In gold, the valence corresponds to the 5d band while the conduction band is associated to the 6s level. For clean macroscopic gold samples, the valence profile is characterized by
two maxima assigned to the spin-orbit splitting of the 5d band while the 6s level follows a step-like Fermi-Dirac distribution. For nanoparticles larger than a few nm in diameter, the valence shape is expected similar to macroscopic gold77. However, according to the literature28,29, the surface oxidation of gold tends to modify this usual profile through a progressive smoothing of these structures, which is function of the relative amount of gold oxide atoms. In the free-standing experiment, the valence shape presents no evident sharp structure (see Figure 9b), the Fermi-edge is hardly distinguishable and the spin-orbit splitting is not present. Hence, based on these observations, the oxide presence probability is qualitatively increased compared to the probability of its absence, favouring the model function 2 in the discussion above. However, given the sensibility of the valence structure to chemical environment, such a conclusion, based on qualitative observation, cannot be irrevocable. For instance, the valence profile could be influenced by residual solvent surrounding the nanoparticles and/or the carbon shell. On the other hand, the valence spectrum of the deposited NPs (see Figure 9d) is very similar to what expected for non-oxidized macroscopic gold sample while the oxide presence probability and amount deduced from the Au 4f fitting are substantially much higher. However, this could be explained by the much deeper probing depth of this experiment which, consequently, inverts the surface to bulk ratio. The bulk signal is, therefore, in this case, the dominant one leading to non-oxidized like valence band.
SUMMARY AND CONCLUSIONS
In conclusion, this paper describes a precise experimental procedure and data analysis method applied on the controversial17,19,21,78 case of surface oxidation of gold nanoparticles produced by laser ablation. It is based on the comparison of XPS measurements on free-standing and deposited
gold nanoparticles. The nanoparticle beam is produced with an atomizer/ADLS system enabling measurements free of solvent and substrate effects. The results are compared to the standard situation of gold nanoparticles deposited on a Si substrate. Core-level and valence spectra are recorded and analyzed in order to evaluate the gold oxide presence and its proportion on the nanoparticle surface. Using Bayesian statistics data analysis of the Au 4f core-level spectra, we rigorously demonstrate that the substrate and the associated deposition process induce an important effect on the oxidation state and surface coverage (σ). The gold oxide component is attributed in deposited conditions to Au1+ (σ = 10.33 ± 0.42 %) while Au3+ (σ = 2.15 ± 0.68 %) is evidenced in the free-standing experiment. However, in the latter case, its presence cannot be confirmed if only based on the Au 4f spectrum but the structure less profile of the valence band qualitatively suggests its presence. Hence, based on these two observables and with no a priori hypothesis, one can conclude that the gold oxide presence in the proportion mentioned above is indeed plausible in this case, and that free-standing experiments are relevant on this research topic where there is no consensus yet on this question.
AUTHOR INFORMATION
Corresponding Author
*Email: levy@insp.jussieu.fr
ACKNOWLEDGMENT
We acknowledge SOLEIL for provision of synchrotron radiation facilities and we would like to thank the PLEIADES beamline and chemistry laboratory staffs for assistance. The acknowledgements also include financial supports from Academy of Finland, from the Mexican Council for Science and Technology (Grant 611509) and from Agence Nationale de la Recherche: CASTORS project ANR-13-JS04-0002 and PLAS@PAR project (Cluster of Excellence in Plasmas Physics in Paris - that received financial state aid of the programme "Investissements d'avenir" under the reference ANR-11-IDEX-0004-02). We acknowledge Santtu Heinilehto (Center of Microscopy and Nanotechnology, University of Oulu, Finland) for assistance with the XPS experiment of deposited gold nanoparticles. Raman spectroscopy was performed at the vibrational spectroscopy platform CECOMO with the assistance of Elodie Romeo. Valérie Blanchet from CELIA laboratory is especially thanked for fruitful discussions and her involvement in this project.
REFERENCES
1. Daniel, M.-C.; Astruc, D. Gold Nanoparticles: Assembly, Supramolecular Chemistry, Quantum-Size-Related Properties, and Applications toward Biology, Catalysis, and Nanotechnology. Chem. Rev. 2004, 104, 293-346.
2. Dreaden E. C.; Alkilany A. M.; Huang X.; Murphy C. J.; El-Sayed M. A. The golden age: gold nanoparticles for biomedicine. Chem. Soc. Rev. 2012, 41, 2740-2779.
3. Lopez N.; Janssens T. V. W.; Clausen B. S.; Xu Y.; Mavrikakis M.; Bligaard T.; Nørskov J. K. On the origin of the catalytic activity of gold nanoparticles for low-temperature CO oxidation. J. Catal. 2004, 223, 232-235.
4. Widmann D.; Behm R. J. Activation of Molecular Oxygen and the Nature of the Active Oxygen Species for CO Oxidation on Oxide Supported Au Catalysts. Acc. Chem. Res.
2014, 47, 740-749.
5. Haruta M.; Tsubota S.; Kobayashi T.; Kageyama H.; Genet M. J.; Delmon B. Low-temperature oxidation of CO over gold-supported on TiO2, α-Fe2O3, and Co3O4. J. Catal.
1993, 144, 175-192.
6. Turkevich J.; Stevenson P. C.; Hillier J. A. A study of the nucleation and growth processes in the synthesis of colloidal gold. Discuss. Faraday Soc. 1951, 11, 55-75.
7. Schulz F.; Homolka T.; Bastus N. G.; Puntes V.; Weller H.; Vossmeyer T. Little Adjustments Significantly Improve the Turkevich Synthesis of Gold Nanoparticles.
8. Zhao P.; Li N.; Astruc D. State of the art in gold nanoparticle synthesis. Coord. Chem. Rev.
2013, 257, 638-665.
9. Sweeney S. F.; Woehrle G. H.; Hutchison J. E. Rapid Purification and Size Separation of Gold Nanoparticles via Diafiltration J. Am. Chem. Soc. 2006, 128, 3190-3197.
10. Amendola V.; Meneghetti M. Laser ablation synthesis in solution and size manipulation of noble metal nanoparticles. Phys. Chem. Chem. Phys. 2009, 11, 3805-3821.
11. Zeng H.; Du X.-W.; Singh S. C.; Kulinich S. A.; Yang S.; He J.; Cai W. Nanomaterials via Laser Ablation/Irradiation in Liquid: A Review. Adv. Funct. Mater. 2012, 22, 1333-1353.
12. Yan Z.; Chrisey D. B. Pulsed laser ablation in liquid for micro-/nanostructure generation.
J. Photochem. Photobiol. C 2012, 13, 204-223.
13. Barcikowski S.; Compagnini G. Advanced nanoparticle generation and excitation by lasers in liquids. Phys.Chem. Chem. Phys. 2013, 15, 3022-3332.
14. Amendola V.; Meneghetti M. What controls the composition and the structure of nanomaterials generated by laser ablation in liquid solution? Phys.Chem. Chem. Phys.
2013, 15, 3027-3046.
15. Amans D.; Cai W.; Barcikowski S. Status and demand of research to bring laser generation of nanoparticles in liquids to maturity. Appl. Surf. Sci. 2019, 488, 445-454.
16. Neddersen J.; G. Chumanov; Cotton T. M. Laser Ablation of Metals: A New Method for Preparing SERS Active Colloids. Appl. Spectrosc. 1993, 47, 1959-1964.
17. Merk V.; Rehbock C.; Becker F.; Hagemann U.; Nienhaus H.; Barcikowski S. In Situ Non-DLVO Stabilization of Surfactant-Free, Plasmonic Gold Nanoparticles: Effect of Hofmeister’s Anions. Langmuir 2014, 30, 4213-4222.
18. Muto H.; Yamada K.; Miyajima K.; Mafune F. Estimation of Surface Oxide on Surfactant-Free Gold Nanoparticles Laser-Ablated in Water. J. Phys. Chem. C 2007, 111, 17221-17226.
19. Fong Y.-Y.; Gascooke J. R.; Visser B. R.; Harris H. H.; Cowie B. C. C.; Thomsen L.; Metha G. F.; Buntine M. A. Influence of Cationic Surfactants on the Formation and Surface Oxidation States of Gold Nanoparticles Produced via Laser Ablation. Langmuir 2013, 29, 12452-12462.
20. Giorgetti E.; Muniz-Miranda M.; Marsili P.; Scarpellini D.; Giammanco F. Stable gold nanoparticles obtained in pure acetone by laser ablation with different wavelengths. J.
Nanopart. Res. 2012, 14, 648.
21. Sylvestre J.-P.; Poulin S.; Kabashin A. V.; Sacher E.; Meunier M. ; Luong J. H. T. Surface Chemistry of Gold Nanoparticles Produced by Laser Ablation in Aqueous Media J. Phys.
Chem. B 2004, 108, 16864-16869.
22. Kibis L. S.; Stadnichenko A. I.; Koscheev S.; Zaikovskii V. I.; Boronin A. I. Highly Oxidized Gold Nanoparticles: In Situ Synthesis, Electronic Properties, and Reaction Probability Toward CO Oxidation. J. Phys. Chem. C 2015, 119, 2523-2529.
23. Ono L. K.; Cuenya B. R. Formation and Thermal Stability of Au2O3 on Gold Nanoparticles: Size and Support Effects. J. Phys. Chem. C 2008, 112, 4676-4686.
24. Pireaux J.J.; Liehr M.; Thiry P. A.; Delrue J. P.; Caudano R. Electron spectroscopic characterization of oxygen adsorption on gold surfaces. Surf. Sci. 1984, 141, 221-232.
25. Irissou E.; Denis M.-C.; Chaker M.; Guay D. Gold oxide thin film grown by pulsed laser deposition in an O2 atmosphere. Thin Solid Films 2005, 472, 49-57.
26. Boyen H.-G.; Kästle G.; Weigl F.; Koslowski B.; Dietrich C.; Ziemann P.; Spatz J. P.; Riethmüller S.; Hartmann C.; Möller M.; Schmid G.; Garnier M. G.; Oelhafen P. Oxidation-Resistant Gold-55 Clusters. Science 2002, 297, 1533-1536.
27. Cuenya B. R.; Baeck S.-H.; Jaramillo T. F.; McFarland E. W. Size- and Support-Dependent Electronic and Catalytic Properties of Au0/Au3+ Nanoparticles Synthesized from Block Copolymer Micelles. J. Am. Chem. Soc. 2003, 125, 12928-12934.
28. Tchaplyguine M.; Mikkelä M.-H.; Zhang C.; Andersson T.; Björneholm O. Gold Oxide Nanoparticles with Variable Gold Oxidation State. J. Phys. Chem. C 2015, 119, 8937-8943.
29. Koslowski B.; Boyen H.-G.; Wilderotter C.; Kästle G.; Ziemann P.; Wahrenberg R.; Oelhafen P. Oxidation of preferentially (111)-oriented Au films in an oxygen plasma investigated by scanning tunneling microscopy and photoelectron spectroscopy. Surf. Sci.
2001, 475, 1-10.
30. Tsai H.; Hu E.; Perng K.; Chen M.; Wu J.-C.; Chang Y.-S. Instability of gold oxide Au2O3. Surf. Sci. 2003, 537, L447-L450.
31. Trassinelli M. Bayesian data analysis tools for atomic physics. Nucl. Instrum. Methods
32. T. Wagner and J. Eglinger, thorstenwagner/ij-particlesizer:v1.0.9 Snapshot release, 2017.
33. Zhang D.; Zhang C.; Liu J.; Chen Q. ; ZhuX. ; Liang C. Carbon-Encapsulated Metal/Metal Carbide/Metal Oxide Core−Shell Nanostructures Generated by Laser Ablation of Metals in Organic Solvents ACS Appl. Nano Mater. 2019, 2, 28−39.
34. Yang S.; Cai W.; Zhang H.; Zeng H.; Lei Y. A General Strategy for Fabricating Unique Carbide Nanostructures with Excitation Wavelength-Dependent Light Emissions J. Phys.
Chem. C 2011, 115, 7279–7284.
35. Zhang H.; Liang C.; Liu J.; Tian Z.; Shao G. The formation of onion-like carbon-encapsulated cobalt carbide core/shell nanoparticles by the laser ablation of metallic cobalt in acetone Carbon 2013, 55, 108-115.
36. Kim Y.; Ma R.; Reddy D. A.; Kim T. K. Liquid-phase pulsed laser ablation synthesis of graphitized carbon-encapsulated palladium core–shell nanospheres for catalytic reduction of nitrobenzene to aniline Appl. Surf. Sci. 2015, 357, 2112–2120.
37. Marzun G.; Bönnemann H.; Lehmann C.; Spliethoff B.; Weidenthaler C.; Barcikowski S. Role of Dissolved and Molecular Oxygen on Cu and PtCu Alloy Particle Structure during Laser Ablation Synthesis in Liquids Chem. Phys. Chem. 2017, 18, 1175 – 1184.
38. Jung H. J.; Choi M.Y. One-pot synthesis of graphitic and nitrogen-doped graphitic layers on nickel nanoparticles produced by pulsed laser ablation in liquid: Solvent as the carbon and nitrogen source Appl. Surf. Sci. 2018, 457, 1050–1056.
39. Davaria S. A.; Gottfried J. L.; Liue C.; Ribeirod E. L.; Duscher G.; Mukherjee D. Graphitic coated Al nanoparticles manufactured as superior energetic materials via laser ablation synthesis in organic solvents Appl. Surf. Sci. 2019, 473, 156–163.
40. Sportelli M. C.; Clemente M.; Izzi M.; Volpe A.; Ancona A.; Picca R. A.; Palazzo G.; Cioffi N. Exceptionally stable silver nanoparticles synthesized by laser ablation in alcoholic organic solvent Colloids Surf., A 2018, 559, 148-158.
41. Wu J.-B.; Lin M. L.; Cong X.; Liua H.-N.; Tan P.-H. Raman spectroscopy of graphene-based materials and its applications in related devices Chem. Soc. Rev. 2018, 47, 1822-1873.
42. Tuinstra F.; Koenig J. L. Raman spectrum of graphite J. Chem. Phys. 1970, 53, 1126-1130.
43. Roy D.; Chhowalla M.; Wang H.; Sano N.; Alexandrou I.; Clyne T. W.; Amaratunga G. A. J. Characterisation of carbon nano-onions using Raman spectroscopy Chem. Phys. Lett.
2003, 373, 52–56.
44. Liu Y.; Hu Y.; Zhang J. Few-Layer Graphene-Encapsulated Metal Nanoparticles for Surface-Enhanced Raman Spectroscopy J. Phys. Chem. C 2014, 118, 8993−8998.
45. Kudin K. N.; Ozbas B.; Schniepp H. C.; Prud’homme R. K.; Aksay I. A.; Car R. Raman Spectra of Graphite Oxide and Functionalized Graphene Sheets Nano Lett. 2008, 1, 36-41.
46. Stankovich S.; Dikin D. A.; Piner R. D.; Kohlhaas K. A.; Kleinhammes A.; Jia Y.; Wu Y.; Nguyen S. T.; Ruoff R. S. Synthesis of graphene-based nanosheets via chemical reduction of exfoliated graphite oxide Carbon 2007, 45, 1558–1565.
47. Nathan M. I.; Smith Jr. J. E.; Tu K. N. Raman spectra of glassy carbon J. Appl. Phys. 1974, 45, 2370.
48. Chu P. K.; Li L. Characterization of amorphous and nanocrystalline carbon films Mater.
Chem. Phys. 2006, 96, 253–277.
49. Ferrari A. C.; Robertson J. Interpretation of Raman spectra of disordered and amorphous carbon, Phys. Rev. B 2000, 61, 14095-14107.
50. Girard A. ; Lermé J.; Gehan H.; Mermet A.; Bonnet C. ; Cottancin E.; Crut A.; Margueritat J. Inelastic Light Scattering by Multiple Vibrational Modes in Individual Gold Nanodimers
J. Phys. Chem. C 2019, 123, 14834−14841.
51. Wagner C. D.; Riggs W. M.; Davis L. E.; Moulder J. F.; Muilenberg G. E. Handbook of
X-Ray Photoelectron Spectroscopy Perkin-Elmer Corp., Eden Prairie, MN, 1979.
52. Rehbock C.; Merk V.; Gamrad L.; Streubel R.; Barcikowski S. Size control of laser-fabricated surfactant-free gold nanoparticles with highly diluted electrolytes and their subsequent bioconjugation. Phys.Chem. Chem. Phys. 2013, 15, 3057-3067.
53. Bärsch N.; Jakobi J.; Weiler S.; Barcikowski S. Pure colloidal metal and ceramic nanoparticles from high-power picosecond laser ablation in water and acetone.
Nanotechnology 2009, 20, 445603-445612.
54. Lindblad A.; Söderström J.; Nicolas C.; Robert E.; Miron C. A multi purpose source chamber at the PLEIADES beamline at SOLEIL for spectroscopic studies of isolated
species: Cold molecules, clusters, and nanoparticles. Rev. Sci. Instrum. 2013, 84, 113105-113116.
55. Liu P.; Ziemann P. J.; Kittelson D. B.; McMurry P. H. Generating Particle Beams of Controlled Dimensions and Divergence: I. Theory of Particle Motion in Aerodynamic Lenses and Nozzle Expansions. Aerosol Sci. Technol. 1995, 22, 293-313.
56. Liu P.; Ziemann P. J.; Kittelson D. B.; McMurry P. H. Generating Particle Beams of Controlled Dimensions and Divergence: II. Experimental Evaluation of Particle Motion in Aerodynamic Lenses and Nozzle Expansions. Aerosol Sci. Technol. 1995, 22, 314-324.
57. Barreda F.-A.; Nicolas C.; Sirven J.-B.; Ouf F.-X.; Lacour J.-L.; Robert E.; Benkoula S.; Yon J.; Miron C.; Sublemontier O. In-situ characterization of nanoparticle beams focused with an aerodynamic lens by Laser-Induced Breakdown Detection. Sci. Rep. 2015, 5, 15696-15703.
58. Kikas A.; Osborne S. J.; Ausmees A.; Svensson S.; Sairanen O.-P.; Aksela S. High-resolution study of the correlation satellites in photoelectron spectra of the rare gases. J.
Electron Spectrosc. Relat. Phenom. 1996, 77, 241-266.
59. Sivia D. S.; Skilling J. Data analysis: a Bayesian tutorial. 2nd Edition, Oxford University
Press, 2006.
60. Papagiannouli I.; Patanen M.; Blanchet V.; Bozek J. D.; De Anda Villa M.; Huttula M.; Kokkonen E.; Lamour E.; Mevel E.; Pelimanni E. ; Scalabre A.; Trassinelli M. ; Bassani D. M. ; Lévy A. ; Gaudin J. Depth Profiling of the Chemical Composition of Free-Standing
Carbon Dots Using X-ray Photoelectron Spectroscopy J. Phys. Chem. C 2018, 122 14889-14897
61. Citrin P. H.; Wertheim G. K.; Baer Y. Core-Level Binding Energy and Density of States from the Surface Atoms of Gold. Phys. Rev. Lett. 1978, 41 1425-1428.
62. Tanuma S.; Powell C. J.; Penn D. R. Calculations of electron inelastic mean free paths. IX. Data for 41 elemental solids over the 50 eV to 30 keV range. Surf. Interface Anal. 2011, 43, 689-713.
63. Shard A. G.; Wang J.; Spencer S. J. XPS Topofactors: Determining Overlayer Thickness on Particles and Fibres. Surf. Interface Anal. 2009, 41, 541−548.
64. Hickstein D. D.; Dollar F.; Ellis J. L.; Schnitzenbaumer K. J.; Keister K. E.; Petrov G. M.; Ding C.; Palm B. B.; Gaffney J. A.; Foord M. E.; Libby S. B.; Dukovic G.; Jimenez J. L.; Kapteyn H. C.; Murnane M. M.; Xiong W. Mapping Nanoscale Absorption of Femtosecond Laser Pulses Using Plasma Explosion Imaging. ACS Nano 2014, 8, 8810-8818.
65. Wang X.; Gidwani A.; Girshick S. L.; McMurry P. H. Aerodynamic Focusing of Nanoparticles: II. Numerical Simulation of Particle Motion Through Aerodynamic Lenses.
Aerosol Sci. Technol. 2005, 39, 624-636.
66. Mysak E. R.; Starr D. E.; Wilson K. R.; Bluhm H. Note: A combined aerodynamic lens/ambient pressure x-ray photoelectron spectroscopy experiment for the on-stream investigation of aerosol surfaces. Rev. Sci. Instrum. 2010, 81, 016106.
67. Sublemontier O.; Nicolas C.; Aureau D.; Patanen M.; Kintz H.; Liu X.; Gaveau M.-A.; Le Garrec J.-L.; Robert E.; Barreda F.-A.; Etcheberry A.; Reynaud C.; Mitchell J. B.; Miron C. X‑ray Photoelectron Spectroscopy of Isolated Nanoparticles. J. Phys. Chem. Lett. 2014, 5, 3399-3403.
68. Chang P.-C.; Yu Y.; Wu Z.-H.; Lin P.-C.; Chen W.-R.; Su C.-C.; Chen M.-S.; Li Y.-L.; Huang T.-P.; Lee Y.-Y.; Wang C. C. Molecular Basis of the Antioxidant Capability of Glutathione Unraveled via Aerosol VUV Photoelectron Spectroscopy. J. Phys. Chem. B
2016, 120, 10181-10191.
69. Xiong W.; Hickstein D. D.; Schnitzenbaumer K. J.; Ellis J. L.; Palm B. B.; Keister K. Ellen; Ding C.; Miaja-Avila L.; Dukovic G.; Jimenez J. L.; Murnane M. M.; Kapteyn H. C. Photoelectron Spectroscopy of CdSe Nanocrystals in the Gas Phase: A Direct Measure of the Evanescent Electron Wave Function of Quantum Dots. Nano Lett. 2013, 13, 2924-2930.
70. Zhang L.; Shao J.; Chen X.; Zhang J.; Si Q. Design and evaluation of aerodynamic lens system for focusing sub-10 nm nanoparticles. Appl. Phys. A 2016, 122, 953-958.
71. Lee K.-S.; Kim S.; Lee D. Aerodynamic focusing of 5–50 nm nanoparticles in air. J.
Aerosol Sci. 2009, 40, 1010-1018.
72. Williams L. R.; Gonzalez L. A.; Peck J.; Trimborn D.; McInnis J.; Farrar M. R.; Moore K. D.; Jayne J. T.; Robinson W. A.; Lewis D. K.; Onasch T. B.; Canagaratna M. R.; Trimborn A.; Timko M. T.; Magoon G.; Deng R.; Tang D.; de la Rosa Blanco E.; Prévôt A. S. H.; Smith K. A.; Worsnop D. R. Characterization of an aerodynamic lens for transmitting
particles greater than 1 micrometer in diameter into the Aerodyne aerosol mass spectrometer. Atmos. Meas. Tech. 2013, 6, 3271-3280.
73. Link S.; El-Sayed M. A. Spectral Properties and Relaxation Dynamics of Surface Plasmon Electronic Oscillations in Gold and Silver Nanodots and Nanorods. J. Phys. Chem. B 1999, 103, 8410-8426.
74. Zschornack G. Handbook of X-Ray Data. Springer 2007.
75. Gordon C.; Trotta R. Bayesian calibrated significance levels applied to the spectral tilt and hemispherical asymmetry Mon. Not. R. Astron. Soc. 2007, 382, 1859-1863.
76. Kimura K.; Katsumata S.; Achiba Y.; Yamazaki T.; Iwata S. Handbook of HeI Photoelectron Spectra of Fundamental Organic Molecules. Japan Scientific Societies
Press, Halsted Press, 1981.
77. Andersson T.; Zhang C.; Björneholm O.; Mikkelä M.-H.; Jänkälä K.; Anin D.; Urpelainen S.; Huttula M.; Tchaplyguine M. Electronic structure transformation in small bare Au clusters as seen by x-ray photoelectron spectroscopy. J. Phys. B: At., Mol. Opt. Phys. 2017, 50, 015102-015112.
78. Palazzo G.; Valenza G.; Dell’Aglio M.; De Giacomo A. On the stability of gold nanoparticles synthesized by laser ablation in liquids. J. Colloid Interface Sci. 2017, 489, 47-56.