HAL Id: hal-01063797
https://hal.archives-ouvertes.fr/hal-01063797
Submitted on 15 Sep 2014
HAL is a multi-disciplinary open access
archive for the deposit and dissemination of
sci-entific research documents, whether they are
pub-lished or not. The documents may come from
teaching and research institutions in France or
abroad, or from public or private research centers.
L’archive ouverte pluridisciplinaire HAL, est
destinée au dépôt et à la diffusion de documents
scientifiques de niveau recherche, publiés ou non,
émanant des établissements d’enseignement et de
recherche français ou étrangers, des laboratoires
publics ou privés.
Grading cancer from liver histology images using inter
and intra region spatial relations
Mickaël Garnier, Maya Alsheh Ali, Johanne Seguin, Nathalie Mignet, Thomas
Hurtut, Laurent Wendling
To cite this version:
Mickaël Garnier, Maya Alsheh Ali, Johanne Seguin, Nathalie Mignet, Thomas Hurtut, et al..
Grad-ing cancer from liver histology images usGrad-ing inter and intra region spatial relations. International
Conference on Image Analysis and Recognition, Oct 2014, Portugal. pp.247-254. �hal-01063797�
Grading cancer from liver histology images using inter
and intra region spatial relations
Mickaël Garnier1, Maya Alsheh Ali1, Johanne Seguin2, Nathalie Mignet2, Thomas
Hurtut3, and Laurent Wendling1
1
LIPADE, Université Paris Descartes, Paris, FRANCE [email protected]
2
UPCGI, Université Paris Descartes, Paris, FRANCE
3
École Polytechnique de Montréal, Montréal, CANADA
Abstract. Histology image analysis is widely used in cancer studies since it preserves the tissue structure. In this paper, we propose a framework to grade metastatic liver histology images based on the spatial organization inter and intra regions. After detecting the presence of metastases, we first decompose the image into regions corresponding to the tissue types (sane, cancerous, vessels and gaps). A sample of each type is further decomposed into the contained biological objects (nuclei, stroma, gaps). The spatial relations between all the pairs of regions and objects are measured using a Force Histogram Decomposition. A specimen is de-scribed using a Bag of Words model aggregating the features measured on all its randomly acquired images. The grading is made using a Naive Bayes Classifier. Experiments on a 23 mice dataset with CT26 intrasplenic tumors highlight the relevance of the spatial relations with a correct grading rate of 78.95%.
1
Introduction
Histology images are becoming more and more used in computer science. This partic-ular modality of imaging preserves the underlying tissue architecture through its prepa-ration process, making the use of histology images the gold standard in diagnosing a considerable number of diseases, especially cancers [5]. The automated quantitative analysis of histology images can help to understand the reasons behind a diagnosis, as well as to reduce the inter and intra expert variations and to bring a better understanding of the growth of a disease.
Depending on the objects of interest, histology images are acquired on specimens stained by one or several dyes that highlight their particular features and give contrast to the tissue. The best solution for histopathologists is to analyze whole slide images, however it is very costly thus limiting their introduction and diffusion in research. Al-ternative solutions are used, either relying on analyzing regions of interest [13], or using images taken randomly over all the slide [7].
Biologists, using histology images in cancer studies, are interested in analyzing both primary tumors and secondary metastases. In this paper, we propose a framework to grade cancer development in metastatic liver histology images. This work investigates the relevance of the spatial relations to recognize the advancement of cancer. The spa-tial relations are measured at two scales, between tissue types and between biological objects inside each type of tissue.
The most common framework for automatic analysis of multi-stained histology im-ages follows three steps. First a segmentation of biological objects is performed, then these objects can be quantified, usually based on first-order measures [7], and biological object-based features can be extracted [17]. These methods are usually used for detec-tion rather than grading, the latter being a more complex issue. Other methods focusing on texture analysis are applied to grade histology images for several cancers, such as lymphoma [15] and carcinoma [6].
Our description focuses on the encoding of the pairwise spatial relations which are already used in histology images analysis, usually between pairs of elements after a segmentation process. The spatial information is extracted using second order statis-tics, the most common being Ripley’s K function, the Pair Correlation Function and Besag’s L function, see [8]. They are used in various biomedical applications such as the description of tumors in breast [12] or brain [9]. These functions aims at represent-ing the distribution of distances between pairs of point objects but are not able to handle regions as we need.
Other methods of spatial relations measurement are proposed in computer vision. They can be split into quantitative and qualitative approaches. Qualitative approaches correspond to symbolic relations such as positioning [2]. Since we are interested in a measure between possibly unconnected subset of pixels, we cannot use a symbolic representation. Fuzzy quantitative approaches are commonly used in multiple applica-tion domains, such as medical imaging [1]. In this study, we use and extend the Force Histogram Decomposition (FHD) method [4] to accurately describe the spatial organi-zation of objects.
2
Materials
CT26 tumor intrasplenic implantation CT26 is an undifferentiated murine colon adeno-carcinoma cell line syngeneic to the BALB/c mice strain. CT26 tumor was very tumori-genic in vivo and often produces pulmonary and hepatic metastases in mice. To develop a reproducible model of hepatic metastasis, tumor cells have been implanted into the spleens of mice. From this site of injection, tumor cells access to the liver via the blood vessels and proliferate to form secondary tumor. Using the model described by Wai [19], Female BALB/c mice, 6 to 7 weeks old were acclimated for 1 week while sepa-rated in groups of five. All animal studies were carried out according to the Institutional Animal Care and Use Committee of Paris Descartes. Splenectomy were performed 5 min after intrasplenic injection of 5x10⁴cells in culture media.
Histological analyses At 7, 11, 13 and 17 days after implantation, liver were removed, frozen, cut and stained with the same protocol for all animals. Each slice of liver was counterstained with Hematoxylin and Eosin. From this biological material, 246 histol-ogy images were digitized (Leica DM6000B) into 90 images from healthy liver and 156 from metastatic tumor model: day 7 (5 mice) and days 11, 13, and 17 (3 mice each). The mean number of images per mouse is 10, these images were taken randomly from all over a single slide. The resolution of the images is 2592 × 1944 pixels.
Mice cancer grading The liver slices were analyzed by an expert and graded according to three criteria. First, the number of metastases, which was done with a macroscopic observation. The second criterion is the number of metastases per square millimeters and finally the area of metastases per square millimeters. The final grade of the mice is defined accordingly to these three criteria. The dataset is composed of 9 sane mice, 3 of grade 1, 7 of grade 2 and 4 of grade 3.
3
Methods
We use texture analysis and spatial relation measures in order to describe histology images. The analysis of texture is performed to detect the presence of metastases inside the tissue section while the final description only relies on the spatial relations. The different measures of every images are then aggregated to accurately describe each mouse.
3.1 Metastases detection
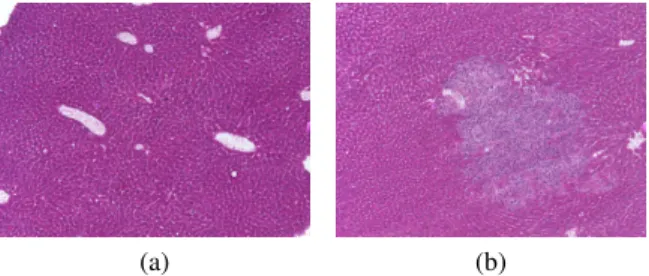
Our aim is to detect if there is metastases in each image. As shown in Figure 1, the textures of sane tissue and metastases are quite different, both stains have different hues and the shapes of the nuclei are more random in tumorous tissue. Thus, a texture analysis method is carried out to detect these variations.
(a) (b)
Fig. 1.Images showing the variations in texture between sane tissue and metastases. (a) without metastases despite being of grade 1 while (b) with metastases and of grade 3.
We use a multiresolution texture analysis method introduced in [3]. The multiresolu-tion is achieved using a wavelet filter-bank which also gives us access to high frequency information. All the information resulting from this decomposition is then described us-ing the completed model of Local Binary Patterns (cLBP). A Linear Discriminant Anal-ysis is conducted and used for classification. This detection serves as a pre-processing to induce a semantic information into the spatial relations measurement step.
3.2 Spatial relations measurement
We seek to describe the spatial organization of the tissue at two scales: between types of tissue and between biological objects inside each tissue type. All the spatial relations are here represented using FHD.
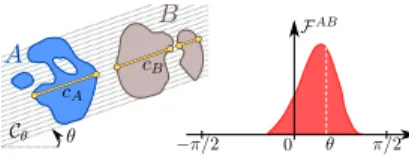
Force Histogram Decomposition The FHD is an object recognition method where the description relies on both the shapes and the spatial relations underlying the object structure. These two information are acquired using histograms of forces [11]. The histogram of forces computed between two objects A and B with a force ϕ along a direction θ is defined as:
FAB (θ) =X Cθ Z cA Z cB ϕ(||ab||) db da (1) where Cθis a set of θ−oriented lines spanning the image and, cAand cB are
respec-tively a single line from Cθcutting through the objects A and B, see Figure 2.
Fig. 2.Principle of computation of histograms of forces.
In order to access the object structure, the FHD first requires to decompose the object into several layers. Histograms of forces are then computed between every pairs of layers for the spatial relation information, and on every layer with itself to get a shape description. The FHD is defined as the set of all these histograms of forces. This method presents the advantage of being invariant to both scale and position, and can easily achieves rotation invariant using a circular dissimilarity measure. The FHD requires the definition of a force, we choose to set a constant force in all our measures, i.e. ϕ = 1. Thus our description does not take the distance between objects into consideration but allows for objects overlapping. This description is also robust to the accuracy of the decomposition method.
In this study, we are interested in reducing the amount of information contained in each histogram of forces. Thus, we use a signature based on the Fourier series. The final description retains only the S first amplitude values which are not considered as noise. This signature was introduced and its efficiency was assessed in [18]. This signature also has the advantage of ensuring that our description is rotation invariant.
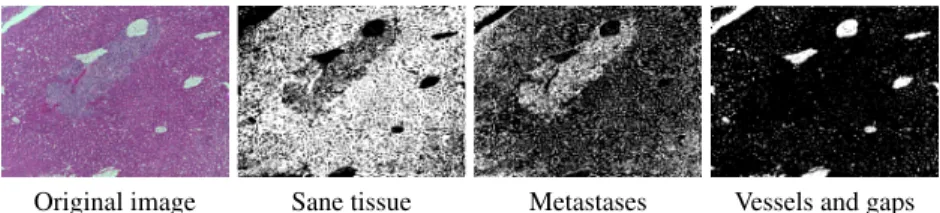
Inter regions spatial relations An adaptive multi-channel wavelet representation [10] is applied to separate the different tissue types. This method aims at separating the image into meaningful texture sets based on a wavelet packet transform using Lemarié’s wavelet. Each pixel of the image is classified into a layer according to both its high and low frequencies wavelet coefficients envelopes. The Figure 3 shows the outcome of this decomposition on a representative image of our dataset.
This method is used to separate the image into three layers: sane tissue, metastastic tissue and the remaining image content. In the case of an image without metastases, we only decompose two layers, the metastases layer being forced to a blank image. The shapes of these three regions and their spatial relations are measured using the FHD.
Original image Sane tissue Metastases Vessels and gaps Fig. 3.Representative image from our dataset decomposed into three layers.
Intra regions spatial relations We aim at describing the biological objects organiza-tion inside each type of tissue. In order to keep this measure relevant and as disjoint as possible from the shape of the region, we define a circular patch inside the most attrac-tive set of connected components of this region. This set of connected component has to be wider than the size of the patch and possess both the highest solidity and the largest area possible. If no group of connected components fits these criteria, the one with the largest area is chosen. The resulting three patches are shown in the first row of figure 4.
Fig. 4.Three patches extracted on a representative image and their decomposition into biological objects. RGB channels respectively represent the nuclei, the stroma and the remaining tissue.
Once the patches are defined, we apply a color deconvolution [14] to separate the hematoxylin from the eosin. This operation allows access to the cells’ nuclei, the stroma and the remaining objects. The outcome of the color deconvolution is rather noisy and the FHD requires binary layers, therefore, every stain channel is thresholded using the Otsu method with three classes, the background, the noise and the dye. The resulting layers for the three previous patches are displayed in the second row of Figure 4. As for the inter regions spatial relations, we apply the FHD to describe the shapes of each object and the spatial relations between them.
3.3 Mice signature and classification
Since each mouse is represented by several images, we have to aggregate their de-scriptors in the classification process. Thus we use a Bag of Words model [16] with a coding-pooling scheme. This method requires the computation of a visual codebook composed of prototype descriptors, called visual words. A mouse is then described by counting the occurrences of each visual words within its images. The visual codebook is generated using a k-means algorithm on the training data to group the descriptors. The description computed on a single image correspond to a single word.
The coding-pooling scheme consists in dividing the mapping in two steps. Each descriptor is first mapped to the closest one in the visual codebook, a binary signature, where a 1 corresponds to the closest visual word, is then obtained. The second step aggregates these signatures into a single description by adding up all the mapped visual words. This method is more complicated to implement than the simple Bag of Words but allows to keep a small signature size. The final classification is made using a Naive Bayes Classifier on the outcome of the coding pooling scheme.
4
Experimental results
4.1 Metastases detection
This step requires to set both the base parameters of the cLBP and the depth of the wavelet decomposition. We chose a LBP radius of 1 with a number of neighbors of 8 and a depth of 4. This step provides good results, see Table 1, especially in terms of false positive with using only one mouse per grade as training data. Almost all the images presenting metastases are correctly detected. We prefer to have a very good sensitiv-ity rather than a good specificsensitiv-ity so that the grading method does not miss metastases related spatial relations.
Table 1. Confusion matrix obtained on our dataset. It shows a specificity of 76.2%, a sensitivity of 98.3% and a recognition rate of 87.1%.
Output
Healthy 93 2 Metastases 29 116
Healthy Metastases Target
Specificity Sensitivity Recognition Rate 76.2% 98.3% 87.1%
4.2 Grading of cancer
In this step, we have to set several parameters. The first parameter is the number of directions of the computed histograms of forces. We chose to use 180 directions, thus giving an angular resolution of one degree. The Fourier series signature length (S) is set to several values (4, 8, 16 and 32) in order to measure the influence of this parameter.
The next parameter is the size of the patch (r), its effects are also studied by using four different values (50, 100, 200 and 400 pixels). Our last parameter is the size of the visual codebook (C), we conducted our experiments using 8, 16 and 32 different visual words in our codebook.
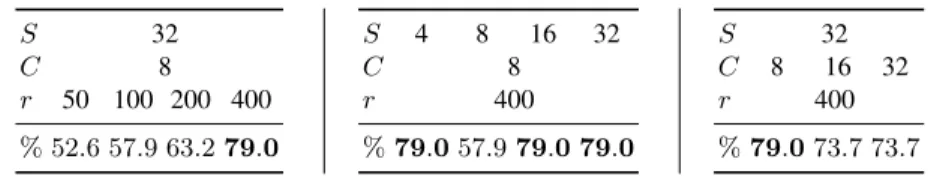
The results of our grading method, with the same training data as the metastases detection, for the different sets of parameters are summarized in Table 2. It achieves good results and is rather robust to the choice of the parameters with the exception of the patch radius. This shows that the intra-regions spatial relations hold useful information for the cancer grading but they require enough materials in order to accurately describe the tissue. The size of the visual codebook seems to have little influence on the grade recognition. However, the length of the Fourier series signature has to be chosen wisely since a length of 8 appears to bring a loss of more than 20% in recognition.
Table 2.Tables showing the cancer grade recognition rates (%) of our method according to the size of the intra-region patch (r), the length of the Fourier series signature (S) and the size of the visual codebook (C). S 32 C 8 r 50 100 200 400 % 52.6 57.9 63.2 79.0 S 4 8 16 32 C 8 r 400 % 79.0 57.9 79.0 79.0 S 32 C 8 16 32 r 400 % 79.0 73.7 73.7
5
Conclusion
In this paper, we proposed a framework to grade cancerous histology images. After a metastases detection using texture features, the method aims at describing the spatial relations between and inside the different types of tissue. We first decompose each image into several layers corresponding to the three types of tissue: sane, metastatic, and others such as blood vessels and gaps. Then, to access the biological organization inside each type of tissue, we further decompose a representative circular patch per tissue into its three types of biological objects: nuclei, stroma and gaps. The spatial organization at both scales are then described using an extended Force Histograms Decomposition.
Our work shows correct grading recognition of 79.0% despite our dataset being composed of random images taken from a single whole slide per mice. Thus, it could provides a better description in the case of whole slide images. This work does not take into consideration a description of the pairwise spatial relations between biological objects which seems to hold additional information. In the future, we aim at integrat-ing this statistical information. We are also interested in studyintegrat-ing the relevance of this method for grading other types of cancer.
Acknowledgement
References
1. I. Bloch. Fuzzy spatial relationships for image processing and interpretation : a review. Image and Vision Computing, 23(2):89–110, 2005.
2. J. Freeman. The modelling of spatial relations. Computer Graphics and Image Processing, 4(2):156–171, 1975.
3. M. Garnier, T. Hurtut, H. Ben Tahar, and F. Cheriet. Automatic multiresolution age-related macular degeneration detection from fundus images. In SPIE Medical Imaging, pages 903532–903532. International Society for Optics and Photonics, 2014.
4. M. Garnier, T. Hurtut, and L. Wendling. Object description based on spatial relations between level-sets. In Proc. DICTA, pages 1–7, 2012.
5. M. N. Gurcan, L. E. Boucheron, A. Can, A. Madabhushi, N. M. Rajpoot, and B. Yener. Histopathological image analysis : a review. IEEE Reviews in Biomedical Engineering, Vol.2:147–171, October 2009.
6. L. He, L. R. Long, S. Antani, and G. R. Thoma. Histology image analysis for carcinoma detection and grading. Computer methods and programs in biomedicine, 107(3):538–556, 2012.
7. L. O. Heldmuth. In vivo monitoring of elastic changes during cancer development and therapeutic treatment. PhD thesis, Université Paris Diderot, 2012.
8. J. Illian, P. A. Penttinen, H. Stoyan, and P. D. Stoyan. Statistical Analysis and Modelling of Spatial Point Patterns. Statistics in Practice. John Wiley & Sons, 2008.
9. Y. Jiao, H. Berman, T. R. Kiehl, and S. Torquato. Spatial organization and correlations of cell nuclei in brain tumors. PLoS One, 6(11):e27323, 2011.
10. N. Lee, A. F. Laine, and T. R. Smith. Learning non-homogenous textures and the unlearning problem with application to drusen detection in retinal images. In Proc. ISBI, pages 1215– 1218, 2008.
11. P. Matsakis and L. Wendling. A new way to represent the relative position between areal objects. Proc. PAMI, 21(7):634–643, 1999.
12. T. Mattfeldt, S. Eckel, F. Fleischer, and V. Schmidt. Statistical analysis of labelling pat-terns of mammary carcinoma cell nuclei on histological sections. Journal of Microscopy, 235(1):106–118, 2009.
13. L. T. G. Mikalsen, H. P. Dhakal, Ø. S. Bruland, J. M. Nesland, and D. R. Olsen. Quantifica-tion of angiogenesis in breast cancer by automated vessel identificaQuantifica-tion in cd34 immunohis-tochemical sections. Anticancer research, 31(12):4053–4060, 2011.
14. A. C. Ruifrok and D. A. Johnston. Quantification of histochemical staining by color decon-volution. Analytical and quantitative cytology and histology, 23(4):291–299, 2001. 15. O. Sertel, J. Kong, U. V. Catalyurek, G. Lozanski, J. H. Saltz, and M. N. Gurcan.
Histopatho-logical image analysis using model-based intermediate representations and color texture: Follicular lymphoma grading. Journal of Signal Processing Systems, 55(1-3):169–183, 2009. 16. J. Sivic and A. Zisserman. Video google: A text retrieval approach to object matching in
videos. In Proc. ICCV, pages 1470–1477. IEEE, 2003.
17. I. N. Swamidoss, A. Kårsnäs, V. Uhlmann, P. Ponnusamy, C. Kampf, M. Simonsson, C. Wählby, and R. Strand. Automated classification of immunostaining patterns in breast tissue from the human protein atlas. Journal of pathology informatics, 4(Suppl), 2013. 18. S. Tabbone, L. Wendling, and K. Tombre. Matching of graphical symbols in line-drawing
images using angular signature information. Document Analysis and Recognition, 6(2):115– 125, 2003.
19. P. Y. Wai, Z. Mi, H. Guo, S. Sarraf-Yazdi, C. Gao, J. Wei, C. E. Marroquin, B. Clary, and P. C. Kuo. Osteopontin silencing by small interfering rna suppresses in vitro and in vivo ct26 murine colon adenocarcinoma metastasis. Carcinogenesis, 26(4):741–751, 2005.