THE ROLE OF
INTERNATIONAL &
LOCAL AID
DURING THE SECOND
INTIFADA
Report VII
An Analysis of Palestinian Public Opinion
in the West Bank and the Gaza Strip
on their Living Conditions
(August 2003 - February 2004)
Polls for this study were conducted in cooperation with
the Jerusalem Media and Communication Centre(JMCC)
4
TABLE OF
CONTENTS
TABLE OF FIGURES ... 6 FOREWORD & ACKNOWLEDGMENTS ... 20 LIST OF ACRONYMS ... 22 EXECUTIVE SUMMARY ... 24OBJECTIVES & METHODOLOGY 32 Objectives ... 32
Methodology ... 34
1 MOBILITY & SECURITY CONDITIONS OF THE CIVILIAN POPULATION ... 38
1.1 Security assessment ... 39
1.2 Casualties ... 40
1.3 Damage to property and land confiscation ... 42
1.4 The impact of closures and mobility restrictions on livelihood ... 44
1.5 The Wall and mobility: local and regional impacts ... 50
2 SOCIO-ECONOMIC CONDITIONS ... 56
2.1 Main results ... 56
2.2 Business environment ... 58
2.3 Poverty: Current situation and trends ... 62
2.4 Poverty and coping strategies ... 74
3 LABOR MARKET ... 82
3.1 Main results ... 82
3.2 The evolution of the labor market ... 85
3.4 Types of occupation and employer ... 95
3.5 Employment and risk of poverty ... 97
4 ASSISTANCE DELIVERED IN GENERAL ... 102
4.1 Assistance distribution ... 103
4.2 The value of the assistance delivered ... 109
4.3 Nature of assistance delivered ... 113
4.4 Employment assistance ... 119
4.5 Sources of assistance ... 123
5 THE IMPACT OF AID & PALESTINIANS’ PERCEPTIONS ... 128
5.1 Individual needs for assistance ... 128
5.2 Palestinians’ priorities for their household ... 131
5.4 Satisfaction with assistance provided ... 141
6 FOOD ... 148
6.1 Need for food ... 149
6.2 Change in household food consumption ... 151
6.3 Change in household food consumption according to poverty ... 151
6.4 The most needed food items in the household ... 153
6.5 The most needed food items in the household, according to poverty ... 153
6.6 Source of food ... 154
6.7 Primary source of food, according to the poverty level ... 154
6.8 Primary source of food, according to refugee status ... 155
6.9 Primary source of food, according to region ... 155
6.10 Primary source of food, according to the Wall ... 156
6.11 Food assistance ... 156
6.12 Source of food assistance ... 158
6.13 Frequency of food assistance ... 161
6.14 Attitudes towards food assistance ... 163
6.15 Attitudes towards the organization of food distribution ... 164
6.16 Level of satisfaction with food assistance ... 165
6.17 Value of assistance ... 167
7 HEALTH & EDUCATION ... 170
7.1 Health and education in general ... 170
7.2 Health ... 171
7.3 Education ... 204
8 WOMEN & CHILDREN ... 212
8.1 Impact of the Intifada on women ... 212
8.2 Women and employment ... 213
8.3 Impact of the Intifada on children ... 220
8.4 Children and the Intifada ... 226
9 REFUGEES & UNRWA ... 234
9.1 Socio-economic conditions of the refugees ... 235
9.2. Socio-economic assistance and refugee status ... 243
10 POLITICS & GOVERNMENT ... 256
10.1 Trust in Palestinian political factions ... 258
10.2 Trust in Palestinian political leadership ... 265
10.3 Attitudes towards reforming the Palestinian Authority ... 269
10.4 Attitudes towards Palestinian local government ... 275
10.5 Attitudes towards the future direction of the Palestinian state ... 287
10.6 Trust in media ... 291 BIBLIOGRAPHY ...295 ANNEXES...299 Tables of Variables ...299 English Questionaire ...305 Arabic Questionaire ...321
6
TABLE OF
FIGURES
OBJECTIVES & METHODOLOGY 24
Figure 0-1: Place of residence (place) ... 27 Figure 0-2: Refugee status
(o002 & o004) ... 28 Figure 0-3: Place of residence (place) by refugeestatus (o002) ... 28 Figure 0-4: Poverty level (poverty3) ... 29
1 MOBILITY & SECURITY
CONDITIONS OF THE CIVILIAN POPULATION ... 30
Figure 1-1: Percentage of the population who feels insecure (o118) by region, July 2003 - February 2004 ... 31 Figure 1-2: Number of Palestinians killed, January 2003 - February 2004 ... 32 Figure 1-3: Causes of injuries, August 2003 - February 2004 ... 33 Figure 1-4: Number of Palestinians killed and injured according to region,
August 2003 - February 2004 ... 34 Figure 1-5: Mobility Restrictions in the West Bank ... 39 Figure 1-6: Percentage of time under curfew, according to West Bank municipality,
June 2002 - February 2004 ... 40 Figure 1-7: Impact of mobility restrictions (o032), July 2003 - January 2004 ... 40 Figure 1-8: Impact of mobility restrictions (o032) by area of residence ... 41 Figure 1-9: Physical access to place of work (o114)according to region of residence 41 Figure 1-10: Impact of mobility restrictions on economic activity:
changes in employment status (o013)and difficulties faced by businesses (o140) .... 42 Figure 1-11: Concern over the Wall (o165) by region ... 44 Figure 1-12: Feeling of security (o118) by Wall ... 45 Figure 1-13: Problems of mobility (o031, o114, o140e, o113a, o102b)
according to the Wall ... 46 Figure 1-14:Percentage of the population who report various problems created by the
Wall (o164) ... 46 Figure 1-15: Preferred area for emigration, December 2001 - February 2004 ... 47
2 SOCIO-ECONOMIC CONDITIONS ... 48
Figure 2-1: Business decline due to inability to market products to areas (o140a) according to place of residence,July 2003 - February 2004 ... 51 Figure 2-2: Business decline due to difficulties in buying raw materials or products
(o140b) according to place of residence, July 2003 - February 2004 ... 51 Figure 2-3: Business decline due to problems in reaching the workplace (o140c) according to places of residence ... 52 Figure 2-4: Business suffered due to inability to work because of curfews (o140e) according to place of residence, July 2003 - February 2004 ... 52 Figure 2-5: The Wall: difficulties in operating business
Figure2- 6: Business suffered due to damage to agriculture lands (o140f)
according to place of residence ... 54
Figure 2-7: Evolution of poverty, 2002-2004 ... 54
Figure 2-8: Poverty according to region of residence ... 55
Figure 2-9: Poverty according to place of residence, July 2003 - February 2004 ... 55
Figure 2-10: Poverty according to area of residence ... 56
Figure 2-11 : Poverty in areas crossed by the Wall ... 57
Figure 2-12: Poverty according to refugee status, July 2003 - February 2004 ... 57
Figure 2-13: Poverty according to level of education ... 58
Figure 2-14: Household income evolution (o108), July 2003 - February 2004 ... 58
Figure 2-15: Household income evolution (o108) according to place of residence, July 2003 - February 2004 ... 59
Figure 2-16: Household income in the past 6 months (o108), July 2003 - February 2004 ... 60
Figure 2-17: Household income evolution in the past 6 months (o108) according to poverty ... 60
Figure 2-18: Main cause of income decline (o109), July 2003 - February 2004 ... 60
Figure 2-19: Main cause of income decline (o109) according to poverty ... 61
Figure 2-20: Main cause of income decline (o109) according to place of residence .. 61
Figure 2-21: The average amount needed by the household to meet basic needs (o040) according to region of residence ... 62
Figure 2-22: How household income compares to what is required to supply basic needs (o041), July 2003 - February 2004 ... 63
Figure 2-23: How household income compares to what is required to supply basic needs (o041) by place of residence ... 63
Figure 2-24: Perception of household’s financial situation (o128) ... 64
Figure 2- 25: Perception of household’s financial situation (0128) according to poverty ... 65
Figure 2-26: Perception of household’s financial situation (o128) according to place of residence ... 65
Figure2- 27: Ability to cope financially (o044) according to place of residence ... 67
Figure 2-28: Ability to cope financially (o044) according to poverty ... 67
Figure 2-30: Available means of relieving the hardship (o177) according to poverty . 68 Figure 2-31: Main coping strategies for managing the hardship (o131) ... 68
Figure 2-32: Reducing expenses to cope with material deprivation (o131h) according to place of residence ... 69
Figure 2-33: Using past savings to cope with material deprivation (o131b) according to place of residence ... 69
Figure 2-34: Using past savings to cope with material deprivation (o131b) according to poverty ... 70
Figure 2-35: Buying on credit to relieve the hardship (o131j) according to place of residence ... 70
Figure 2-36: Not paying bills (water, electricity, etc.) (o131g) to relieve the hardship, according to place of residence ... 70
Figure 2-37: Cultivating land to relieve the hardship (o131d) according to place of residence ...71
Figure 2-38: Selling jewelry/gold to relieve the hardship (o131i) according to place of residence ...71
Figure 2-39: More adult going into the labor market to relieve the hardship (o131e) according to poverty ...72
8
Figure 2-40: More children going into the labor market to relieve the hardship (o131f)
according to poverty ...72
Figure 2-41: Receiving assistance from family and friends (o163e, o163f) according to poverty ... 73
3 LABOR MARKET ... 74
Figure 3-3: Tried to find a job if unemployed (o014) according to place of residence . 78 Figure 3-1 Employment conditions in the labor force (o008), 2002-2004 ... 78
Figure 3-2: Current conditions in employment status (o008), July 2003 - February 2004 (o008) ... 78
Figure 3-4: Employment conditions of the labor force (o008) according to place of residence ... 79
Figure 3-5: Employment conditions in the labor force (o008) according to refugee status, July 2003 – February 2004 ... 80
Figure 3-6: Employment conditions among the labor force (o008) according to education ... 81
Figure 3-7: Employment conditions in the labor force (o008) according to age ... 81
Figure 3-8: Duration of unemployment of main breadwinner ... 81
Figure 3-9: Duration of unemployment of main breadwinner (o100) according to place of residence ... 82
Figure 3-10: Change in employment situation over the last six months (o012) ... 82
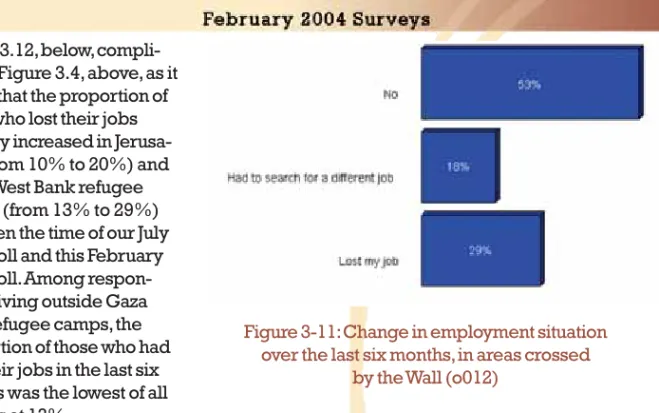
Figure 3-11: Change in employment situation over the last six months, in areas crossed by the Wall (o012) ... 83
Figure 3-12: Change in employment status over the past six months (o012) according to place of residence, July 2003 - February 2004 ... 83
Figure 3-13: Main cause of job change related to the current situation (o013) ... 84
Figure 3-14: Main cause of change in employment status (o013) according to place of residence ... 84
Figure 3-15: Ability to go to work over the last six months (O114) ... 85
Figure 3-16: Ability to go to work over the last six months (o114) in the area crossed by the Wall ... 85
Figure 3-17: Wall as obstacle to job access (o164c) according to region and area of residence ... 85
Figure 3-18: Ability to go to work over the last six months (o114) according to place of residence ... 86
Figure 3-19: Ability to cultivate land over the last six months (o0115) according to region of residence ... 86
Figure 3-20: Occupation or most recent occupation for the unemployed (o009) ... 87
Figure 3-21: Occupation or most recent occupation for the unemployed (o009) according to place of residence ... 87
Figure 3-22: Occupation or most recent occupation for the unemployed (o009) according to level of education ... 88
Figure 3-23: Type of employer (o063) ... 88
Figure 3-24: Type of employer (o063) according to area of residence ... 89
Figure 3-25: Risk of poverty according to employment status (o008) ... 89
Figure 3-26: Duration of unemployment of the main breadwinner (o100) according to poverty ... 90
Figure 3-27. Risk of poverty according to place (or most recent place) of work (o011) ... 90
Figure 3-30: Respondents reporting a salary from a long-term job in their household
(o163a) according to ... 92
Figure 3-29: Risk of poverty according to ... 92
receipt of salary (o099) ... 92
Figure 3-31: Respondents reporting a salary from a short-term job in their household (o163b) ... 93
according to poverty level ... 93
4 ASSISTANCE DELIVERED IN GENERAL ... 94
Figure 4-1: Yearly average international support for Palestine by type, average 2001-2003 ... 95
Figure 4-2: Assistance received during the past six months (o035) in general and by place of residence, 2001 - 2004 ... 96
Figure 4-2: Assistance received during the past six months (o035) in general and by place of residence, 2001 - 2004 ... 96
Figure 4-3: Percentage of the total population who received assistance during the past six months (o035) by region, 2001-2004 ... 97
Figure 4-4: Percentage of the total population who received assistance since the beginning of the second Intifada (o035b) ... 97
and during ... 97
the past six months (o035) ... 97
Figure 4-5: Percentage of the population who received assistance during the past six months (o035) by area of residence, 2001-2004 ... 98
Figure 4-6: Percentage of the total population who received assistance during the past six months (o035), by wall and by poverty, 2001-2004 ... 99
Figure 4-7: Percentage of the total population who received assistance during the past six months (o035), ... 99
by poverty level, 2001-2004 ... 99
Figure 4-8: Percentage of the total population who received assistance during the past six months (o035) by refugee status and poverty level, 2002-2004 ... 100
Figure 4-9: Percentage of refugees and non-refugees who received assistance during the past six months (o035) by place of residence ... 100
Figure 4-9: Percentage of refugees and non-refugees who received assistance during the past six months (o035) by place of residence ... 101
Figure 4-10: Median value of the assistance received ... 102
by type (o036), 2001 - 2004 ... 102
Figure 4-12: Distribution of the value of assistance (o036) and of levels of poverty . 104 Figure 4-11 Median value of assistance received ... 104
in general (o036v) by poverty, 2001-2004 ... 104
Figure 4-13: Types of assistance as reported by the interviewed (o36a, o036b) ... 106
Figure 4-14: Type of assistance received (o036), 2001-2004 ... 107
Figure 4-16: Type of assistance received (o036) according to area of residence ... 108
Figure 4-15: Type of assistance received (o036) ... 108
according to place of residence ... 108
Figure 4-17: Type of assistance received (o036) according to refugee status ...109
Figure 4-18: Type of assistance received (o036) according to poverty ...109
Figure 4-19: Employment assistance received by the household (o026) and personally (o024), 2001 - 2004 ...111
10
Figure 4-20: Employment assistance received by the household (o026) by place of
residence, November 2002 - February ... 112
Figure 4-21: Types of personal (o024) and household (o026) employment assistance, July 2003 - February 2004 ... 112
Figure 4-22: Types of employment assistance received by the household (o026) in general and by place of residence, July 2003 - February 2004 ... 113
Figure 4-23: Types of employment assistance received by the household (o026) by poverty ... 114
Figure 4.24 Types of employment assistance received by the household (o026) by education ... 114
Figure 4-25: Main sources of the assistance received (o036t), 2001 - 2004 ... 115
Figure 4-26: Source of personal employment assistance (o024s), July 2003 - February 2004 ... 116
Figure 4-27: Composition of the beneficiaries of the main sources of assistance (o036t) by poverty ... 117
Figure 4-28: Composition of the beneficiaries of the main sources of assistance .... 118
(o036t) by region ... 118
Figure 4-29: Composition of the beneficiaries of main sources of assistance (o036t) by area ... 118
Figure 4-30: Composition of the beneficiaries of main sources of assistance (o036t) by refugee status ... 119
5 THE IMPACT OF AID & PALESTINIANS’ PERCEPTIONS ... 120
Figure 5-1: Need for assistance (o38r), 2001 - 2004 ... 121
Figure 5-2: Need of assistance (o38r) according to poverty, 2001 - 2004 ... 121
Figure 5-3: Need of assistance for those who did not receive it (o38r) according to refugee status, 2001 - 2004 ... 121
Figure 5-4: Need of assistance (o38r) according to place of residence ... 122
Figure 5-5: Need of assistance for those who did not receive it (o38r) according to place of residence and level of poverty1 ... 123
Figure 5-6: Assistance priorities for the household (o079) of those who receive or need assistance, July 2003- February 2004 ... 124
Figure 5-7: Priorities for the household (o079) of those who received or are in need of assistance by level of poverty ... 125
Figure 5-8: Priorities for the household (o079) of those who received or are in need of assistance according to area of residence ... 126
Figure 5-9: Priorities for the household (o079) of those who received or are in need of assistanceaccording to region of residence ... 127
Figure 5-10: Priorities for the household (o079) of those who received or are in need of assistance according to whether the area is crossed by the Wall or not ... 127
Figure 5-11: Priorities for the community (o080), July 2003 - February 2004 ... 128
Figure 5-12: Priorities for the community (o80) according to area of residence ... 129
Figure 5-13: Priorities for the community (o080) according to region of residence .. 130
Figure 5-14: Priorities for the community (o080) according to level of poverty ... 130
Figure 5-15: Connection to infrastructure networks (o174) ... 131
Figure 5-16: Infrastructure priorities for the community (o124) ... 131
Table 5-1: Connection to the infrastructure networks (o174) by place of residence ... 132
Table 5-2: First priority for infrastructure assistance (o124) by place of residence ... 132
Table 5-3: First & second priorities for infrastructure assistance (o124) by place of
residence ... 132
Figure 5-17: Satisfaction with the assistance provided (o037), 2001 - 2004 ... 134
Figure 5-18: Satisfaction with assistance provided (o37) according to level of poverty . ... 135
Figure 5-19: Reasons for dissatisfaction with the provided assistance (o123) in general and according toplace of residence and poverty ... 135
Figure 5-20: Satisfaction with food, financial and in-kind assistance (o036)1 ... 136
Figure 5-21: Satisfaction with food assistance (o36) by level of poverty ... 136
Figure 5-22: Satisfaction with employment assistance (o101) 2002 - 2004 ... 137
Figure 5-23: Reason for dissatisfaction with employment assistance (o120) in general, according to region and refugee status, July 2003 - February 2004 ... 138
6 FOOD ... 140
Figure 61: The two most important needs of Palestinian households (o079), July 2003 -February 2004 ... 140
Figure 6-2: Most important unmet need of Palestinian households (o180), in general and by poverty, refugee status, area and place of residence ... 141
Figure 6-3: The two most important needs of the community ... 142
Figure 6-4: Food as a first priority (o079) according to poverty, education, age, and refugee status ... 142
Figure 6-5: Need for food (o180) according to region, area, place of residence, and the Wall ... 142
Figure 6-6: Change in the consumption of various food items in the household (o081), July 2003 - February 2004 ... 143
Figure 6-7: Change in consumption of dairy products and meat (o081) according to the poverty level ... 144
Figure 6-8: Change in consumption of dairy products and meat (o081) according to Wall ... 144
Figure 6-9: Most important household food need (o107) ... 145
Figure 6-10: Most important household need (o107) according to poverty level ... 145
Figure 6-11: Primary source of food in the Palestinian household (o077) ... 146
Figure 6-12: Primary source of food (o077) according to the poverty level ... 147
Figure 6-13: Primary source of food (o077)according to refugee status ... 147
Figure 6-14: Primary source of food (o077) according to region ... 147
Figure 6-15: Source of food (o077) according to the Wall ... 148
Figure 6-16: Proportion of food assistance compared to the overall assistance provided (o035, o036) ... 148
Figure 6-17: Food distribution (o036) according to area and region of residence, July 2003 - February 2004 ... 149
Figure 6-18: Food distribution (o036) according to place of residence: first and second types of assistance ... 149
Figure 6-19: Food distribution (o036) according to district ... 149
Figure 6-20: Food distribution (o036) according to poverty, July 2003 and February 2004 150 Figure 6-21: Providers of food assistance (o036) ...151
Figure 6-22: Food distribution (o036) according to source and poverty ...151
12
Figure 6-23: Food distribution (o036) according to source and refugee status ... 152
Figure 6-24: Food distribution (o036) according to source and region ... 153
Figure 6-25: Food distribution (o036) according to sourceand area of residence ... 153
Figure 6-26: Food distribution (o036) according to source and place of residence .. 153
Figure 6-27: Frequency of food distribution (o074) ... 154
Figure 6-28: Frequency of food distribution (o074) by source of food assistance .... 154
Figure 6-29: Frequency of food distribution (o074) according to region of residence ... ... 154
Figure 6-30: Frequency of food distribution (o074) according to area of residence . 155 Figure 6-31: Main benefit from food assistance (o173) ... 155
Figure 6-32: Attitudes towards the organization of food distribution (o075) according to region, area and place of residence ... 156
Figure 6-33: Attitudes towards the organization of food distribution (o075) according to poverty and source of food assistance ... 157
Figure 6-34: Level of satisfaction with food assistance ... 157
Figure 6-35: Level of satisfaction with food assistance, according to food assistance provider ... 158
Figure 6-36: Level of satisfaction with food assistance, according to refugee status and area of residence ... 158
Figure 6-37: Level of satisfaction with food assistance according to poverty level .. 158
Figure 6-38: Average value and median of food assistance according to place, region, and area of residence ... 159
Figure 6-39: Average and median value of food assistance, according to poverty and refugee status ... 160
Figure 6-40: Average value and median of food assistance, according to source of food assistance ... 160
Figure 6-41: Perceptions about the targeting of food assistance (o166) ... 161
7 HEALTH & EDUCATION ... 162
Figure 7-1: The two most important needs of the household (o079) ... 162
Figure 7-2: The most important unmet need of the household (o180) ... 162
Table 7-1: Effect of the construction of the Wall on access to basic services such as education or health (o164f) ... 163
Figure 7-3: The two most important needs of the community (o080) ... 163
Table 7-4:The main reason for choosing the health facility (o168) in general and according to region and area of residence ... 164
Figure 7-5: The main reason for choosing the health facility (o168) according to poverty level, educational level and Wall ... 164
Figure 7-6: Drugs prescribed and provided for chronic or acute problems over the past six months in general (o169a1, o169a2, o169b1, o169b2) ... 165
Figure 7-7: Drugs prescribed for acute problems over the past six months (o169a) according to area of residence, refugee status and Wall ... 165
Figure 7-8: Drugs prescribed for acute problems over the past six months (o169a) according to poverty level and age ... 165
Figure 7-9: Drugs provided for acute problems in the past six months (o169b) according to area of residence, Wall, poverty level and age ... 166
Figure 7-10: Drugs prescribed for chronic problems over the past six months (o169a) according to region of residence, poverty level and age ... 166
Figure 7-11: Drugs provided for chronic problems over the past six months (o169b) according to poverty level and age ... 167
Figure 7-12: Source of required prescription drugs (o170) in general, according to region of residence and Wall ... 167 Figure 7-13: Source of required prescription drugs (o170) according to area of
resi-dence, refugee status and place of residence ... 168 Figure 7-14: Source of required prescription drugs (o170) according to poverty level
and educational level ... 168 Figure 7-15: Type of medical care needed in the past six months (o102) ... 168 Figure 7-16: Need for mental health care services and ability to reach them (o172) in
general and according to region of residence ... 169 Figure 7-17: Need for mental health care services and ability to reach them (o172)
according to refugee status and level of poverty ... 171 Figure 7-18: Restrictions on the delivery of drugs in the past six months (o102h) in
general, according to region of residence and poverty level ... 170 Figure 7-19: Restrictions on the delivery of drugs in the past six months (o102h)
according to area of residence and Wall ... 172 Figure 7-20: Restrictions on the delivery of medical care in the past six months
(o102g) in general, according to region of residence and poverty level ... 173 Figure 7-21: Restrictions on the delivery of medical care in the past six months
(o102g) according to area of residence and Wall ... 172 Figure 7-22: Restrictions on hospitalization in the past six months (o102b) in general,
according to region of residence and poverty level ... 173 Figure 7-23: Restrictions on hospitalization in the past six months (o102b) according to area of residence and Wall ... 175 Figure 7-24: Restrictions on the provision of an ambulance in the past six months
(o102c) in general, according to region ... 175 Figure 7-25: Restrictions on the provision of an ambulance in the past six months
(o102c) according to area of residence and Wall ... 174 Figure 7-26: Restrictions on the provision of vaccinations in the past six months
(o102d) in general, according to region of residence and poverty level ... 175 Figure 7-27: Restrictions on the provision of vaccinations in the past six months
(o102d) according toarea of residence and Wall of residence
and poverty level ... 175 Figure 7-28: Restrictions on the provision of family planning in the past six months
(o102f) in general, according to region of residence and poverty level ... 176 Figure 7-29: Restrictions on the provision of family planning in the past six months
(o102f) according to area of residence and Wall ... 176 Figure 7-30: Restrictions on the provision of prenatal care in the past six months
(o102e) in general, according to region of residence and poverty level ... 177 Figure 7-31: Restrictions on the provision of prenatal care in the past six months
(o102e) according to area of residence and Wall ... 177 Figure 7-32: Restrictions on the delivery of birth care in the past six months (o102i) in
general, according to region of residence and poverty level ... 178 Figure 7-33: Restrictions on the delivery of birth care in the past six months (o102i)
according to area of residence and Wall ... 178 Figure 7-34: Restrictions on the delivery of health care for a sick child in the
past six months (o102j) in general, according to region of residence and poverty level...178 Figure 7-35: Restrictions on the delivery of health care for a sick child in the past six months (o102j) according to area of residence and Wall...178
14
Figure 7-36: Restrictions on the delivery of specialized care in the past six months (o102k) in general and according to region of residence and poverty level ... 180 Figure 7-37: Restrictions on the delivery of specialized care over the past six months
(o102k) according to area of residence and Wall ... 180 Table 7-2: Restrictions on the delivery of physical rehabilitation in the past six months
(o102l) ... 180 Figure 7-38: Restrictions on the provision of follow-up for chronic diseases in the past
six months (o102m) in general and according to region of residence and poverty level ... 180 Figure 7-39: Restrictions on the provision of follow-up for chronic diseases in the past
six months (o102m) according to area of residence and Wall ... 181 Figure 7-40: Problems related to finding an alternative health facility (o167) in general
and according to region of residence ... 182 Figure 7-41: Problems related to finding an alternative health facility (o167) according
to area of residence and Wall ... 182 Figure 7-42: Percentage of Palestinians who benefited from the following services in
the past six months (0126) ... 182 Figure 7-43: Providers of hospital services (o126as) in the past six months, in general
and according to place of residence ... 183 Figure 7-44: Level of satisfaction with medication services in the past six months
(o126b) in general and according to region and area of residence, refugee status and poverty level ... 184 Figure 7-45: Providers of medication services in the past six months (o126bs) in
general and according to place of residence ... 187 Table 7-3: Level of satisfaction with hospital services (o126a) in the past six months ...
... 185 Figure 7-46: Level of satisfaction with primary health care services (o126g) in the past
six months (o126b) in general and according to region of residence, poverty level, and the Wall ... 186 Figure 7-47: Providers of primary health care services in the past six months (o126gs)
in general and according to place of residence ... 187 Figure 7-48: Level of satisfaction with physical rehabilitation services (o126h) ... 188 Figure 7-49: Provision of physical rehabilitation services over the past six months
(o126hs) in general and according to refugee status ... 189 Figure 7-50: Level of satisfaction with specialized care services (o126i) in general,
according to region and poverty level ... 191 Figure 7-51: Providers of specialized care over the past six months (o126is) in general
and according to place of residence ... 190 Figure 7-52: Level of satisfaction with ambulance services (o126j) in general and
according to region of residence and poverty level ... 191 Figure 7-53: Providers of ambulance services over the past six months. (o126js) in
general and according to place of residence ... 192 Figure 7-54: Sources of health coverage (o089) in general and according to area of
residence (excluding Jerusalem respondents) ... 193 Figure 7-55: Sources of health coverage (o089) in general and according to region of residence and Wall (excluding Jerusalem respondents) ... 194 Table 7-4: Sources of health coverage (o089) according to household income level (excluding Jerusalem respondents) (o057v3) ... 194 Figure 7-56: Sources of health coverage (o089) according to poverty level (excluding Jerusalem) ... 195
Figure 7-57: Sources of health coverage (o089) for hardship cases ...
(excluding Jerusalem) ... 197
Figure 7-58: Level of satisfaction with school services in the past six months (o126c) in general and according to region of residence ... 196
Figure 7-59: Providers of schools in the past six months (o126cs) in general and according to place of residence ... 197
Figure 7-60: Educational attainment (o056 and educ) ... 198
Figure 7-61: Educational attainment according to gender ... 198
Figure 7-62: Educational attainment according to refugee status ... 198
Figure 7-63: Educational attainment according to region and area of residence ... 199
Table 7-5: Educational attainment according to poverty level ... 200
Table 7-6: Educational attainment and change in the employment situation (o012) 200 Figure 7-64: Educational attainment according to place of work (o011) of those who are employed and unemployed ... 201
8 WOMEN & CHILDREN ... 204
Table 8-1: Do you think of emigrating? (o094a) according to gender ... 205
Table 8-2: Ability to go to work in the past six months (o114) according to gender . 205 Figure 8-1: Number of women employed per household (o018b) in general and according to educational level ... 206
Figure 8-2: Number of employed women per household(o0018b) according to house-hold income level (o057) ... 206
Table 8-3: Number of women employed per household (o018b) according to age . 206 Figure 8-3: Poverty level according to whether or not female household members are employed (o018b) ... 207
Figure 8-4: Ability of households to cope financially (o044) according to whether or not female household members are employed (o018b) ... 207
Figure 8-5: Occupation (o009), according to gender ... 208
Figure 8-6: Type of employer (or last type) (o063), according to gender ... 208
Figure 8-7: Employment situation (o008), according to gender ... 208
Figure 8-8: Salary regularity and amount (o099), according to gender ... 209
Figure 8-9: Main place of work (or most recent place of work) (o011), according to gender ... 209
Figure 8-10: Change in employment situation in the past six months (o012), according to gender ... 209
Figure 8-11: Attempts to find a job (o014) according to gender ... 210
Table 8-4: Reasons for not searching for another job (o140), according to gender .. 210
Figure 8-12: Willingness to work (o015) according to gender ... 211
Figure 8-13: Hours per day of work at home for housewives (o159) in general, accord-ing to poverty level, and age ... 211
Figure 8-14: Number of hours spent for work not related to the house or children (work in the field, helping at shop, etc.) (o160) in general, according to poverty level (poverty3), and according to educational level (educ) ... 212
Figure 8-15: Number of hours spent for work not related to the house or children (work in the field, helping at shop, etc.) (o160), according to region of resi-dence, and area of residence...212
Figure 8-17: Number of children below the age of 18 (o065a) and below the age of 16 (o065b) employed for more than 4 hours a day, according to poverty level (poverty3)...213
16
Figure 8-16: Number of children below the age of 18 (o065a) and below the age of 16 (o065b) employed for more than 4 hours a day, in general and according to region
of residence ... 213
Figure 8-17: Number of children below the age of 18 (o065a) and below the age of 16 (o065b) employed for more than 4 hours a day, according to poverty level ... 214
Figure 8-18: Children below the age of 18 in the labor market as a coping strategy (o131f) in general and according to region of residence, poverty level, and Wall ... ... 214
Figure 8-19: Type of work of employed children below the age of 18 (o065o) ... 215
Figure 8-20: Ability to attend school or university in the past 6 months (o113a) in general and according to region of residence ... 215
Figure 8-21 Ability to attend school or university in the past 6 months (o113a), accord-ing to area of residence and Wall ... 216
Figure 8-22: Frequency in the past six months of the inability to attend school or of arriving late at school due to curfews/closures (o113b) in general and according to region of residence, and area of residence ... 217
Figure 8-23: Frequency in the past six months of children not being taught by their regular teacher because the teacher was unable to come due to curfews/closures (o113c) in general, according to region of residence, and area of residence .... 218
Table 8-5: Moved from original place of residence to another town, city or village since the beginning of the Intifada so that children can continue with their education (o161) ... 218
Figure 8-24: Impact of the second Intifada on children (o033a, b, c, d) ... 219
Figure 8-25: Aggressive behavior by children (o033a) according to region and, area of residence, refugee status, poverty level and Wall ... 219
Figure 8-26: Bad school results by children (o033b) according to region of residence and poverty level ... 220
Figure 8-27: Bedwetting by children (o033c) according to region of residence, area of residence and poverty level ... 221
Figure 8-28: Have the children (below the age of 18) in your household suffered from nightmares since the beginning of the second Intifada? (o033d) according to region of residence, area of residence and poverty level ... 221
Figure 8-29: Care and protection needs of children (o171) in general and according to region and area of residence ... 221
Figure 8-30: Care and protection needs of children (o171) according to refugee status, and Wall ... 222
Figure 8-31: Most important need of children (o105) in general and according to region and area of residence ... 222
Figure 8-32: Most important need of children (o105) according to poverty level and Wall ... 223
9 REFUGEES & UNRWA ... 226
Figure 9-1: Distribution of refugees according to area of residence ... 226
Figure 9-2 Refugee status according to place of residence ... 227
Figure 9-3: Poverty according to refugee status ... 228
Figure 9-4: Poverty according to place of residence ... 228
Figure 9-5: Evolution of employment situation (o008) according to refugee status ... 229
Figure 9-6: Perceptions of income’s conformity to needs (o041) by refugee status ... 230
Figure 9-7: Perceptions of the refugees’ living conditions (o144) ... 230
by refugee status ... 230
Figure 9-8: Perceptions of the refugees’ living conditions (o144) ... 231
by area of residence ... 231
Figure 9-9: Various impacts of mobility restrictions (o031, o114, 0140e, 0164c) by refugee status ... 232
Figure 9-10: Job losses as main cause of income decrease (o109) ... 233
by place of residence ... 233
Figure 9-11: Most important needs (o180) according ... 234
to refugee status ... 234
Figure 9-12: Most desired service in refugee camps and refugee areas (o146) ... 234
Figure 9-13: Access to infrastructure ... 235
(o174a, o174b, o174c) by area of residence ... 235
Figure 9-14: Assistance received (o035, o035b) according to refugee status, 2001-2004 ... 237
Figure 9-15: Assistance received (o035) by place of residence ... 237
Figure 9-16: Perceptions of levels of received assistance (0145) by refugee status . 238 Figure 9-17: Main source of food in refugee households (o077), July 2003-February 2004 ... 240
Figure 9-18: Received financial assistance (o036fin) by area of residence, July 2003-February 2004 ... 240
Figure 9-19: Job assistance received in the past six months, by place of residence, July 2003 - February 2004 (o023) ... 241
Figure 9-20: Source of first most important assistance received (o036c1) according o refugee status ... 241
Figure 9-21: Main sources of regular services (o126bs, o126cs, o126ds, o126es, o126fs) for refugees ... 242
Figure 9-22: UNRWA as the source of regular services (o126bs, o126cs, o126ds, o126es, o126fs, o126gs) by area of residence ... 243
Figure 9-23: Percentage of the total population who received and were satisfied with regular services (o126b, c, d, e, f, g) by refugee status ... 245
Figure 9-24: Future of UNRWA (o147) according to refugee status ... 245
10 POLITICS & GOVERNMENT ... 248
Figure 10-1: Trust in political and religious factions ... 250
Figure 10-2: Most trusted factions, according to region ... 251
Figure 10-3: Most trusted factions, according to area of residence ... 252
Figure 10-4:Most trusted faction, according to place of residence ... 253
Figure 10-5: Trust in factions, according to refugee status ... 253
Figure 10-6: Trust in factions, according to poverty level ... 254
Figure 10-7: Trust in factions, according to employment status ... 254
Figure 10-8: Factional support, according to gender ... 255
Figure 10-9: Factional trust, according toeducational attainment ... 255
Figure 10-10: Factional trust, according to the model country ... 256
Table 10-1: Most important source of information, according to trust in faction ...257
Figure 10-11: Trust in leadership...258
Figure 10-12: Trust in leadership, according to region and area of residence ...259
Figure 10-13: Palestinian trust in political and religious leaders, according to refugee status ...259
18
Figure 10-14: Trust in leadership, according to poverty ... 260 Figure 10-15: Trust in leadership, according to education, gender, and age ... 260 Figure 10-16: Attitudes towards the urgency of reform of the Palestinian Authority . 261 Figure 10-17: The issue that concerns Palestinians most with respect to the Palestinian
Authority ... 261 Table 10-2: The issue that concerns Palestinians most with respect to the Palestinian
Authority, according to education ... 262 Table 10-3: The issue that concerns Palestinians most with respect to the Palestinian
Authority, ... 262 Table 10-4: The issue that concerns Palestinians most with respect to the Palestinian
Authority according to area of residence according to region ... 262 Table 10-5: The issue that concerns Palestinians most with respect to the Palestinian
Authority,according to the poverty level ... 263 Table 10-6: The issue that concerns Palestinians most with respect to the Palestinian
Authority, according to the most trusted political or religious faction ... 263 Figure 10-18: Attitudes towards reforming the Palestinian Authority, according to
region ... 264 Figure 10-19: Attitudes towards reforming the Palestinian Authority, according to area
264
Figure 10-20: Attitudes towards reforming the Palestinian Authority, according to area of residence ... 265 Figure 10-21: Attitudes towards reforming the Palestinian Authority, according to
poverty ... 265 Figure 10-22 Attitudes towards reforming the Palestinian Authority, according to age
265
Figure 10-23: Attitudes towards reforming the Palestinian Authority, according to educational attainment ... 266 Figure 10-24a: Attitudes towards the reform of the Palestinian Authority, according to
trust in political factions ... 266 Figure 10-24b: Attitudes towards reform of the Palestinian Authority, according to the
most preferred model for Palestine ... 267 Figure 10-25: Attitudes about municipal and local councils ... 268 Figure 10-26: Knowledge about the activities of the local council, according to place of
residence ... 269 Figure 10-27: Knowledge about local council activities, according to poverty ... 269 Figure 10-28: Knowledge about local council activities, according to refugee status 270 Figure 10-29: Knowledge about local council activities, according to region ... 270 Table 10-7: Knowledge about local council activities, according to trust in political
factions ... 271 Table 10-8: The ability of residents to express their opinions regarding local council
activities, according to trust in political factions ... 271 Figure 10-30: Knowledge about local council activities, according to gender and
education ... 271 Figure 10-31: Perceptions about the performance of local councils, according to place
of residence ... 272 Figure 10-32: Perceptions about the performance of local councils, according to refugee status ... 273 Figure 10-33: Perceptions about the performance of local councils, according to region of residence ... 273 Figure 10-34: Perceptions about the performance of local councils, according to poverty ... 274
Figure 10-35: Perceptions about the performance of local councils, according to area of residence ... 274 Figure 10-36: Perceptions about the performance of local councils, according to trust
in political factions ... 274 Figure 10-37: Perceptions about the independence of local authorities, according to
area of residence ... 275 Figure 10-38: Perceptions about the independence of local authorities, according to
place of residence ... 276 Figure 10-39: Perceptions about the independence of local authorities, according to
region ... 276 Figure 10-40: Perceptions about the independence of local authorities, according to
poverty level ... 277 Figure 10-41: Perceptions about the independence of local authorities, according to
refugee status ... 277 Figure 10-42: Perceptions about the independence of local authorities, according to
level of education ... 278 Figure 10-43: Perceptions about the independence of local authorities, according to
trust in political factions ... 278 Table 10-9: Preferred country for Palestine to be modeled after ... 279 Figure 10-44: System of government for Palestine to be modeled after ... 280 Figure 10-45: Model country for Palestine to emulate, according to region and place of
residence ... 280 Figure 10-46: Model country for Palestine to emulate, according to poverty and
employment ... 281 Figure 10-47: Model country for Palestine to emulate, according to age and education
... 281 Figure 10-48: Model country for Palestine to emulate, according to most trusted leader and faction ... 282 Figure 10-49: The source of information Palestinians trust most ... 283 Table 10-10: Most important source of information according to area of residence . 284 Table 10-11: Most important source of information according to place of residence 285 Table 10-12: Most important source of information according to poverty ... 285 Table 10-13: Most important source of information according to age ... 285 Table 10-14: Most important source of information, according to trust in political
factions ... 286 Table 15: Most important source of information, according to levels of education .. 286 Figure 10-50: Attitudes towards Al-Hurra TV ... 286
20
This study is the seventh report carried out by the Palestine Research Unit (PRU)1 of the Graduate
Institute of Development Studies (IUED) of the University of Geneva since the outbreak of the second Intifada in September 2000, on the impact of local and international aid on the living conditions of the civilian population in the Occupied Palestinian Territories (OPT). The Swiss Agency for Development and Cooperation (SDC), which has supported the reports from the start, has been joined by several United Nations Agencies (UNDP, UNRWA, UNICEF, WFP, WHO, OCHA2) and by a local NGO (PANORAMA3) to co-fund
this report.
The period under scrutiny in this report covers the fall and winter 2003-2004. During the same period, a number of international organizations, NGOs, private and public local research centers, and Palestinian Authority institutions have published several important studies on topics that complement the data of our survey. At the end of the report, several references have been included in the bibliography for the reader to consult.
As usual, during the phase of preparation of the questionnaire, the team discussed the content of the new poll with different stakeholders. Due to the prevailing difficult situation in the OPT, the scope of the questionnaire has been further expanded to include a substantive number of questions that could offer more specific information to the interested parties. In this regard, it is the aim of this study to be of use to the Palestinian Authority, many UN and other international agencies, as well as local NGOs as the findings provide a wider picture of Palestinian public perceptions on their living conditions.
1 The PRU is presently composed of seven members: Prof. Riccardo Bocco, political sociologist and head of the PRU at the IUED; Mr. Matthias Brunner, political scientist, lecturer at the Department of Political Science of the University of Geneva; Dr. Isabelle Daneels, political scientist, researcher at the IUED; Dr. Jalal Al Husseini, political scientist, researcher at the IUED and associate researcher
at the Near East French Institute in Amman (IFPO, Jordan); Prof. Frédéric Lapeyre, economist, Institute of Development Studies of the Catholic University of Louvain (Belgium); Mr Luigi de Martino, program officer at the IUED; Mr. Jamil Rabah, political scientist and polls’ expert, researcher at the IUED and SDC consultant in Ramallah (Palestine).
2 See http://www.undp.org, http://www.unrwa.org, http://www.unicef.org, http:// www.wfp.org, http://www.who.org, http://ochaonline.un.org/.
3 See http://www.panoramacenter.org.
FOREWORD
&
For the survey conducted for this report, a sample of 1,499 Palestinian individuals was utilized. The areas affected by the Wall were over-sampled by 299 cases, and the remaining 1,200 were conducted in all the areas of the OPT. It is important to note that the results that will be presented hereafter are weighted so as to be representative of the whole OPT.1
The poll’s questionnaire (see Annex I for the English version and Annex II for the Arabic version) was drafted by the above-mentioned expert team and reviewed by a number of stakeholders, all of whom identified the variables pertinent to drawing an objective assessment of the needs and living conditions of the Palestinian population in the West Bank and the Gaza Strip. We are particularly grateful to Mr. Fritz Froehlich (deputy director of the SDC, Gaza and West Bank Office); Mr. Sufyian Mushasha (UNDP, Jerusalem); Mr. Lionel Brisson (Director of Operations, UNRWA Headquarters); Mr. Sam Rose (UNRWA Headquarters); Dr. Elena Mancusi (Program Officer, UNRWA, Jerusalem); Mr. Jean-Luc Siblot (Head of the World Food Program, Jerusalem); Ms. Monica Awad (UNICEF, Jerusalem); Mr. John Wetter (World Bank, Jerusalem); Mr. David Shearer (Director of OCHA office in Jerusalem); Ms. Netta Ammar (OCHA, Jerusalem); Dr. Ambrogio Manenti (Director of WHO office in Jerusalem); and Mr. Yousef Muheisen (WHO, Jerusalem).
The IUED subcontracted the Jerusalem Media and Communication Center (JMCC) for conducting the survey in late February 2004. More than 70 fieldworkers interviewed 1,499 people under the supervision of Ms. Manal Warrad.
The teamwork was conducted between Jerusalem, Ramallah, Brussels and Geneva. We are particularly grateful to the JMCC Palestinian fieldworkers: without their dedication under difficult circumstances, this study could not have materialized. In Ramallah, Ms. Charmaine Seitz did a great job on the edition and the layout of the present report. In Geneva, special thanks are due to the students of the Political Science Department and of the Graduate Institute of Development Studies both at the University of Geneva that helped us a lot on data cleaning, standardization and checking: Mr. Jérôme Begey, Mr. Jean-Marc Binois, Ms. Nadia Boulifa, Ms. Céline Calvé, Ms. Julie Conti, Ms. Emilie Converset, Ms. Tania Gaulis, Ms. Claudia Hametner, Mr. Fabien Messeiller, Mr. Sabi Mihalyi, Mr. Jean-David Moynat, Mr. Lionel Ricou and Ms. Jessica Saulle. We are also very grateful to Mr. Markus Peter of DataDoxa and Mr. Antoine Mach, head of Covalence.ch for their valuable assistance on the whole process of data handling and checking. Last but not least, we wish to thank our program officer at the PRU, Mr. Luigi de Martino for his role in information and coordi-nation and Mr. Rico Glaus of the IUED for administration and accounting.
The data for this report were collected by the JMCC, but the data cleaning, weighting and interpretation of the results are the sole responsibility of the authors of this report. Geneva, September 2004
1 In fact, our file is always weighted except when the data are split between areas affected and areas not affected by the Wall.
22
ARIJ Applied Research Institute in Jerusalem
EGP Employment Generation
Programs
GS The Gaza Strip
GSRC Gaza Strip refugee camps
HDIP Health Development
Information Project IDF Israeli Defense Forces IUED (French acronym for) Graduate Institute of
Development Studies, University of Geneva JMCC Jerusalem Media and Communications Centre
MIFTAH Palestinian Initiative for Global Dialogue and Democracy MOPIC Ministry of Planning and International Cooperation, PNA
NIS New Israeli Shekel
OAPT Occupied and Autonomous Palestinian Territories
OCHA UN Office for the Coordination for the Humanitarian Affairs OPT Occupied Palestinian Territories
PCBS Palestinian Central Bureau of Statistics
PECDAR Palestinian Economic Council for Development and Reconstruction
PA Palestinian Authority
PNA Palestinian National Authority PRCS Palestine Red Crescent Society
SDC Swiss Agency for Development and Cooperation
UNESCO United Nations Education, Science, and Culture Organization UNICEF United Nations Children and Education Fund
UNRWA United Nations Relief and Works Agency for the Palestine Refugees in the Near East
UNSCO United Nations Special Coordinator’s Office in Palestine UNWFP United Nations World Food Program
WB The West Bank
WBRC West Bank refugee camps
LIST OF
24
MOBILITY & SECURITY
CONDITIONS OF THE CIVILIAN POPULATION
The escalation of clashes in the OPT after August 2003 resulted in an increase in the number of casualties and restrictions on mobility as compared to the situation in July 2003.
Both the number of persons killed and injured has risen since July 2003. Overall, however, the period under scrutiny (August 2003 to February 2004) saw fewer casualties than previous periods covered by earlier surveys. Confirming the now well-established militarized characteristic of the Intifada, most victims were hit by shrapnel and live ammunition.
While Palestinians generally report that their mobility has improved, especially access to their places of work or education, restrictions of mobility continue to be named as the prime cause for business or employment-related problems. During the period under scrutiny, Israel has eased its closure policy, but roadblocks remain physically intact and curfews have been re-imposed locally whenever military incursions are underway.
The Wall is leading to the emergence of a new underprivileged segment of the OPT community, one which is comparatively more affected by problems of mobility and socioeconomic difficulties than the rest of the population.
Contrary to fears expressed in the OPT and neighboring Arab countries, the construction of the Wall has not yet triggered a new wave of Palestinian emigration abroad.
SOCIO-ECONOMIC CONDITIONS
This study’s results show a severe deterioration of the business environment in the Gaza Strip since July 2003. In the West Bank, the situation has slightly improved -especially inside refugee camps - but the Wall is a growing problem for businesses in the West Bank and East Jerusalem.
Poverty in the OPT remains widespread, with 57% of the population being poor and 23% of the population being extremely poor. The overall poverty and extreme poverty rates remained almost the same, as compared to the rates in July 2003. The poverty rate among respondents living in areas crossed by the Wall (a rate of 65%) was significantly higher than the average poverty rate in the Occupied Territories (a rate of 57%).
EXECUTIVE
SUMMARY
One striking finding is the sharp deterioration of the material situation of residents of Gaza Strip refugee camps where the percentage of extremely poor increased from 36% to 47% between July 2003 and February 2004. This means that that rate of extreme poverty in Gaza Strip refugee camps is now more than twice that of the average rate in the Occupied Territories as a whole.
Less than half of respondents reported that they still have means of relieving their hardship. One-fourth of respondents reported that their means will be exhausted soon.
Among survey respondents, 41% reported that their business had suffered due to inability to market their products. In villages, this problem is most severe, with 51% of village residents emphasizing it over other difficulties. Forty percent of city residents cited the inability to market products, while only 27% of refugee camps cited this hardship.
Overall, there are signs that the socio-economic situation in the West Bank has improved. The rate of respondents reporting an inability to market products decreased from 54% to 49% since July 2003. In the Gaza Strip, on the other hand, there has been a deterioration: 21% in July 2003 reported an inability to market products, as com-pared with 37% today. In East Jerusalem, the situation has not changed.
The Wall has created obstacles for marketing agricultural products, especially for respondents from the West Bank who live outside refugee camps. Thirty-nine percent said that the Wall was a problem in marketing produce.
In general, there is no sign of social fragmentation based on a process of income differentiation. Overall, 69% of respondents have the feeling that the financial situation of their household is about the same as the people in their community whereas only 16% think it is worse.
LABOR MARKET
The overall unemployment rate decreased from 25% to 23% between July 2003 and February 2004 but still less than half of all workers have access to full-time employment.
The OPT labor market is characterized by widespread underemployment which is affecting more than a quarter of the labor force.
The results show a severe deterioration of the labor market in East Jerusalem where the unemployment rate reached 33%, as compared to 15% in July 2003. Meanwhile, the rate of full-time employment in East Jerusalem dropped from 51% to 39%.
In the Gaza Strip, unemployment decreased from 27% to 24% inside refugee camps and from 20% to 16% outside refugee camps, while the proportion of respon-dents who reported working part-time or few hours a day increased
respec-tively from 27% to 30% and from 29% to 34%.
The results show a significant increase in job precariousness and
underemployment among non-refugees. Overall, the employment situation of non-refugees is now more precarious than that of refugees, having worsened between July 2003 (our last survey) and February 2004.
EXECUTIVE SUMMARY
26
The unemployment rate is four times higher for the group of respondents with a low level of education than for those with a high level of education (44% compared to 11%). Moreover, young workers and workers above the age of 50 are particularly vulnerable to unemployment.
Problems of access to the workplace were much more severe for workers living in areas crossed by the Wall. Indeed, 15% of respondents from these areas reported that it was “almost impossible” to go to work, while another 25% reported that it was “very difficult” to go to work. These numbers are a stark comparison with the 5% of workers in the OPT as a whole who reported it “almost impossible” and the 11% who reported it “very difficult” to go to work.
Non-governmental organizations (NGOs), and especially local NGOs, are in-creasingly playing a role as employers. The proportion of respondents stating that they work for a local NGO increased from 1% to 5% between July 2003 and February 2004, while those stating that they work for an international NGO increased from 2% to 4%.
ASSISTANCE DELIVERED IN GENERAL
In the Gaza Strip, around 5% of the population did not receive assistance during the past six months, while they had received assistance earlier in the Second Intifada.
The general level of assistance delivery has decreased significantly since the first half of 2003.
This decrease was more marked in the West Bank than in the Gaza Strip, in villages than in cities and refugee camps. The decrease may be partly explained by delays in the handover of ICRC’s beneficiaries in rural areas to the WFP.
Areas that were affected by the Wall benefit much less from assistance than the rest of the OPT. It appears that the poor that live in such areas don’t receive enough assistance.
Although the general level of assistance has declined, targeting of the poor seems to have improved: the decline is more severe for those above the poverty line than for those that live below it, especially hardship cases.
Consistently since the beginning of the second Intifada, refugees received more assistance than non-refugees. Our results hint at a comparative deficit in assistance to non-refugees.
Since the beginning of the second Intifada in September 2000, there was a clear increase in the overall value of the assistance delivered, which then remained stable throughout the second half of 2003 and the first months of 2004. While the median value of food assistance has evolved in a similar manner, one should note the impor-tant increase in the value of employment assistance since the last poll in July 2003.
Between September 2003 and February 2004, the overall value of assistance delivered was higher in the West Bank than in the Gaza Strip. It was also higher outside refugee camps than inside refugee camps.
The level of financial assistance has declined less since last summer: only 3% fewer respondents received it in February 2004. Here, the sharpest decline is ob-served in refugee camps where it decreased from 25% in July 2003 to 11% this year. In villages, there was a decrease of 4% from 10% while in cities, financial assistance increased slightly from 9% to 11%.
Approximately one-sixth of households received financial assistance but only 9% of the respondents cited this kind of assistance among the two most important types of assistance they received.
There was a clear decrease in delivery of all assistance types except employment and coupons. The largest absolute decline was in food: its delivery receded especially in villages, to a lesser extent in cities, while increasing in camps. Financial assistance declined much less and essentially in refugee camps.
Huge geographical differences in the level of assistance delivery for the different places, areas and regions of residence emerge. Food was delivered to two-thirds of camp residents in the Gaza Strip but only to one-quarter of households living outside camps in the West Bank. In general, food is more targeted at the refugee camps and the Gaza Strip where the living conditions are worse. Financial assistance is also primarily targeted at Gaza but not particularly at refugee camps. Villages get less assistance of all types.
THE IMPACT OF AID & PALESTINIANS’ PERCEPTIONS
Twenty-seven percent of Palestinians reported that they needed assistance but did not receive it. This proportion has increased by 7% since July 2003, going back to levels registered in 2001 and breaking the improving trend in the focusing of aid towards those who need it most.
The most spectacular evolution concerns people below the poverty line, among which those needing assistance have more than doubled from July 2003 to February 2004.
There are an increased number of people needing aid without receiving among both refugees and non-refugees.
The need for assistance is higher outside than inside refugee camps
Employment is first assistance priority for 47% of Palestinians (an increase of 18% since July 2003).
Seventy percent of hardship cases place employment among their two most important needs. More than six out of ten Palestinians cite employment as the most important need for the community.
In villages, fewer people cite employment as a priority, but many more cite food and education.
More people need food and money in areas crossed by the Wall than elsewhere.
28
Highest priorities are water in the West Bank, and electricity in Jerusalem.
FOOD
The proportion of the overall food assistance delivered to respondents living above the poverty line declined from 25% in July 2003 to 15% in February 2004. Conversely, the proportion of food assistance reaching hardship cases increased from 34% in July 2003 to 42% by February 2004.
There is a sharp decline of 9% in the proportion of Palestinians who said that they received assistance in recent months. More specifically, whereas 48% of the respon-dents said that they received some type of assistance in July 2003, the percentage dropped to 39% in February 2004.
There has been a decline in the number of Palestinians who rely on food assis-tance as their primary source of food, and a parallel decrease in the number of households who rely on the extended family for food.
There has been a relative improvement in the dietary intake of food.
The food situation in areas that are directly affected by the Wall is deteriorating and might need extra targeting in the future.
Food is the second most important priority for the household. The fact that only 10% of respondents said that food is the most important unmet need indicates the successful effort conducted by food assistance providers in distributing food assis-tance to the needy.
HEALTH & EDUCATION
Health, but especially education, have lost importance as needs both for the household and for the community since the September 2003 report. Compared to other types of unmet needs of the household, health and education are not high on the priority list, which might suggest that those needs are already quite well covered.
The main three factors influencing Palestinians’ choice of a health facility are (1) the health facility being free or cheaper (42%), (2) the distance or availability of a health facility (23%), and (3) trust in the quality of services (18%). The results showed that the highest percentages of Palestinians choosing their health facility based on the first reason can be found in the West Bank, in refugee camps and villages, among the poorer segments of society, among the low educated, and among Palestinians residing in areas that are directly affected by the Wall.
Concerning the need for drugs for acute and chronic diseases in the past six months, 19% of the total sample was prescribed drugs for acute diseases and 29% were prescribed drugs for chronic diseases. The results point to a gap of a few percent between the prescription of drugs for both acute and chronic diseases and the actual provision of the drugs for these problems. The prescription of drugs for acute diseases was the highest in villages, among non-refugees, among residents directly affected by the Wall, among
the poorest in Palestinian society, and among respondents who are 50 years or older. The discrepancy between prescription and provision of drugs for acute problems never exceeds the 5% mark, except in areas that are crossed by the Wall.
The private pharmacy is the main source of medication, followed by the Ministry of Health clinic, the UNRWA clinic, and much less frequently, the NGO clinic. The UNRWA clinic is the main source of medication in the Gaza Strip, among refugees, and in both West Bank and Gaza Strip camps. The reliance on a private pharmacy for medication is highest in Jerusalem, in villages, among non-refugees, among the economically better-off in society, and among the high educated.
The need for any type of care, with the exception of birth care, was consistently highest in the Gaza Strip, in refugee camps, among the poorer segments of society, and among residents in areas that are directly affected by the Wall. Birth care and specialized care were most needed in villages, while health care for a sick child was most needed in cities. Furthermore, concerning restrictions, delays and denials for the provision of any of the 12 analyzed types of medical care, generally difficulties occurred most often in the West Bank, in villages (often least frequently in refugee camps), among the poorer segments of society, and among residents in areas that are crossed by the Wall.
Thirty-nine percent of the total sample of interviewees reported that they had been forced to find an alternative health facility, with these numbers being higher in the West Bank, in villages, among non-refugees, and among residents in areas that are crossed by the Wall. The most frequently reported problems resulting from having to find an alternative health facility were additional costs, delay in the needed care, and more suffering.
Considering the level of satisfaction among beneficiaries of six different types of health services, 71% were satisfied with hospital services, 68% were satisfied with medication, and 78% were satisfied with primary health care. Furthermore, 51% of the beneficiaries of physical rehabilitation services were satisfied, while 61% were
satisfied with specialized care and 72% were satisfied with ambulance services. Results indicate that the PA and - to a lesser extent - UNRWA, are the main providers of health care, except for physical rehabilitation services where UNRWA’s place is taken in by local NGOs.
Governmental health coverage and, to a lesser extent, UNRWA remain the main heath insurance providers. Although, in general, the percentage of Palestinians covering their medical expenses from their own pocket has dropped by 5% (26%) since the September 2003 report, alarmingly, the percentage of households below the poverty line that cover their own medical bills has increased by 8% (54%) since last September.
A large majority (87%) of respondents are satisfied with their school services. The PA and UNRWA are the main providers of such services, with the PA focusing its attention mostly on the non-refugee population outside camps and UNRWA mainly targeting the refugee population whether inside or outside camps. Further-more, the largest portion of Palestinians with high educational levels can be found among refugees, in refugee camps and in the Gaza Strip. The low- and medium-educated tend to rely more on the Israeli labor market, while
30
high educated rely more on the Palestinian labor market. Moreover, the low- and medium-educated are far less able to maintain their employment than the high-educated.
WOMEN & CHILDREN
In comparison with results in previous reports (September 2003, December 2002), a lower percentage of Palestinian households have at least one woman em-ployed (26%). In fact, the percentage dropped to the level it stood at in the December 2001 report. Interestingly, the percentage of households with at least one woman employed swells with an increased level of education and is also highest in the house-holds that fall in the age category of 24 to 35 years.
When women in the household are employed, it has a clear positive effect on the household’s financial status, as these households tend to have a higher monthly income level and can more often position their financial status above the poverty line. Furthermore, those households seem to be in a better position to cope financially in the future.
Women in the labor market less frequently lost their jobs than their male counter-parts. However, those women who did loose their employment tried less hard than men to find alternative employment. Furthermore, although less women than men are employed full-time in the labor force, women more than men seem to be able to bring home a regular and full salary. Lastly, men more than women are willing to compro-mise on their wages as long as they can keep a job and avoid total unemployment.
In general, housewives spend an average of seven hours a day on work at home. Housewives who also spend time on work not related to the house or children, on average do so for about three hours and 20 minutes a day.
In comparison with results in previous reports (September 2003, December 2002), a lower percentage of Palestinian households have at least one child below the age of 18 employed (11%). The decision to have children work is influenced by the financial situation of the household.
Albeit that about 30% of the household members of respondents continue to face difficulties in getting to their place of education, there appears to be a considerable improvement in the ability of Palestinians to attend school or university since Septem-ber 2003.
Since the beginning of the Intifada, 36% of parents reported aggressive behavior among their children, 31% noticed bad school results, 25% mentioned that their children are bedwetting, and 28% reported that their children have nightmares. Although the results are striking, they represent an improvement on the answers to the same question in the September 2003 report. All four types of behavioral problems are
most explicit in the Gaza Strip, in refugee camps and among the poorer segments of society.
A majority of 53% of parents admit to being unable to fully meet the needs of their children for care and protection. Again, this phenomenon is most pronounced in the Gaza Strip, in refugee camps, among the poorer elements of society and among refugees.