HAL Id: hal-02372104
https://hal.archives-ouvertes.fr/hal-02372104
Submitted on 20 Nov 2019
HAL is a multi-disciplinary open access
archive for the deposit and dissemination of sci-entific research documents, whether they are pub-lished or not. The documents may come from teaching and research institutions in France or abroad, or from public or private research centers.
L’archive ouverte pluridisciplinaire HAL, est destinée au dépôt et à la diffusion de documents scientifiques de niveau recherche, publiés ou non, émanant des établissements d’enseignement et de recherche français ou étrangers, des laboratoires publics ou privés.
Jean-Claude Pineau
To cite this version:
Jean-Claude Pineau. Prediction of male basketball players’ adult stature from the age of 13 years using chronological age and maturity. Journal of Sports Medicine and Physical Fitness, Edizione Minerva Medica, 2019, 59, pp.613 - 621. �10.23736/S0022-4707.18.08784-4�. �hal-02372104�
1
Prediction of male basketball players’ adult stature from the age of 13 years using chronological age and maturity.
Short title : Prediction of adult stature PINEAU Jean-Claude
Anthropologie Moléculaire et Imagerie de Synthèse , CNRS - UMR 5288 AMIS, Montrouge,
France.
2
Abstract
Background: The purpose of this study was to cross-validate and demonstrate how adult stature can
be predicted in 13-year-old basket-ball players by using a new reference specific growth curve obtained from chronological age, and maturity of sedentary boys.
Methods: The prediction of adult stature of young male basketball players was established from the
results of a longitudinal study in which we developed from 125 sedentary boys aged from 12 to 17.5 years new growth curves using chronological and biological maturation.
In partnership with the French basketball federation, we collected information on stature, age and secondary pubertal stages from a sample of 106 boys aged from 160 and 164 months.The participants were regional level basketball players whose adult statures were known.
The association of biological maturation at a chronological age was the determining criterion to predict individual adult stature with advanced, standard and delayed puberty.
Results: The average longitudinal growth curves enabled the prediction of adult stature within ± 3cm,
98 % of the time in male basketball players. The relationship between estimated adult stature and final stature was high (r=0.98) with a low standard error estimate (SEE= 1.65 cm). Mean and standard deviation of the differences between estimated stature and adult stature were 0.7 ± 1.7.
Conclusion: This technique is a valid, nonintrusive and accurate method of predicting adult stature in
adolescent basketball players. It constitutes an advance in the detection and the orientation of future basketball players.
3
Introduction
Stature is considered a factor which can limit or favor performance at a high level in team sports and particularly in basketball. Thus, the ranking of finalist teams in the Olympic Games is closely correlated to the stature of the players. The consistent lack of very tall centers (stature> 205 cm) in national teams is a major concern of the French National Technical Direction.
The average growth curves established by Sempé using various anthropometric variables were only represented in relation to the chronological age. In view of this, the prediction of a variable at a given age is imprecise because the kinetics do not consider biological maturity.
At an international level, longitudinal studies are concerned more often with stature and weight [1-5] Others established percentile curves of stature and weight according to chronological age and growth peak [6-8] while some analyzed the concept of canalisation in individual growth [9,10].
The most popular predictive equations to determine adult stature are the Bayley and Pinneau method [11], the Roche-Wainer-Thissen method [12] and the Tanner-Whitehouse method [13]. These methods all include assessment of bone age to determine biological maturity. However, these methods are costly and require exposure to radiation. Recently, other predictive methods without radiation have been developed using chronological age and anthropometric measurements: stature, sitting stature, and weight. The timing of leg length velocity and sitting stature velocity is used to predict years from peak height velocity which is an indicator of biological maturity [14,15].
More recently, The Beunen-Malina Freitas method was validated for the prediction of adult stature in girls aged 12-15 years. This method which does not require radiation unlike skeletal and dental maturity measurements, is best used in European populations [16]. All insist on the fact that a longitudinal and not a transverse study, is necessary to better describe adolescent growth and that biological maturation is an essential factor.
The prediction of adult stature of young basketball players is an essential step in the recruitment of future tall players. For this reason, the main objective of this study is to accurately predict the adult stature of basket-ball players from the age of 13 and a half using a non-invasive method.
4
Methods
The prediction of adult stature of young male basketball players was established from the results of a longitudinal study within the framework of a National Research Agency program. In this program, we developed new growth curves using age and maturation from longitudinal data collected from 125 sedentary boys aged from 12 to 17.5 years. The essential longitudinal study to build these growth curves took place over a period 5 consecutive years. In order to ensure the sustainability of the study, data collection was carried out during the school years on sedentary boys. Longitudinal data were collected twice every school year. So this reference sample consists of 1234 measures collected for a period of five years. The parents of the boys of our sample arise from various social and occupational environment: workers and employees; skilled workers; and middle managers. Furthermore, only 2 % are immigrants coming from North Africa. So, our sample can be considered as being very homogeneous with a large majority of Caucasian boys. Respecting the inclusion criteria of individuals in good health and in age group led to the undertaking of this study in the Soissons area. All participants and parents gave their oral and written informed consent to participle in this study. The permission of the advising doctors and the regional education authority of Aisne we also procured, all in accordance with the Helsinki Declaration.
The maturity stage was based on the age of peak height velocity (APHV) which was the determining criterion to develop the new standards based on three groups each made up of individuals with advanced, standard and delayed puberty. APHV requires serial longitudinal data spanning late childhood through adolescence [17]. APHV was graphically determined for every subject from the longitudinal data. Peak age velocity (PHV) is a somatic biological maturity indicator and reflects the maximum velocity in statural growth during adolescence.
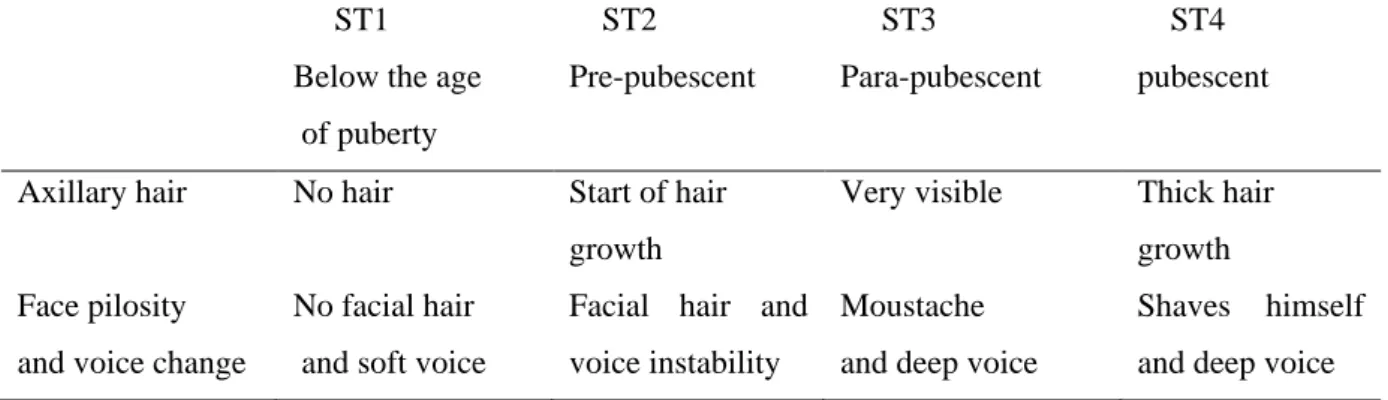
An evaluation of secondary stages was also done using a simplification of Tanner stages because the determination of the secondary sexual characters as external genitalia is not ethically conceivable. Theses puberty stages were assessed based on facial and axillary hair pilosity as well as voice changes. The degree of maturation was thus determined using four different stages (Table 1). The stage below the puberty (ST1, Stage 0 of Tanner); the stage pre-pubescent (ST2, Stages 1 and 2 of Tanner), the
5 stage para pubescent (ST3 stage 3 of Tanner) and the stage pubescent (ST4, Stages 4 and 5 of Tanner). When there is concordance between the axillary and the face pilosity, we retain the indicated stage. In case of conflict between stages, we hold the higher level. In practice, the majority of stages concern no more the two consecutive stages [18].
Table 1: Classification of the subjects by pubertal stage
ST1 Below the age of puberty ST2 Pre-pubescent ST3 Para-pubescent ST4 pubescent
Axillary hair No hair Start of hair
growth
Very visible Thick hair growth Face pilosity
and voice change
No facial hair and soft voice
Facial hair and voice instability
Moustache and deep voice
Shaves himself and deep voice
Stature was measured in a standing position. Two measurements were taken and a third measurement was required if the two measurements differed by more than 4 mm. All measurements were performed using a floor-standing Seca stadiometer by the same trained technician throughout the study.
In partnership with the French basketball federation, we collected information on stature, age and secondary pubertal stages from a sample of 106 boys aged from 160 and 164 months. The participants were regional level basketball players whose adult statures were known. All participants and parents gave their oral and written informed consent to participate in this study. The permission of the advising doctors of the federation was also procured in accordance with the Helsinki declaration. We carried out a prediction of the stature of young basketball players for which we know, 5 years later, the real stature at 18 years old. This information was obtained for each basketball player with the authorization of their parent.
6 Firstly, prior knowledge of the chronological age between 160 and 164 months associated with pubertal stage, indicated to us if the male basketball players were in advanced, standard or delayed puberty.
Secondly we calculated the Z-score value of the basketball player's stature based on chronological age, the average and the data obtained from the sedentary reference subject. Then, we made a projection of the Z-score from our models to estimate adult stature.
Statistical analysis
Results are expressed as mean ± SD with the range value. The predicted adult stature versus real adult stature is represented graphically. For all regression, r², and the standard error of prediction were calculated. We also graphically represented the individual differences between the estimated stature and the real stature in adulthood. The 95% confidence intervals for predicted adult stature was indicated. For all tests, P<0.05 was considered significant. Statistical tests were performed using Statistica software (version 6; StatSoft, Tulsa, Okla, USA).
Results
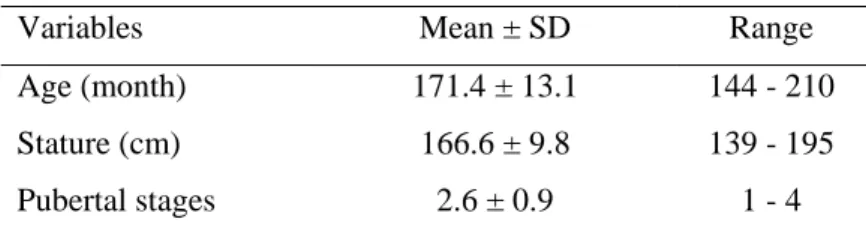
Table 2 give means, standard deviation and the range of the variables of the reference sample. We observed a great variability of stature and maturity between 12 and 17.5 years old.
Table 2: Mean and SD values in the total sample (n=125).
Variables Mean ± SD Range
Age (month) 171.4 ± 13.1 144 - 210
Stature (cm) 166.6 ± 9.8 139 - 195
Pubertal stages 2.6 ± 0.9 1 - 4
Table 3 showed the repartition of age at peak velocity (APHV) between the individuals with advanced, standard and delayed puberty. Significant differences between APHV (P<0.01) was observed between each maturation group. These differences of the APHV allow us to classify the subjects into three
7 categories of subjects according to their maturity. We found 24 adolescents (19%) with advanced puberty, 24 with delayed puberty (19%) and 77 with standard puberty (62%).
Table 3 : Mean and SD of the APHV for each maturation group of sedentary. APHV (month)
Mean ± SD Range
Delayed puberty (n=24) 177.2 ± 3.5 170 - 182
Standard puberty (n=77) 166.4 ± 1.8 162 - 169
Advanced Puberty (n=24) 155.4 ± 3.6 146 - 160
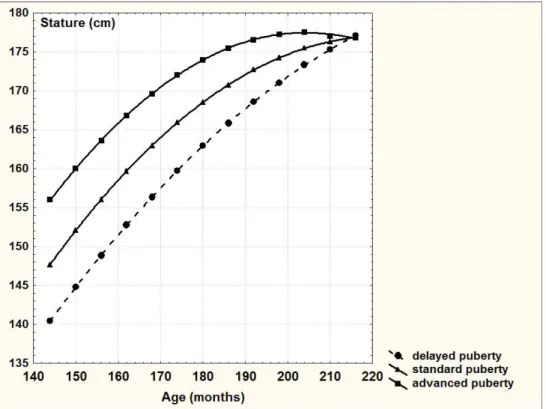
Three average curves of the longitudinal stature were drawn for each puberty group (Figure 1). This sedentary teenager growth curves established a new reference table allowing to accurately predict adult stature in young male basketball players.
8 We found a connection between the descriptive secondary pubertal stages and the APHV. Between the age of 160 and 164 months, all sedentary subjects with delayed puberty are below the age of puberty (ST1), all sedentary subjects with standard puberty are pre-pubescent (ST2) and all sedentary subjects with advanced puberty are pubescent (ST3).
Before 160 months and after 164 months we observe a large variability of the APHV for the same pubertal stage. Under this conditions, we cannot know if the subject has a delayed, standard or advanced puberty.
After having determined the degree of maturation of the subject, one can carry out a projection of his stature knowing the average and the standard deviation of the stature between 160 and 164 months Table 4: Mean stature(cm) at delayed, standard or advanced puberty between 160 and 164 months.
Puberty/Age 160 months 161 months 162 months 163 months 164 months Mean stature (cm) at delayed puberty 151.5 152.1 152.7 153.4 154.0 Mean stature (cm) at standard puberty 159.3 159.9 160.5 161.1 161.7 Mean stature (cm) at advanced puberty 165.3 165.8 166.3 166.8 167.3
For example : the stature of a male basketball at 163 months is 178 cm. • At stage 1: Z score = (178-153.4)/6 = 4.1.
At 216 months the prediction of adult stature will be : 177 cm + 6x4.1 = 201.6 cm. • At stage 2: Z-score = (178-161.1)/6 = 2.81.
At 216 months the prediction of adult stature will be: 177 cm + 6x2.81 = 193.9 cm. • At stage 3: Z-score = (178-166.8)/6 = 1.87.
At 216 months the prediction of adult stature will be: 177 cm + 6x1.87 = 188.2 cm.
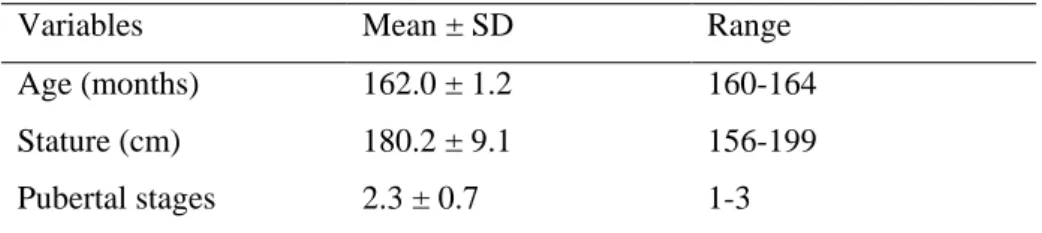
Mean, standard deviation of age, stature and pubertal stages of the basketball players were represented in Table 5.
9 Table 5: Mean and SD values in the total basketball players (n=106)
Variables Mean ± SD Range
Age (months) 162.0 ± 1.2 160-164
Stature (cm) 180.2 ± 9.1 156-199
Pubertal stages 2.3 ± 0.7 1-3
In the total group of basketball players, 13.2% had a delayed puberty, 43.4% a standard puberty and 43.4% an advanced puberty. By using the results of table 5, we calculated for each basketball players the values in Zscore according to the age then carried out an estimate of the stature at 18 years old. The relationship between estimated adult stature and final stature is presented in Figure 2, and the correlation was high (r=0.98) with a low standard error estimate (SEE= 1.65 cm).
Figure 2: Regression line between predicted adult stature versus stature for basketball players.
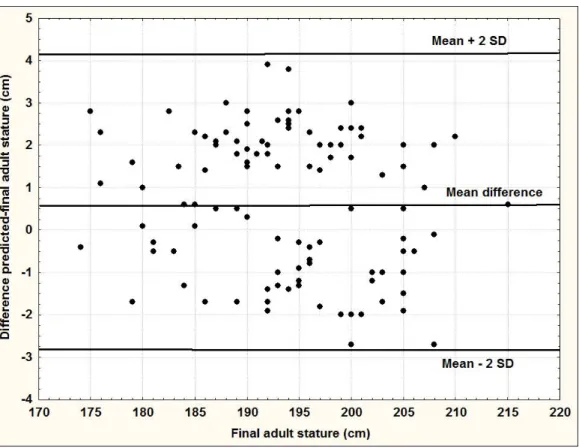
Differences between the estimated adult stature and the final stature were indicated in Figure 3. Mean and standard deviation of these differences were 0.7±1.7. Typically, 98% of the predictions lies within
10 ± 3 cm for boys aged 13.5 years of age. Figure 3 showed no significant bias between the adult stature estimated and the difference between estimated stature and adult stature (r=0.04, P=0.7).
Figure 3: Difference between predicted adult stature and final adult stature.
Discussion
This study shows that the knowledge of the biological maturation define from the age of peak velocity (APHV) make possible to differentiate the subjects with delayed, standard and advanced puberty. Consequently we have developed new stature growth curves based on this three group from a longitudinal study of sedentary boys. Mean age values for stature in the intermediate curve (standard puberty) are similar to the United States growth charts [19]. The mean value of our standard maturers APHV (13.9 years) is similar to the Swedish population APHV [20]. At the same chronological age, advanced maturers are taller than delayed maturers [21].
The stature growth curves based on this three groups showed that final stature (18 years old) is approximately equal whatever the maturity group. May be, this result indicated that final stature does
11 not depend on the timing of the puberty [22]. Karlgerg et al showed, using the APHV, that children with early pubertal maturation are taller before puberty but equal in final stature to children with late pubertal maturation [23].
Although the basketball players have on average a stature higher than the sedentary, the accuracy of the prediction of adult stature does not depend on the level of stature. Indeed, no significant bias between the adult stature estimated and the difference between estimated stature and adult stature was observed (r=0.04, P=0.7). For this reason, the prediction of adult stature of sedentary boys is applicable to the basketball players. The mean differences between predicted and final adult stature of the basketball players is 0.67 cm with 95% limits of agreement of [-2 ; + 3 cm].
The prediction of adult stature from the age of 13 and a half years is of major interest in basketball where stature is an important criterion in reaching the highest level. In our study, we found a connection between the descriptive secondary pubertal stages and the APHV. Consequently, between 160 and 164 months, the knowledge of the pubertal stage allows us to classify subjects with delayed, standard or advanced puberty without possible intersection and without waiting for the onset of the peak height velocity. The choice of the criterion of age associated with biological maturity is essential and not arbitrary. From this criterion, we firstly identified if the puberty of every basketball player is advanced, standard or delayed then we made a prediction of adult stature. This method provided an accurate estimation of adult stature, which is within 3cm in 98% of cases. It seems that our prediction model is however better than other models observed in scientific literature regardless of the prediction methods used.
Ali et al. developed non-radiographic prediction methods using a mathematical curve fitting and regression approach [24]. However, their method could not predict final stature before PHV because the method also required the actual PHV value, and so prediction was possible only after 14 years in boys. Shin-Jae Lee et al. [25] predicted the final stature using multiple regression analysis that includes biological parameters with sufficient accuracy. However, they incorporated into the prediction equation the age at 'take off' which is the age of attaining the local minimum before reaching the age at peak height velocity (PHV) on the velocity curve. Consequently, this final prediction stature method is only applicable in the early pubertal growth period.
12 Various methods for the prediction of adult stature have been developed in literature. In France, the useful method proposed by Sempé [26] consists of using growth curves established from stature according to chronological age. Unfortunately, for the puberty period, this prediction is not accurate because the growth curves do not take into account biological maturation.
Sperlich and al. [27] predicted stature in boys with untreated constitutional growth delay by using the bone age methods. Among 49 boys examined, 16 out of 49 (32.6 %) had an adult stature prediction which differed from the final stature by more than 5 cm. Sherar and al. [15] validated and demonstrated how adult stature can be predicted by using reference values obtained from maturity and sex-specific cumulative height velocity curves. Individuals were classified as early, average or late maturers depending on their age at peak height velocity. This method predicted adult stature within ± 5.35 cm for boys, 95% of the time in a study of 224 boys. Ostojic [28] established a model for the prediction of adult stature in young Caucasian male athletes engaged in sports such as basketball, soccer, volleyball and swimming. The Tanner-Whitehouse method [29] uses TW skeletal ages of hand-wrist radiographs and baseline stature as predictors, while mid-parent stature was used as a correction factor. This method can predict adult stature within [- 5,8 cm ;+ 4,5 cm], 95% of the time in 135 athletic boys.
The Beunen-Malina method is a non-invasive prediction of adult stature. Maturity groups of boys were classified using relative skeletal age. Age-specific correlations between predicted and measured adult stature vary between 0.7 and 0.74 at 13 and 14 years of age respectively. Moreover, mean differences and standard errors of estimate (SEE) of predicted adult stature are respectively 2.3 cm and 4.7 cm at 13 years of age [30].
The Beunen-Malina-Freitas method [16] is a non-invasive prediction of adult stature in girls without the use of skeletal maturity. Adult stature was predicted from stature, leg length, sitting height ratio, forearm circumference, and menarcheal status. The age-specific confidence intervals were ± 5.4 cm at 13 years and ± 4.6 cm at 14 years. Ultimately, most of the adult stature prediction models give an individual accuracy higher than 3 cm 95% of the time, and can sometimes be restrictive because of the necessity to perform hand and wrist radiography. In our study, the accuracy of the prediction of the adult stature remains independent from the level of stature.
13
Conclusions
In summary, the main objective in the prediction of young male basketball players’ adult stature from the age of 13 and a half years was reached. The results can be obtained in real time with an accuracy of about ± 3 cm, 98 % of the time, by using a non-invasive protocol which does not require radiation. Our method can be used for all athletic and sedentary teenagers.
Acknowledgments
This study was supported by the MSJEPV (Ministère des Sports, de la Jeunesse, de l'Education Populaire et de la Vie Associative) and the INSEP (Institut National des Sports et de l'Education Physique).
References
1-Buckler JHM. A longitudinal study of adolescent growth. New-York. Springer-Verlag; 2012.
2-Himes JH. Long-term longitudinal studies and implications for the development of an international growth reference for children and adolescents. Food and Nutrition Bulletin 2006; 27: 199-211.
3-Lee TS, Chao T, Tang RB, Hsieh CC, Chen SJ, Ho LT. A Longitudinal Study of Growth patterns in schoolchildren in one Taipei District II: sitting height, arm span, body mass index and skinfold thickness. J Chin Med Assoc 2005;68: 16-20.
4-Hebbelinck M, Duquet W, Borms J, Carter JEL. Stability of somatotypes: a longitudinal study of Belgian Children age 6-17 years. American Journal of Human Biology 1995; 7: 575-88.
5-Sorkin JD, Muller DC, Andres R. Longitudinal change in height of men and women: Implications for interpretation of the body mass index. The Baltimore longitudinal study of aging. Am J Epidemiol 1999; 150:969-77.
6-Cole TJ. The development of growth references and growth charts. Ann Hum Biol 2012; 39: 382– 94.
7- Rosario AS, Schienkiewitz A, Neuhauser H. German height references for children aged 0 to under 18 years compared to WHO and CDC growth charts. Ann Hum Biol 2011;38:121-30.
14 8-Borghi E, de Onis M, Garza C, Van den Broeck J, Frongillo EA, Grummer-Strawn L, Van Buuren S, Pan H, Molinari L, Martorell R, et al. Construction of the World Health Organization child growth standards: selection of methods for attained growth curves. Stat Med. 2006; 25:247–65.
9-Hermanussen M, Lange S, Grasedyck L. Growth tracks in early childhood. Acta Paediatrica 2001; 90: 381-6.
10-Hermanussen M, Grasedyck L, Kromeyer-Hauschild K, Prokopec M, Chrzastek-Spruch H. Growth Tracks in prepubertal children. Annals of Human Biology 2002; 6: 667-76.
11-Bayley N, Pinneau S. Tables for predicting adult height from skeletal age: Revised for use with the Greulich-Pyle hand standards. Journal of Pediatrics 1952; 40:423-41.
12-Roche AF, Wainer H, Tissen D. The RTW-method for the prediction of adult stature. Pediatrics 1975; 56:1026-33.
13-Tanner JM, Whitehouse RH, Marubini E, Resele LF. The adolescent growth spurt of boys and girls of the Harpenden Growth study. Annals of Human Biology 1976; 3: 109-26.
14-Mirwald RL, Bawter-Jones AD, Bailey DA, Beunen GP. An assessment of maturity from anthropometric measurements. Medicine and Science in Sports and Exercise 2002; 34:689-94.
15-Sherar LB, Mirwald RL, Baxter-Jones AD, Thomis M. (2005). Prediction of adult height using maturity-based cumulative height velocity curves. The Journal of pediatrics,147(4):508-514.
16-Beunen GP, Malina RM, Freitas DI, Thomis DL, Maia JA, Claessens AL et al. (2011). Prediction of adult height in girls: The Beunen-Malina-Freitas method. Journal of Sports Sciences 2011; 29:1683-91.
17-Malina RM, Bouchard C, Bar-Or O. Growth, Maturation and Physical Activity, 2nd Ed. Human Kinetics, Champaign, IL. 2004.
18-Pineau JC, Ludes B. Prediction of teenager's age from 12.5 to 16 years old. La Revue de Médecine Légale 2018; 9:68-73. https://doi.org/10.1016/j.medleg.2018.02.001
19-Kuczmarski RJ, Ogden CL, Guo SS, Grummer-Strawn LM, Flegal KM, Mei Z et al. 2000 CDC Growth Charts for the United States: methods and development. Vital Health Stat 2002; 11: 1–190. 20- Liu YX, Wikland KA, Karlberg J. New reference for the age at childhood onset of growth and secular trend in the timing of puberty in Swedish. Acta Paediatr 2000; 89: 637-43.
15 21- Vizmanos B, Marti-Henneberg C, Cliville R, Moreno A,Fernandez-Ballart J. Age of pubertal onset affects the intensity and duration of pubertal growth peak but not final height. Am J Hum Biol 2001; 13: 409-16.
22- Abassi V. Growth and normal puberty. Pediatrics 1998; 102: 7–11
23- Karlberg J, Fryer JG, Engstrom I, Karlberg P. Analysis of linear growth using a mathematical model. II. From 3 to 21 years of age. Acta Paediatr Scand Suppl 1987; 337: 12–29.
24-Ali A, Ohtsuki F. Prediction of adult stature for Japanese population: a stepwise regression approach. Am J Hum Biol 2001; 13:316-22.
25-Lee SJ, An H, Ahn SJ, Kim YH, Pak S, Lee JW. (2008). Early stature prediction method using stature growth parameters. Annals of Human Biology 2008; 35:509-17.
26-Sempé M, Pédron G, Roy-Pernot M. Auxologie: méthode et séquences. Paris: Théraplix; 1979. 27-Sperlich M, Butenandt O, Schwarz HP. (1995). Final height and predicted height in boys with untreated constitutional growth delay. European Journal of Pediatrics 1995;154:627-32.
28-Ostojic SM. (2013). Prediction of adult height by Tanner-Whitehouse method in young Caucasian male athletes. Q J Med 2013;106: 341-5.
29-Tanner JM, Whitehouse RH, Cameron N, Marshall WA, Healy MJR, Goldstein H. Assessment of skeletal maturity and prediction of adult height. New York: Academic Press; 1983.
30-Beunen GP, Malina RM, Freitas DI, Maia JA, Claessens AL, Gouveia ER et al. Cross-validation of the Beunen-Malina method to predict adult height. Annals of Human Biology 2010; 37:593-7.