REPORT FROM THE FIELD
EDUCATION UNDER STRUCTURAL ADJUSTMENT
IN NIGERIA AND ZAMBIA
JOEL B. BABALOLA University of Ibadan (Nigeria) GEOFFREY LUNGWANGWA University of Zambia AUGUSTUS A. ADEYINKA University Swaziland
ABSTRACT. This paper set out to measure, on a longitudinal basis, the effects of Structural Adjustment Program (SAP) on the education systems in Nigeria and Zambia. Trends revealed that fIScal measures introduced by Nigeria and Zambia during SAP had some devastating effects on public expenditure on education, the purchasing power of teachers, quality of education, access to education, and gender gap in the provision of education at aillevels. Between 1984 and 1988, for instance, both countries experienced about an 8 % reduction in the share of education in the national budget. In a similar vein, public spending per student feH by 32.96% and 60% in Nigeria and Zambia respectively. At the same time, the high inflation rates in both countries led to a significant reduction in purchasing power. Consequently there were, in most cases, downward trends in the gross enrolment ratio, female participation in education, completion rate, pupils per school, pupil-teacher ratio, and performance in international exami-nations. Due to differences in educational priorities, the negative effects of SAP varied by educationallevels, and between Nigeria and Zambia.
RtSUMt. Les auteurs de cet article s'emploient à mesurer longitudinalement les effets d'un programme d'ajustement structurel (PAS) sur les systèmes d'éducation du Nigéria et de la Zambie. Tout porte à croire en effet que les mesures fmancières adoptées par leN igéria et la Zambie durant le PAS ont eu des effets catastrophiques sur les dépenses publiques consacrées à l'éducation, sur le pouvoir d'achat des enseignants, la qualité de l'éducation, l'accès à l'éducation et le fossé hommes-femmes darts les services d'éducation à tous les niveaux. Entre 1984 et 1988 par exemple, les deux pays ont enregistré une baisse d'environ 8 % de la part de l'éducation darts le budget national. Darts une même veine, les dépenses publiques par élève ont baissé respectivement de 32,96 % et 60 % au Nigéria et en Zambie. Pendant ce temps, l'inflation élevée darts les deux pays a entraîné une forte baisse du pouvoir d'achat. Il y a donc eu darts la plupart des cas un fléchissement du taux de scolarisation, de la participation des femmes à l'éducation, des taux de réussite, du nombre d'élèves par école, du rapport enseignants-élèves et des résultats obtenus aux examens internationaux. Compte tenu des différences relatives aux priorités pédagogiques, les effets délétères du PAS ont varié selon le niveau d'études et entre le Nigéria et la Zambie.
Baba/o/a. Lungwangwa. & Adeyinka
Structural Adjustment Pro gram (SAP) "is a wrenching change in economie poliey. p.1." This comment by the Wodd Bank (1998), one of the initiators of SAP, questions the continued desirability of this program in Africa where SAP has been widely undertaken. Neverthe-less, structural adj ustment, according ta Lungwangwa (1993), is an attempt ta address those internaI indicators in the local economy, which make growth and reform untenable.
Considering the positive and negative aspects of SAP, this paper is intended to assess the extent of wrenching impacts of SAP on the education sectors in Nigeria and Zambia and to propose ways by which the negative effects can be ameliorated. In examining the SAP impact, sorne consideration will be given to the criticism of Noss (in Copple & Rota, 1991).
Studies generally rely on weak bases and poody specified explanatory models that cannot assess causal links between adjustment and educa-tion indieators, and that usually do not differentiate between the im-pact of adjustment programs and of external shock (p. 28).
This paper, however, does not attempt to differentiate between SAP effects and those of external shocks as suggested by Noss (1991). This is owing to the fact that the external shocks (such as oil and commodity priee shocks, the debt crisis, the breakup of the Soviet Union, and severallocal wars) are forces over whieh the individual countries have no control (Lungwangwa, 1993; Bruno, 1996). Of course, SAP is an offshoot of the external shocks brought about by unfavorable interna-tional economic conditions. These include deliberate reductions in the prices of the Third W orld commodities, the astronomie rise in the interest rates and debt services on externalloans, and the trend towards trade protection by the developed world. Nevertheless, it is worth considering the proposaI by Noss (1991) that any discussion of SAP impact on education should start with a description of the initial conditions. While SAP might not be the only factor contributing ta the post-SAP problems in education, it is assumed in this paper that with-out SAP, the increasing trends in enrolments which preceded SAP would not have changed signifieantly from those of the baseline con-ditions in Nigeria and Zambia. Perhaps, if SAP had not been adopted, if the initial financial situation had been left uncontrolled, and if the initial growths in enrolment, teacher number, and schools had been left unabated, quality of education could have been affected adversely.
Education Under Structural Adjustment
Consequently, the simple cause-effect relationship postulated between the adoption of SAP and education development has focused on the available quality and quantity indicators in education. In spite of the dearth of data, this paper deals with education development issues that are not given the coverage they deserve. The next section sets out the context, showing the evolution of the Structural Adjustment Program in Africa generaUy, and in Zambia and Nigeria more particularly.
SAP IN AFRICA
The decades of the 1970s and 1980s can never be forgotten in the economic history of Africa. Using the words of the World Bank (1988, Figure 1), in the late 1970s, commodity prices were strong in Africa. The commodity boom was, unfortunately, short lived owing to the global economic slowdown, which led to stringent economic policies at the internationallevel in the early 1980s. Consequently, there was a sharp faU in commodity pricesand a general increase in the real interest rates on externalloans. Many African countries suddenly found them-selves squeezed between faUing of national revenue and increasing debt payment coming due.
How did African countries react to these external shocks? There was the immediate thought that things would improve with time. Most African countries then 50ught short-term assistance from the Interna-tional Monetary Fund (IMF) and the World Bank. Realizing that the economic situation might not he as temporary as thought by African governments, the IMF and the World Bank, working with government officiaIs, agreed on a program that would enable each country in Africa to adjust to the new tightened circumstances. Hence, the concept of "adjustment program".
The proponents of SAP were of the opinion that, to be eligible for these loans, there were structural economic problems to be addressed by each African country. According to the World Bank (1988), sorne kind of correction - either planned by the government or unplanned and forced through market adjustments - had to occur to make ends meet. Thus, a range of measures, known as SAP, were introduced to reduce internaI and external deficits, increase efficiency in the economy and reduce government expenditure. These measures include: (1) Chang-ing the exchange rate to reflect more closely the true value of the currency 50 that export from African countries became more profitable while imports hecame more expensive. Thus the volume of imports
Babalola. Lungwangwa. Gr Adeyinka
would be reduced and producers would be encouraged to use more labour-intensive methods and more domestie raw materials; (2) Reduc-ing govemment payrolls; (3) SellReduc-ing to private interest govemment-owned enterprises; (4) Raising agricultural priees doser to world-mar-ket levels to encourage greater agrieultural production; and (5) Reduc-ing subsides both on consumption items, and to producers.
Each of these measures has either direct or indirect impact on every govemment institution, induding education, wherever SAP is imple-mented. Observers of the working of SAP have pointed out that various provisions of the program have contributed to retrenchment, retire-ment, unemployretire-ment, social inequality, poverty, and reduction in the quality of life. AlI these have the potential of lowering the benefits and raising the costs of education to the individuals. In fact, it would not be too far from reality to assert that the impoverishment of many parents created by SAP, could lead to school dropouts, poor nutrition, inability to bear the cost of education, and poor academie performance among school children (NISER, 1998).
In spite of these social costs, SAP is generally embraced in Africa. Its measures have been implemented by more than fifty-five developing countries, most of them in sub-Saharan Afriea (World Bank, 1988). T 0
most countries, SAP cornes as a possible way out of the economie diffieulties and a way of maintaining politieallegitimacy and stability. Nevertheless, while countries such as Zambia received SAP with little debate, others, such as Nigeria, were reluctant at accepting sorne of its measures. While Zambia under Kenneth Kaunda entered into SAP as far back as 1984, Nigeria, under Ibrahim Babangida, on the other hand, did not accept SAP fully until 1986. The reason for the time lag at implementing SAP can be found in the differences in the initial eco-nomie conditions in Zambia and Nigeria.
SAP IN ZAMBIA
SAP came at the time when the Zambian economy had reached a signifieant level of strain (ILO, 1981). As rightly observed by Kelly (1991), economie factors, arising primarily from Zambia's unbalanced economy and its dependence on a single primary product (copper), have brought about the economie dedine. The priee of copper col-lapsed in 1975. The contribution of mineraI receipts to the economy fell from sorne 7 per cent in 1975, to virtually zero per cent in 1977 and 1978. By 1979, the situation had deteriorated badly, with more than 1
Education Under Structural Adjustment
per cent of the government annual expenditure being used to support
the mining industry (Kelly, 1991). By 1982, the real price of copperwas at its lowest for nearly 40 years (Krumm, 1984, in Kelly, 1991). Coupled with the dwindling income from Zambia's exports was the rise in the prices of oil imports. In 1985, Zambia used 33 per cent of its foreign exchange eamings to buy a much smaller quantity of oil than what it used about 8 per cent of its foreign exchange eaming to purchase in 1975. Zambia's initial conditions have been weIl summarized by Lungwangwa (1993) in the following statement:
The steep declines in the price of copper. . . the rise in the oil importation bill. These factors combined with the rise in the re-routing of the trade route from the South to the North in Tanzania, the devaluation of the local currency, the liberation wars in South Africa. and the heavy subsidies. . . plunged the country into eco-nomic difficulties and easily became a candidate of SAP. (p. 5)
On the 29th of January 1985, Zambia embraced SAP as a means of obtaining the International Development Association (IDA) loan, CR 1545 A - 005 - ZA to rehabilitate agriculture. The loan, which was US$35 million, was expected to close on the 30th June 1988 (World Bank, 1995, Annex - Table 1, p. 276).
SAP IN NIGERIA
Unlike in Zambia, it is not easy to establish the adjustment period of SAP in Nigeria. While sorne Nigerians believed that adjustment started in 1986 with the foreign exchange deregulation, records show that SAP started as far back as 1983 when Nigeria signed a credit agreement, Ln 2345 - UNI, with the International Bank for Reconstruction and De-velopment (IBRD) for a loan of US$250 million to import fertilizer. The short-term loan spanned the period between September 13, 1983 and December 31, 1986.
"SAP has been necessitated by the magnitude of Nigeria's wasteful habits which have been allowed to drag on for too long before adjust-ment measures were introduced" (Babalola, 1990). Like Zambia, Ni-geria is a monolithic economy, depending mainly on the oil sector as the only source of foreign exchange and government revenue. Unlike in Zambia, however, the economic problem faced in Nigeria was not in connection with its production pattern. Rather, being an oil-exporting country, it was linked with its consumption-investment patterns.
Baba/o/a. Lungwangwa. & Adeyinka
Falegan (1979), in his attempts to justify the full-fledged SAP in Nigeria, stated that there was a need to move resources gradually from consumption to investment, from import to export trade and from social to purely economic activities. T 0 lend credence to Falegan's
earlier statement, the President of Nigeria in 1988 also stated that "Nigerians cannot afford to relapse into lavish consumption patterns and wasteful habits" (Babangicla, 1988). It was this kind of thought that led to the continuation of SAP beyond the initial deadline of December 1986. Having discussed the background to SAPs in both Zambia and Nigeria, the next section raises pertinent issues to be addressed in this paper.
SAP AND RELATED ISSUES
When structural adjustment was initiated in both Nigeria and Zambia, it was expected to be a short-lived phenomenon. Its adverse impact, if any, was expected to be a temporary one. Over time, however, it became clear that adjustment was going to take longer than antici-pated. This led to a growing concern about the need to take a conscious action to mitigate the costs of adjustment. At the Same time, there has been sorne debate about the extent of the short- and long-run negative impact of SAP on human development (Mahmood, 1995). In order to facilitate actions on how to mitigate the negative impact of SAP on education, the following questions need to be addressed:
1. What has been the impact (negative and positive) of SAP on the education system? Which levels or aspects of education of the system have been most affected?
2. What have the governments done to ameliorate the negative impact of SAP?
3. Is adjustment creating the base for a growth path that would ensure rapid educational development in Nigeria and Zambia?
The rest of this paper sets out to discuss the above questions, using the available data from official documents.
SAP IMPACT ON EDUCATION IN NIGERIA AND ZAMBIA
This section highlights the three-stabilization policies adopted by Ni-geria and Zambia during adjustments in order to discuss their impact on available indicators of educational development. Having experienced high inflation, loss of foreign exchange reserves, and an unsustainable
Education Un der Structural Adjustment
current deficit prior to SAP, Nigeria and Zambia attempted to reduce fiscal deftcits. They devalued their currencies to maintain a balance between import and export and reduce negative interest differential or maintain a reasonable balance between the local deposit rate and the international interest rate (external balance).
Fiscal policy and internai balance
Nigeria and Zambia did not reduce fiscal deftcit significantly and there-fore experienced rising inflation during adjustments. The fiscal deftcit, which was -9.4 in Nigeria at the inception of SAP in 1983, came down to -4.1 in 1984, -2.5 in 1985, and -2.8 in 1986. The deftcit however, rose from -8.6 in 1987 to -10.0 in 1988. Nevertheless, it fell from -6.1 in 1989 to 3.2 in 1990. In similar vain, the fiscal deficit which was -14.4 at the inception of SAP in Zambia in 1985 increased to -28-0 in 1986, dropped to -12.9 in 1987, rose again through -13.1 in 1988, and -11.2 in 1989 to -20.5 in 1990. Consequently, because of the unstable fiscal policies and internaI balance in Nigeria and Zambia respectively, each country's efforts to curb inflation was a step forward and two steps backward during adjustments (The World Bank, 1995, Annex Table 3.2, p. 289).
Poor fiscal policy and educational spending
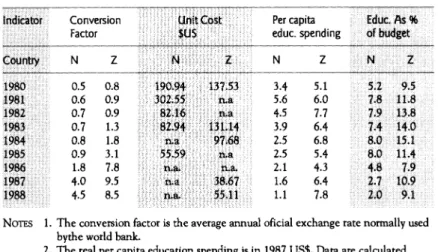
The inability of Nigeria and Zambia to maintain internaI balance has a two-pronged effect on educational spending. First, the insignificant attempt to reduce central government deficit has a negative impact on the public expenditure on education. In Nigeria, for instance, per capita education spending dropped from 5.6 in 1981, through 3.9 in 1983, and 2.1 in 1986, to 1.1 in 1988 (Table 1). In Zambia, however, the downward trend in the per capita education spending was short lived. Having dropped from 5.4 in 1985 (when SAP started) to 4.3 in 1986, per capita spending picked up from 6.4 in 1987 to a remarkable level of 7.8 in 1988.
As
far as the share of education in the national budget is concerned, both countries experienced downward trends from 1984 when education shares were 8.0 per cent and 15.1 per cent in Nigeria and Zambia respectively. By 1986, Nigeria and Zambia experi-enced about 3 per cent and 7 per cent drops in education shares respectively. By 1988, both countries experienced about 6 per cent drop in education shares when compared with their 1984 levels.The consequential effect of a reduction in public spending on the expenditure per student is shown in Table 1. Unit cost, which was
Baba/o/a. Lungwangwa. & Adeyinka
TABLE 1. Public expenditure on education during adjustments in Nigeria (N) and Zambia (l)
Conversion Factor N Z 0.5 0.8 0.6 0.9 0.7 0.9 0.7 1.3 0.8 1.8 0.9 3.1 1.8 7.8 4.0 9.5 4.5 8.5 Per capita educ. spending N Z 34 51 H9~"
Ù
6:0>1:811.8 4.5 7.7 •... · .• 1.~13.8 .. 3.9 M···Mli4;o)
2.5 6.8...8;0
15.l· . 2.5 5.4 .. 8.0·. 1104'~:!
::! •...••.•.••...•. ·
.•.. i
z
... · ..
. 8 . o · •.1
..•••.•..•. ·
••...•••. ' .
1~1
1.1 7 . 8 ! U NOTES 1. The conversion factor is the average annual oficial exchange rate nonnally usedbythe world bank.
2. The real per capita education spending is in 1987 US$. Data are calculated using theconversion factors.
Sources 1. World Bank (1992) African Deve/opment Indicators. 2. UNESCO Swistical Yembooks (Various Years)
TABLE 2A. Educational development before and during adjustments in Nigeria (N) and Zambia (Z) FIRST LEvEL YEAR 1975 1980 1981 1982 1983 1984 1985 1986 1987 1988 1989 1990 PuPllS Pt:R SCHOOL N Z 291 322 377 370 381 401 387 412 376 431 412 375 431 415 333 420 364 420 384 414 389 407
SouRCES: -UNESCO Swistical YeaT Books 1988,1991, 1992, 1995. -World Bank (1992) African Development Indicators
(for performance on international examinations)
- Republic of Zambia, Ministry of Education (1995) Education Swistics Bulletin.
Education Under Structural Adjustment
TABLE 2B. Educational development before and during adjustments in Nigeria (N) and Zambia (Z) SECOND lEvn YEAR 1975 1980 1981 1982 1983 1984 1985 1986 1987 1988 1989 1999
STUDENT-T EACHER RATIO
10 10 9 9 20 20 22
NOIE: -% Passes (OL) = % of test-takets that passed London (and Cambridge) GCE '0" Level
SoURCES: -UNESCO Statislical Year Books 1988,1991, 1992, 1995.
-World Bank (1992) African De\lelopment IndicatoTS
(for perfonnance on international examinations)
-Republic of Zambia, Ministty of Education (1995) Education Statistics Bulletin.
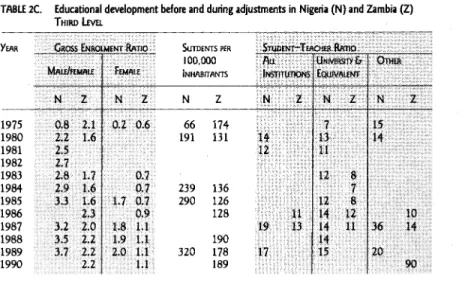
TABLE 2e. Educational development before and during adjustments in Nigeria (N) and Zambia (Z) TH/RD LML YEAR 1975 1980 1981 1982 1983 1984 1985 1986 1987 1988 1989 1990 SUTDENlS PER 100.000 INHABITANTS N Z 66 174 191 131 239 136 290 126 128 190 320 178 189
SouRCES: -UNESCO StatistiCal Year Books 1988,1991, 1992, 1995.
-World Bank (1992) African De\le/opment Indicators
(for performance on international examinations)
-Republic of Zambia, Ministty of Education (1995) Education Statistics Bulletin
Baba/a/a. Lungwangwa. &-Adeyinka
US$82.92 at the inception of SAP in Nigeria in 1983 dropped to US$55.59 in 1985. In a similar vein in Zambia, the unit cost dropped from US$97.68 in 1984 through US$38.67 in 1987, to US$55.11 by 1988. The second problem associated with the ineffective expenditure reduction policies in Nigeria and Zambia is high inflation. The World Bank (1995) reveals that the annual inflation rates which were 10.0 and 11.6 in Nigeria and Zambia in 1980 rose to 51.0 and 96.4 in 1989 in both countries respectively. Kelly (1991) has rightly captured the inflationary effect of the inadequate expenditure reduction in Nigeria and Zambia in the following statement:
Funds to purchase teaching materials and school equipment de-clined ... T eachers' salaries lost much of their purchasing power that many felt compelled to take up additional money generating activi-ties to supplement their incomes.
The situation in Nigeria is quite similar to that ofZambia, as described above in the late 1980s, for example, SAP has become one of the major issues contributing to the crisis in Nigeria education. As Adeyinka (1993) has observed:
The fmancing of Nigeria's education system has reached a crisis point. Govemments do not seem to be able to make adequate pro-visions for capital development in the various educational institu-tions. Classroom accommodation, student's hostels, staff quarters (where they exist at aU) do not seem to be adequate. AU these are as a result of the biting effects of the Structural Adjustment Program (SAP) and the Foreign Exchange Market (FEM). (p. 9)
Reduction in public spending and educational development
Table 2(A,B,C) reveal the effects of the reduction in education spend-ing on various indicators of educational development in Nigeria and Zambia. The following discussion is presented by level of education to highlight the variation in SAP effects on educational development.
First level education
The objectives of the first level of education are to produce a literate and numerate population and to lay the groundwork for further educa-tion (Babalola, 1996). The effectiveness of the second and third levels of education rests on a solid foundation which is a product of the primary education systems. Considering the declining public expendi-ture on education during adjustment in Nigeria and Zambia, has
Education Un der Structural Adjustment
mary education been able to meet its objectives? The next discussion provides answers to the above question by looking at the trends in the gross enrolment ratio, female partidpation, completion rate, pupils per school and pupils per teacher (the choice of these indicators has been dictated by the availability of data).
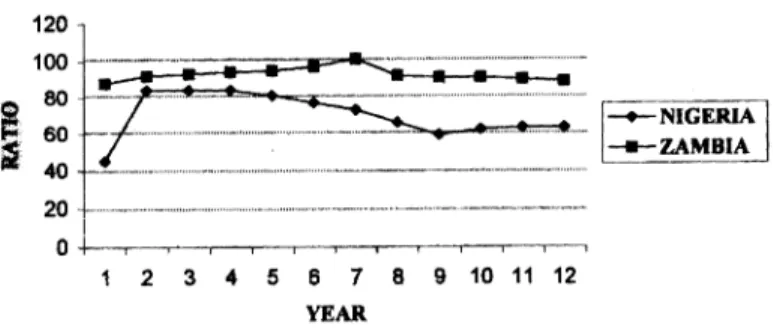
Gross enrolment ratio
Figure 1 reveals a wider gap between Nigeria and Zambia as far as the gross enrolment ratio is concemed. Since 1975, Nigeria has increas-ingly failed to provide aUschool-age children with the opportunity to attain necessary skills that would enable them to contribute effectively to the development of the nation. However, the drop in gross enrol-ment ratio became significant since the inception of SAP in 1983. Between 1983 and 1987, the ratio dropped by about 20 percent. On the other hand, Zambia, which experienced a commendable rise in the enrolment ratio at the first level between 1975 and 1985, suddenly
120 100
-1
80 60J:
40
Fla •• FlRST-LEVEL GROSS ENROLMENTRATIO (IIofIl1ft) NIGERIA AND :l'AMBlA, 1975 -1".
1 2 3 " 5 6 7 8 9 10 11 12 13
YEAR
witnessed a sharp drop during the first year of SAP. Since then, Zambia primary education system has gradually failed to provide aU school-age children with the opportunity to attain functionalliteracy.
Female participation
Figure 2 shows an increasing disparity in female participation in Nigeria and Zambia. This is due to the significant downward trend experienced in Nigeria foUowing SAP in 1983. Nevertheless, Zambia witnessed a sharp drop in female participation during the first year of SAP in 1985, and experienced a graduaI downward trend to 1990. The implication of low participation of girls in primary education cannot be
1
;;
120 100 80 60 40Baba/o/a. Lungwangwa. & Adeyinka
FIG 2. FlRST-LEVJ:L GROSS ENROUlENT RA
no ( ....
only)NIGERIA AND ZAMBIA, 1975 - 19911.
20 ... ~ ... --... " ... -... " ... __ .. __ ._ .. _-_ ... _ ...
".-O+-'--r-.--r-'-~-r-.--r-.-~~
1 2 3 4 5 6 7 8 9 10 11 12
YEAR
sized. The ability to appropriate the sodoeconomic advantages of edu-cation will be depressed as more school-age children, particularly girls, are being excluded from taking part in primary education (Babalola, 1996).
Completion rate
In Nigeria, where data are available, primary schools were faced with the problem of low completion rate following SAP. Out of the 2,762 million 1986 primary school cohort, 5 percent did not complete pri-mary four by 1989, and 56 percent of those dropping out before com-pleting primary four were girls (FME/UNICEF SAPA Study of 1991). Since successful completion of primary four class level is considered as a threshold for attaining permanent literacy and hence stimulate sodo-economic growth, the low completion rates following SAP compromise the system for human capital development (Babalola, 1996).
In Zambia, 21% of the children-entering Grade 1 are unable to com-plete the primary education cycle (GRZ 1996). The dropout rate at this lower level is caused by lack of opportunities for upper primary school in rural areas and rising cost of school uniforms and other educational requisites.
Pupils per school
Figure 3 reveals a widening gap between the number of pupils per primary school in Nigeria and Zambia between 1980 and 1987. While Zambia had tried to maintain a school size of about 400 pupils per school throughout adjustment, Nigeria experienced three types of trends: constant trend between 1983 and 1985; steep downward trend between 1985 and 1987; sharp upward trend between 1987 and 1990. The
Education Under Structural Adjustment
school size in Nigeria was, in most years, around 375. SAP's negative effect was more obvious in Nigeria than in Zambia as far as the conges-tion in schools was concemed. Nevertheless, the situaconges-tion was still better than that of Zambia. lt should be noted here that pupils per school do not automatically reveal educational quality, but only the share of resources. Hypothetically, it is generally believed that smaller schools will increase the amount and quality of teacher-student inter-action. Six U.S. studies however, found no effect, while mixed and inconsistent effects were found in six other studies from England and the U.S. (Fuller, 1986).
FIG J. PUPILS PER PRiMARY SCHOOL, NIGERIA AND ZAMBIA 1975 - . " .
I:l---~
§
3001--~--
--
h _ - - - -- - - -h - - -I-+-
NIGERIA 11
=0
it: --- --- ---.-
~
= :::
:~~
--- , __
ZAMBIA , - - - ; - , - , - ' ---.---r -~ l 2 3 4 5 6 7 8 9 la 11 12 YEARFil 4. FlRST-LEVEL PUPIL-TEACHER RATIO, NIGERIA AND ZAMBIA, .975 -
j"'.
5
E
t~~:_;:_: ~~~~~_J_'::
10 o 6 7 10 11 12 YEAR Pupil-teacher ratioMore important than the pupils per school is the number of pupils per teacher. In Nigeria and Zambia, 40 pupils per teacher has been cons id-ered the critical ratio for effective leaming. Figure 4 shows that, con-strained by money during adjustment, each country was making delib-erate effort to achieve optimum utilization of its teachers without adverse effect on teaching effectiveness. White Zambia was making effort to lower its pupil.teacher ratio from about 50 to 45 in 1985, Nigeria was attempting to upgrade from about 40 to about 45 in 1983. In general, Nigeria was still better off than Zambia in terms of the
Babalola. Lungwangwa. & Adeyinka number of pupils per teacher at this level. Generally, both countries found it difficult to employ teachers despite the increasing enrolments.
Second level education
Hitherto, evidence shows that Zambia was able to attend more posi-tively to access and equity issues in primary education during SAP than did Nigeria (Figures 1-4). The next discussion gives the picture of educational development at the second level during adjustments in Nigeria and Zambia. Second level education is meant to provide a foundation for tertiary education and also to equip young men and women with vocational-technical skills in an environment of dwin-dling public employment opportunities. How have these objectives been constrained by the reduced public expenditure on education in Nigeria and Zambia? Limited by data, the next discussion focuses on the gross enrolment ratio, female participation and percentage of test-takers that passed London and Cambridge GCE Ordinary level exami-nations during adjustments.
Enrolment ratio
Figure 5 shows that Nigeria has alarmingly failed to provide second level educational opportunities for the young people between 1983 and 1990. The enrolment ratio dropped from about 30 in 1983 to less than 20 in 1990; whereas in Zambia, though initially far below Nigeria's level, the enrolment ratio gradually rose above that of Nigeria even during its adjustment.
FIl 5. SECOND LEVEL GROSS ENROLMENT RATIO (both ..,~eo).
NIGRIA AND ZAMBIA, 1975 - 1998 35
1.
~~
.-
3:7: :
:::::s:
1
15;1
1~ -::f~t---2 3 4 5 6 7 8 9 10 11 12 Female participationFigure 6 reveals that female participation in the second level education was adversely affected by the adjustment in Nigeria. The female gross enrolment ratio which was above 25 in 1985 dropped to about 15 in 1989. On the other hand, though below that of Nigeria, female
Education Un der Structural Adjustment
pation was gradually on the incre~ during the period of structural adjustment in Zambia. It is worth noting that female participation in education determines the relevance of an education system. According to King and Hill (1993), raising the level of women's edùcation con-tributes in important ways to social and economic development. In fact, maternaI education has been found to be more useful than paternal education in influencing children's education. This is owing to the fact that, in most cases, child training is more influenced by mothers than by fathers.
FIl 6. SECOND-LEVEL GROSS ENROLMENT RATIO (r-Je oaIy), NIGERIA AND ZAMBIA, 1975 - 1990
2 3 4 5 6 7 8 9 10 11 12
YEAR
Performance in international examinations
Table 1 shows that Nigeria test-takers performed better than their Zambia counterparts in London (and Cambridge) GCE '0' level exami-nations during adjustments; in fact compared with 1975 there was a drastic change in performance during SAP in Zambia. This could have been a result of the trade offbetween quality and quantity in education. Evidences show that Zambia emphasized quantitative growth at the expense of quality in education in spite of dwindling resources during adjustment. On the other hand, the linear educatibnal objectives were down played in Nigeria during SAP to concentrate the available re-sources on qualitative education. This was at the expense of access and equity in education.
Third tevet education
Third level education is basically meant to produce the needed skilled manpower in the economy. To what extent has this level been inca-pacitated by under-funding during adjustments in Nigeria and Zambia? The next discussion provides answers to the above question looking at the available data on gross enrolment ratio, female participation, and student-teacher ratio.
Baba/o/a. Lungwangwa. & Adeyinka
Gross enrolment ratio
Contrary to its experience at the first and second levels, Nigeria in-creasingly made third level education available to the relevant age population in spite of financial restraints during adjustment, In a simi-lar vein, and as in the other lower levels, Zambia gradually increased access to higher education following a drastic reduction in 1987 (that is at the middle of SAP). In general, Nigeria was far ahead of Zambia as far as access to higher education during the time the adjustment was concerned.
Fla 7. TIlIRD-LEVEL GROSS ENROLMENf RATIO (bodt Msel) NIGERIA AND ZAMBlA, 1975 - 1990
2 3 4 5 6 7 8 9 10 11 12 YEAR
Female participation
Figure 8 reveals that both Nigeria and Zambia experienced great im-provements in female participation in higher education during adjust-ment. This is likely to be as a result of the international emphasis on gender balance in education and development (Babalola, 1994: 72). Moreover, it is now widely accepted that an economy derives more benefits from female than from male education.
94
2.5
FI&-8 TIlIRD-LEVEL GROSS ENROLMENT RATIO ( ... 0011), NIGERIA AND ZAMBIA,l975 - 19911.
2 .•... --.- ...• -.. -.• -.•.. - -•.. - ..•...• - •...••• --...•.•..• ~.
f:;~~~~
[;;-_ _ NIGERIA] ZAMBIAo
2 3 4 5 6 7 8 9 10 11 YEAR
Education Un der Structural Adjustment
Student teacher ratio
Unlike at lower levels, Nigeria underplayed quality for quantity in higher education. This is reflected in the step-wise rise in the number of students per teacher since 1983. In similar vein, Zambia increased the number of students per teacher from 8 in 1985 to 12 in 1996. However, by 1987, effort was made to bring the ratio down to Il (Figure 9). In both countries, there was a deliberate effort to apply economies of scale in higher education by allowing the enrolment to grow, but placing embargo on teachers' appointments. This is in response to the dwindling resources. In the words of the Zambia govemment itself (Republic of Zambia, 1996, p. iv): The strategies adopted to cope with declining resources have had negative impacts on the quality of the education and training provided in the majority of institutions and centres. Large classes, reduced hours of classroom instruction, shortages of teaching and leaming materials, inappropriate methodologies, in-ability to place technical students on industrial attachments, and diffi-culties on retaining capable and trained staff have aU contributed to jeopardizing quality within the sector.
16 14
12
R' 10
! :
Fla 9. THJRD..LEVEL STVDENT -TEACHER RATIO <V-lvenltiel ... eqah-alenee), NIGERIA AND ZAMBJA, 1975 -1998.
4 ._-_._-_ .. _-_ .. _----_ ... _ .. __ ... _-... _ ... _._ ... .. 2
o+-~--~~--~--.-~-.--.·_~-.-~
2 3 4 5 6 7 8 9 10 11
YEAR
SUMMARY AND CONCLUSION
This paper ai~ed at assessing the impact of SAP on educational devel-opment in Nigeria and Zambia. In doing this, brief discussions have been made on the evolution and designs of SAP in Africa in general and in Nigeria and Zambia in particular. Moreover, the expenditure reduction measure involved in the SAP package has been discussed in relation to its effects on education spending and development in Ni-geria and Zambia.
Baba/o/a. Lungwangwa. & Adeyinka
Based on the findings of this study, it is crucial for countries with developed economies to know that SAP, being a donor-driven pro-gram, has negative effect on education in receiving countries. In Ni-geria and Zambia, for instance, SAP had deleterious impact on the public expenditure on education, the purchasing power of the incomes eamed by both institutions of leaming and their staff, and on access, equity, and quality indicators in education at allievels. However, the varying approaches at combating the negative impact of SAP on edu-cation in Nigeria and Zambia suggests that each country has a level of control over the painful effects of adjustment on educational develop-ment. Resolving the traditional trade-offs between quality and quantity as well as between investments in primary and tertiary education re-quires a consideration for the suffering masses during SAP. Neverthe-less, if local evaluation of education under SAP would not be a mere reactive gesture to foreign analyses of the problems, there is need to strengthen the recipient capacity to analyze issues.
Meanwhile, countries undergoing structural adjustment should there-fore identify and compensate losers within their education systems. Such losers include teachers and other staff whose salaries have been eaten up by inflation. Similarly affected are poor children who could not afford the high private costs of education on tuition, additional living expenses, books, uniform, and transport. Such losers also include school drop-outs and graduates who could not get employment as a result of the narrowing labour market. Access victims who could not participate, particularly at the basic level of education owing to supply problems, should also be compensated while libraries, which owing to foreign exchanged and devaluation problems, should be assisted to source foreign materials. Lastly, deliberate efforts should be made by govemments to involve all educational stakeholders in maintaining the quality of education and training provided, if developing countries must continue with SAP.
REFERENCES
Adeyinka, A.A. (1993). Crisis in Nigerian education: Issues at stake. Nigerian Journal of Educational Foundations, 4 (1), 1-17.
Babalola, J.B. (1990). Financial management under structural adjustment prograrns: A case study of Nigeria institutions ofhigher learning. Proceedings, First National Seminar on Budgetary and Financial Management, University of Ibadan, pp. 71-94.
Babalola, J. B. (1994). Women's access to science in higher education in Africa. Annals of the Social Science Council of Nigeria, 6, 68-79.
Education Un der Structural Adjustment
Babalola, J. B. (1996). Economie and social significance of primary education in Nigeria. ln A.D. Ajayi & J.A. Akinwumiju (Eds.), Personnel perfcmnance and c:apacit'y building.
Nigeria: Deparrment of Educational Management, University of Ibadan, 138-146. Babangida, 1. B. (1986). Address to the Nation on various national issues, delivered on Thursday, 26th June.
Bruno, M. (1996). Deep crises and refonn: What have we learned? Washington, OC: The World Bank.
Copple, C. E., & Rota, M. L. (1991). Education and employment research and policy studies annotated bibliography, 1987-1991. Washington, OC: World Bank.
Fdegan, S. B. (1979). Trends in Nigeria's balance ofpaymenrs and policy measures needed for self reliance. In NISER & Federal Ministry of Finance (Eds.), Self reliance and self-sufficiency. Ibadan: Adekanmi Press, 1-35. .
FME/UNICEF. (1993). Basic education statistics and trends in Nigeria. Lagos: Federal Republic of Nigeria.
Fuller, B. (1986). Raising school quality in de!leloping counmes: What in!lestments boost leaming? Washington, OC: The World Bank.
ILO. (1981). Zambia: Basic needs in an ecorwmy under pressure. Geneva: ILO.
Kelly, M. J. (1991). Education in a declining ecorwmy: The case of Zambia, 1975-1985. Washington, OC: The World Bank.
King, E. M., & Hill, M.A. (1993). Women's education inde!lelopingcountries. Washington, OC: The World Bank.
Lungwangwa, G. (1993) The impact of the structural adjustment program on education in
Zambia. Article written while a visiting scholar in the University of Illinois, Urban-Champaign.
Mahmood, S. C. (1995). The social impact of adjustment. In World Bank, Structural and
sectoral adjustment: World Bank experience, 1980-1992. Washington, OC: The World Bank, 173-182.
Nigerian Institute of Social Economie Research (NISER). (1988). Social impact of the structural adjustment program. Ibadan: NISER.
Republic of Zambia. (1996). In!lestment in our people. Draft policy framework on integrated education sector in!lestment.
World Bank. (1988). Targetedprogramfor thepoorduringstructuraiAdjustment: Asummary of a symposium on pooerty and adjustment. Washington, OC: The World Bank. World Bank. (1995). Structural and sectoral adjustment: World Bank Experience, 1988-1992. Washington, OC: The World Bank.
JOEL B. BABALOLA is a senior lecturer of economics of education in the Department of Education Management. University of Ibadan. Nigeria. His research interests include education for development. He is the author of "Education as aided by the World Bank: A critical analysis of post independence projects in Nigeria" in journal of the Third World 5tudies.
GEOFFREY LUNGWANGWA is a senior lecturer of educational policy in the Department of Educational Administration and Policy Studies. University of Zambia. Lusaka. Zambia. His research interests include school improvement and quality assurance in
Baba/o/a, Lungwangwa, & Adeyinka
education. He is currently the Director of Research and Postgraduate Programs in the University of Zambia.
AUGUSTUS A. ADEYINKA is a professor of philosophy of education in the Department of Educational Foundations and Management. University of Swaziland, Kwaluseni, Swaziland. His research interests include curriculum improvement in Africa.
JOEL B. BABAlOlA est chargé de cours principal d'économie de l'éducation au département de gestion de l'éducation à l'Université d'Ibadan, au Nigéria. Il s'intéresse notamment à l'éducation pour le développement. Il est l'auteur de "Education as aided by the World Bank: A critical analysis of post independence projects in Nigeria" paru dans le Journal of the Third World Studies.
GEOFFREY LUNGWANGWA est chargé de cours principal de politiques scolaires au
département d'administration et de politiques scolaires à l'Université de Zambie, à
Lusaka, Zambie. Il s'intéresse notamment à l'amélioration de la scolarisation et à
l'assurance de la qualité dans le domaine de l'éducation. Il est actuellement directeur de recherche et des programmes de 2e et 3e cycles à l'Université de Zambie.
AUGUSTUS A. ADEYINKA est professeur de philosophie de l'éducation au département des fondements et de la gestion de l'éducation à l'Université du Swaziland, Kwaluseni, Swaziland. Il s'intéresse notamment à l'amélioration des programmes d'études en Afrique.