Dependency structure matrix modelling
for stakeholder value networks
The MIT Faculty has made this article openly available.
Please share
how this access benefits you. Your story matters.
Citation
Wen Feng; Edward F. Crawley; Olivier de Weck; Rene Keller; Bob
Robinson. :Dependency structure matrix modelling for stakeholder
value networks". Proceedings of the 12th International DSM
Conference, Cambridge, UK, 22.-23.07. 3-16. DSM 2010.
As Published
http://www.designsociety.org/publication/30353/
dependency_structure_matrix_modelling_for_stakeholder_valuenetworks
Publisher
Design Society
Version
Author's final manuscript
Citable link
http://hdl.handle.net/1721.1/81156
Terms of Use
Creative Commons Attribution-Noncommercial-Share Alike 3.0
Detailed Terms
http://creativecommons.org/licenses/by-nc-sa/3.0/
12TH INTERNATIONAL DEPENDENCY AND STRUCTURE MODELLING CONFERENCE, DSM’10
22 – 23 JULY 2010, CAMBRIDGE, UK
DEPENDENCY STRUCTURE MATRIX MODELLING
FOR STAKEHOLDER VALUE NETWORKS
Wen Feng1, Edward F. Crawley1, Olivier de Weck1, Rene Keller2 and Bob Robinson2
1Massachusetts Institute of Technology, MA, USA 2BP Exploration Operating Company Ltd., Sunbury, UK
Keywords: dependency structure matrix, stakeholder network, value exchange 1 INTRODUCTION
During the past three decades, the concept of “stakeholders” has been deeply embedded in the thinking and practice of management scholars (Freeman, 1984) as well as the architects for large-scale engineering systems (Moses, 2004), in order to ensure an organization’s “long-term success”. However, most current stakeholder models only examine the direct relationships between the focal organization and its immediate stakeholders (a.k.a., “hub-and-spoke” models), ignoring the indirect relationships that include the interactions between other stakeholders in the network (Rowley, 1997; Mahon et al., 2003; Lucea, 2007). However, arguably these indirect relationships are very important for the focal organization to appropriately estimate the power of its stakeholders and grasp the opportunity to influence stakeholders in an indirect manner.
This paper develops a qualitative/quantitative network approach, namely a “Stakeholder Value Network” (Cameron, 2007; Feng and Crawley, 2008; Sutherland, 2009), to understand the impacts of both direct and indirect relationships between stakeholders on the success of large engineering projects. Specifically, this paper explores the feasibility and benefit of applying the Dependency Structure Matrix (DSM) as the modelling platform for Stakeholder Value Networks. Further, an efficient algorithm is designed for computing indirect stakeholder influence and implemented in a case study for a multinational energy project. The results derived from this analysis are able to answer three fundamental questions for stakeholder management: What are the critical paths/themes for a project to engage other stakeholders? Who are the most important stakeholders for a project? How can the complexity of a large relationship network be reasonably managed?
2 STAKEHOLDER VALUE NETWORK
A stakeholder in an organization (corporation, government, project, etc.) is “any group or individual
who can affect or is affected by the achievement of the organization’s objectives” (Freeman, 1984),
and the Stakeholder Value Network is “a multi-relation network consisting of a focal organization,
focal organization’s stakeholders, and the tangible and intangible value exchanges between the focal organization and its stakeholders, as well as between the stakeholders themselves” (Feng and
Crawley, 2008).
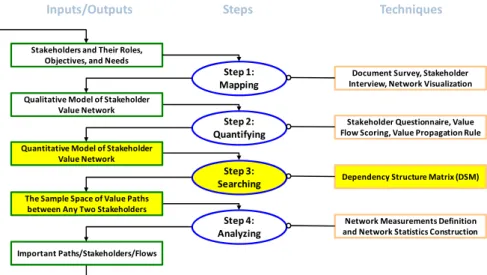
In order to understand the impacts of both direct and indirect relationships between stakeholders (including the focal organization), this paper proposes the use of the Stakeholder Value Network as a way of modelling stakeholder relationships which consists of four steps (see Figure 1):
− Mapping: At the beginning, stakeholders have to be identified and their roles, objectives, and
needs are also collected from documents/interviews. Based on this information, the qualitative model of the Stakeholder Value Network can be built, in the format of stakeholder maps, through mapping the specific needs of each stakeholder as value flows (i.e., directed value exchanges).
− Quantifying: Once the stakeholder maps are obtained, the next step is to score value flows with
the perceived utility of the recipient stakeholder and define the value propagation rule to build the quantitative model. Generally a multiplicative rule will be used to calculate the score of a value path (i.e., a string of value flows connecting a group of stakeholders): the path score equals the product of the scores of all the value flows along that path. This is because under the
multiplicative rule (and the normalized value flow scores), longer paths tend to have lower scores, which reflects the difficulty to engage/manage stakeholders along these longer paths.
− Searching: Based on the quantified value flows and the multiplicative rule for value
propagation, a quantitative model of a Stakeholder Value Network can be built, to search for all value paths between any two stakeholders.
− Analyzing: Once the quantitative model finds all the value paths between any two stakeholders,
the last step is to define network measurements and construct network statistics. Specifically, the value paths beginning from and ending with the same stakeholder will be taken as the sample space to study the implications of the Stakeholder Value Network for that stakeholder.
Inputs/Outputs Steps Techniques
Step 1: Mapping Step 2: Quantifying Step 3: Searching Step 4: Analyzing
Stakeholders and Their Roles, Objectives, and Needs
Qualitative Model of Stakeholder Value Network
Document Survey, Stakeholder Interview, Network Visualization
Quantitative Model of Stakeholder Value Network
Stakeholder Questionnaire, Value Flow Scoring, Value Propagation Rule
The Sample Space of Value Paths between Any Two Stakeholders
Dependency Structure Matrix (DSM)
Important Paths/Stakeholders/Flows
Network Measurements Definition and Network Statistics Construction
Figure 1. Four steps of stakeholder value network analysis
The focus of the remainder of this paper will be on the third step: applying the Dependency Structure Matrix (DSM) as the modelling platform to search for all value paths between any two stakeholders. The details of other three steps have been extensively discussed in previous literature (Cameron, 2007; Sutherland, 2009).
3 DEPENDENCY STRUCTURE MATRIX MODELLING
Based on the above discussion, value paths are the key to understanding the implications of a Stakeholder Value Network, and essentially, these paths represent the direct/indirect dependencies between stakeholders. The Dependency Structure Matrix (DSM) is a simple but powerful tool to model, visualize, and analyze the dependencies among system entities. Originated from the field of product management (Ulrich and Eppinger, 2003), DSM has been widely applied to manage the complexity of any system, including the modelling for indirect dependencies and dependency propagation (Keller, 2007; Lindemann et al., 2008).
The next section explores the representation, algorithm, and benefit of DSM modelling for the Stakeholder Value Network analysis. For the convenience of further discussion, this paper uses the Stakeholder Value Network shown in Figure 2 as a simplified example, where a, b, c, d, e, f, g, and h are eight value flows between four stakeholders A, B, C, and D. From the perspective of graph theory, the Stakeholder Value Network defined above belongs to the class of (weighted) multidigraphs, i.e., a directed graph that is permitted to have multiple directed edges with the same source and target vertices. And the sample network in Figure 2 is exactly a simple but typical multidigraph.
A B C D a c b e d f g h
3.1 Representation
Simple graphs (i.e., no more than one edge between any pair of vertices) can be easily represented with DSM: all the vertices are numbered as rows and columns of a matrix, and the elements (0 or 1) in the matrix show whether there is a directed edge from row vertex to column vertex. However, in order to represent the multidigraphs, two modifications need to be made for traditional DSM: First, defining the matrix elements as characters to name edges (or as 0 if there is no edge); second, using the “addition” operation to connect the names of multiple edges with the same source and target vertices. And therefore, the example network shown in Figure 2 can be represented with the following DSM:
For example, the element (4, 1) in M is “g + h”, which means there are two directed edges (value flows) “g” and “h” from Vertex “4” to “1” (or, from Stakeholder “D” to “A”), in Figure 2. Note that all the elements (i, i) in M must be zero, because an edge that connects a vertex to itself is not allowed, in the Stakeholder Value Network and also for most graphs in graph theory.
3.2 Algorithm
Multiplying M by itself once (ordinary matrix product), the resulting new DSM will be:
By observation, it can be concluded that the element (i, j) in the new DSM represents all the paths (value paths) from Vertex (Stakeholder) “i “to “j” with path length equal to 2. Especially, the elements (i, i) in the new matrix may not be zero, because now they represent all the value paths (i.e., value loops/cycles) beginning from and ending with the same stakeholder.
This observation can be generalized to k times (k ≤ total number of vertices, see explanation below) multiplication of the DSM. For example, when k = 3, the corresponding DSM will be:
M3=
abg+ abh + cdg + cdh aef cfe cfb+ aed
edg+ edh bga+ bha bgc+ bhc + efe efb fbg+ fbh dga+ dha + fef dgc+ dhc fed
0 gcf + hcf gae+ hae gab+ hab + gcd+ hcd ⎡ ⎣ ⎢ ⎢ ⎢ ⎢ ⎢ ⎤ ⎦ ⎥ ⎥ ⎥ ⎥ ⎥ Therefore the DSM multiplication can be applied as the basic algorithm for modelling the value propagation in the Stakeholder Value Network, which in fact is to search and compute all the value paths between any two vertices. In addition, considering the specific requirements of Stakeholder Value Network analysis, this paper has designed the following important features in the algorithm: “Simple Path Only”, “Connection Constraints”, “Path Score Calculation”, and “All the Value Paths”.
3.2.1 Simple path only
For simplicity, the Stakeholder Value Network approach does not differentiate between the various times to engage a specific stakeholder along one value path. That is, no stakeholder, except the start/end one, will be visited more than once in every value path. Therefore the searching algorithm should only keep the simple paths (i.e., paths with no repeated vertices) and filter out the non-simple ones (see the circled elements in M3 for example). This “Simple Path” requirement can be met by satisfying the condition that no vertex in the path has input/output degrees (i.e., the number of edges incident to that vertex) greater than 2, when connecting two paths/edges. And this requirement also explains for “k ≤ total number of vertices”, because the longest length of simple paths in a multidigraph equals the total number of vertices (stakeholders).
M = 0 a c 0 0 0 e b 0 f 0 d g+ h 0 0 0 ⎡ ⎣ ⎢ ⎢ ⎢ ⎢ ⎢ ⎤ ⎦ ⎥ ⎥ ⎥ ⎥ ⎥ M2= 0 cf ae ab+ cd bg+ bh ef 0 ed dg+ dh 0 fe fb 0 ga+ ha gc + hc 0 ⎡ ⎣ ⎢ ⎢ ⎢ ⎢ ⎢ ⎤ ⎦ ⎥ ⎥ ⎥ ⎥ ⎥
3.2.2 Connection constraints
To make sure the connection between value flows is meaningful, appropriate constraints between each stakeholder’s input flows and output flows should be satisfied. The algorithm reads the connection constraints as the initial inputs, in the format of listing the connectable outputs for a specific input. And then, the algorithm does the “Edge Constraint Check” during each time when two paths P1 and P2 are to be connected: The last edge from P1 is checked against the first edge from P2 to make sure that they are connectable. To fulfil this, the algorithm maintains a Hash Map to record all the connectable information. If the paths (edges) are not connectable, the new path will be dropped.
3.2.3 Path score calculation
The algorithm reads the value flows and their scores together as the initial inputs. And then, the computation for path score will be finished in parallel with the generation of that path by multiplying the DSM. In addition, to improve the computational efficiency, all the previous paths and their scores will be stored so that the score for a new path can be obtained from the score of two old paths/edges constituting that new path.
3.2.4 All the value paths
The k-length value paths for a focal stakeholder “i” will be represented by the element (i, i) in the DSM after k-time multiplication (k ≤ total number of stakeholders). To obtain all the value paths for that stakeholder, the algorithm will add the element (i, i) together, from the initial DSM representing the network itself to the DSM after k-time multiplication (k = total number of stakeholders).
In summary, the Stakeholder Value Network approach takes the weighted simple paths as the basic units to measure both the “exchange” and “structure” impacts of the whole multi-relation network on each stakeholder (the corresponding network measurements are defined in the following case study). And the third step of this approach (see Figure 1) is actually to search, store, and compute all the simple paths between any two vertices (stakeholders).
3.3 Benefit
After running numerous and rigorous tests for the above DSM multiplication algorithm, this paper confirms three major benefits of the DSM modelling for Stakeholder Value Network:
− Computational Performance: Although the full space path searching is a NP-hard problem by nature (Hochbuam, 2008), the DSM multiplication algorithm is still efficient for most Stakeholder Value Networks, especially after adopting specific techniques such as the Hash Map to optimize the usage of computer memory during calculation.
− All-at-Once: After k-time multiplication of the initial DSM (k = total number of stakeholders), all the value paths between any two stakeholders will be obtained simultaneously, and this feature associated with matrix operations brings lots of flexibility and convenience for network analysis. − Significant Implication: First, for those diagonal elements in the resulting DSM, each diagonal
element represents the sample space for a focal stakeholder, which can be used to interpret the implications of the network for that focal one, while all the diagonal elements represent the sample space which can be used to interpret the implications of the whole multi-relation network. Second, for those off-diagonal elements in the resulting DSM, Element (m, n) represents the influence (i.e., value paths) from Stakeholder m to Stakeholder n, and further Element (m, n) and Element (n, m) represent the relationship balance (i.e., value exchanges) between Stakeholder m and Stakeholder n. These features can also be explained with the previous example (non-simple paths have been filtered out):
M3=
abg+ abh + cdg + cdh 0 0 cfb+ aed
edg+ edh bga+ bha bgc + bhc 0
fbg+ fbh dga+ dha dgc + dhc 0
0 gcf + hcf gae+ hae gab + hab + gcd+ hcd ⎡ ⎣ ⎢ ⎢ ⎢ ⎢ ⎢ ⎤ ⎦ ⎥ ⎥ ⎥ ⎥ ⎥
4 CASE STUDY: A MULTINATIONAL ENERGY PROJECT
Next, this paper describes the application of the four major steps of the Stakeholder Value Network approach and the DSM multiplication algorithm to analyze the stakeholder relationships in a
multinational energy project: Enterprise is a large multinational with expertise in the exploration and production of fossil energy and has recently secured the rights to a significant reservoir in a foreign country by creating a multi-billion joint venture (i.e., Project) with a local firm (i.e., Host-Country Corporation). While the Project will be technically challenging, there are early indications that the complexity of the external relations, in both market and nonmarket environment, will pose the most significant risk. This is the reason why this case is especially interesting for researchers and project managers to conduct the Stakeholder Value Network analysis, in order to fully understand the impacts of the network-level interactions between stakeholders on the success of this Project, which will be taken as the focal organization here.
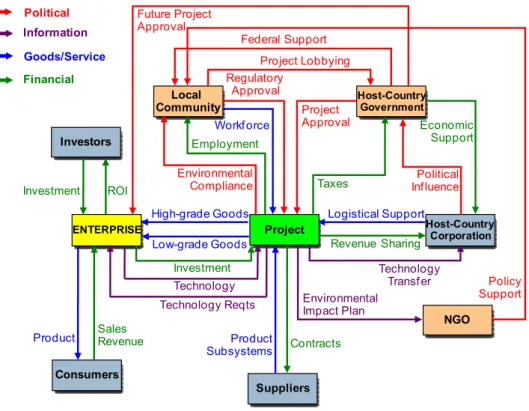
Project Investors Consumers ENTERPRISE Sales Revenue Product Suppliers Product Subsystems Contracts Future Project Approval Host-Country Corporation Logistical Support Revenue Sharing Local Community Employment Workforce NGO Environmental Impact Plan Environmental Compliance Economic Support Political Influence Policy Support Project Lobbying Federal Support ROI Investment Host-Country Government Regulatory Approval Project Approval Taxes Political Information Goods/Service Financial Investment High-grade Goods Low-grade Goods Technology Transfer Technology Reqts Technology
Figure 3. Stakeholder map for a multinational energy project
After document survey and stakeholder interviews, the resulting stakeholder map (qualitative model) is shown in Figure 3, which consists of 9 stakeholders and 27 value flows (Note that this model is quite small and generic, only for the purpose of demonstration). Specifically, there are four types of value flows (Political, Information, Goods/Services, and Financial), and stakeholders in the market environment (Enterprise, Investors, Consumers, Suppliers, and Host-Country Corporation) as well as in the nonmarket environment (Host-Country Government, Local Community, and NGO) have been coded with different colours. Based on this map and the value flow scores from the stakeholder questionnaire, the quantitative model of this Stakeholder Value Network is then built. Finally, through implementing the DSM multiplication algorithm, all the 43 value paths beginning from the Project and ending with the Project are found and will be taken as the sample space for network statistical analysis. This paper mainly introduces the following three results from the analysis:
4.1 Critical paths
The first result is a list of critical paths for Project to engage its stakeholders, which are ranked by the path scores. Especially, Figure 4 highlights the top six paths with the length longer than two steps. These indirect paths are very useful for Project to formulate high-leverage strategies when it’s difficult to engage a stakeholder directly. For example, in the first path, Project gets the “Regulatory Approval” from Local Community, through the influence of “Federal Support” from Host-Country Government, by turning over “Taxes” to Host-Country Government. In fact, project managers have confirmed the significance of these paths with real experience, but without the Stakeholder Value Network analysis, there is no a rigorous way to quickly identify these valuable indirect paths, especially when the size of the network becomes large. An interesting observation here is that these indirect paths are mostly intermediated by stakeholders in the nonmarket environment, and political flows are the dominating value flow type.
Project Host-CountryGovernment CommunityLocal Taxes Project Regulatory Approval Score = 0.40 Federal Support
Project Host-CountryGovernment Enterprise
Taxes Project Investment Score = 0.16 Future Project Approval
Project Host-CountryCorporation Host-CountryGovernment
Revenue Sharing Project Project Approval Score = 0.16 Political Influence
Project CommunityLocal Host-CountryGovernment
Employment
Project Score = 0.16
Project NGO CommunityLocal
Environmental Impact Plan Project Regulatory Approval Score = 0.16 Policy Support
Project Host-CountryCorporation Host-CountryGovernment
Revenue Sharing Local Community Federal Support Political Influence Project Approval Project Lobbying Project Regulatory Approval Score = 0.16
Figure 4. Project’s top six indirect paths
4.2 Important stakeholders
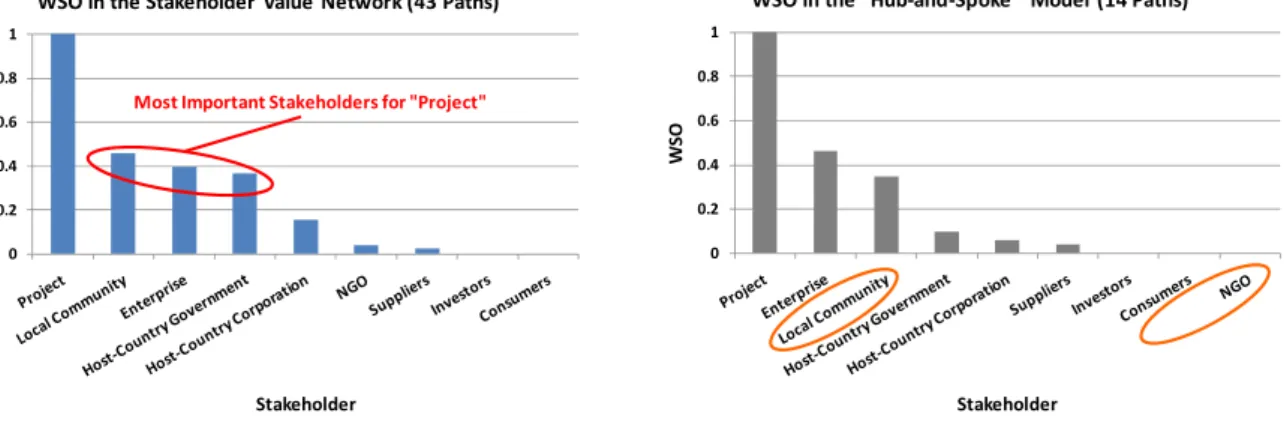
This paper defines the Weighted Stakeholder Occurrence (WSO) as the measurement for the importance of stakeholders:
WSO can be interpreted as the relative importance of stakeholders for the Project, because a stakeholder with a higher WSO will have more effect on turning Project’s outputs into good inputs, through more possible value paths. From this analysis (see Figure 5), the most important stakeholders for the Project are Local Community, Enterprise, and Host-Country Government. Based on this result, Managers for the Project should give higher priority and pay more attention to these stakeholders when making strategic decisions.
For the purpose of comparison, Figure 5 also gives the WSO calculated in the traditional “Hub-and-Spoke” model, where only the direct relationships between the focal organization (Project) and its immediate stakeholders are examined. It can be clearly observed that the ranking of stakeholders’ relative importance changes by taking the indirect relationships into account, especially for Local Community and NGO. And once again, the higher importance of Local Community and NGO reflected in the Stakeholder Value Network model has been confirmed by project managers and historical facts. 0 0.2 0.4 0.6 0.8 1 WSO Stakeholder
WSO in the Stakeholder Value Network (43 Paths)
Most Important Stakeholders for "Project"
0 0.2 0.4 0.6 0.8 1 WS O Stakeholder
WSO in the "Hub-and-Spoke" Model (14 Paths)
4.3 Reduced complexity
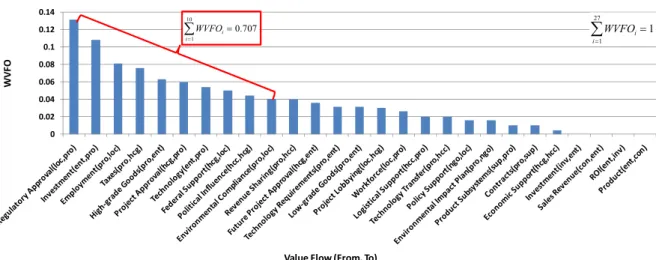
This paper also defines another network measurement Weighted Value Flow Occurrence (WVFO), which identifies the relative importance of each individual value flow:
From Figure 6, it is observed that the weight of less than half the value flows (10 out of 27) is already more than 70% of the total weight. This is an important observation as those top ten value flows, together with the important stakeholders having high WSO, can be used to construct an even smaller network. Within that smaller stakeholder network model, which will only focus on the most important stakeholders and value flows, more computational/analytical resources will be available to include more details for the internal structure of stakeholders as well as the value exchanges between them, and could be the basis for more fine-grained decisions.
0 0.02 0.04 0.06 0.08 0.1 0.12 0.14 WVF O
Value Flow (From, To)
WVFO in the Stakeholder Value Network
WVFOi i=1 10 ∑ = 0.707 WVFOi i=1 27 ∑ = 1
Figure 6. WVFO in the stakeholder value network
5 CONCLUSIONS
In order to fully understand the impacts of both direct and indirect relationships between stakeholders on the success of large engineering projects, this paper develops an innovative network approach, namely the “Stakeholder Value Network”, which applies the Dependency Structure Matrix (DSM) as the modelling platform. This paper also introduces an efficient modelling algorithm to implement a way to effectively calculate indirect stakeholder influence in a Stakeholder Value Network as against a more traditional “hub-and-spoke” analysis. The usefulness of this approach and the corresponding DSM modelling algorithm are then demonstrated by a case study with improved understanding of relationship management through the following features:
− Prioritisation of critical networks which have the likelihood of having greatest impact on a
project;
− Prioritisation of critical relationships to be managed based on the strength of these networks; − Prioritisation of critical value flows within the networks.
In conclusion a DSM based approach to relationship management and the supporting analytical techniques offer a significant improvement in the way a project can plan and manage external relationships.
REFERENCES
Cameron, B. G. (2007). Value Network Modeling: A Quantitative Method for Comparing Benefit across Exploration Architectures. Master’s Thesis, Engineering Systems Division. Cambridge, MA: Massachusetts Institute of Technology.
Feng, W. & Crawley, E. F. (2008). Stakeholder Value Network Analysis for Large Oil and Gas Projects. Research Report, Engineering Systems Division. Cambridge, MA: Massachusetts
Institute of Technology.
Freeman, R. E. (1984). Strategic Management: A Stakeholder Approach. Boston: Pitman. Hochbuam, D. (2008). Graph Algorithms and Network Flows. IEOR 266 Notes, UC Berkeley.
Keller, R. (2007). Predicting Change Propagation: Algorithms, Representations, Software Tools. PhD Thesis, Wolfson College. Cambridge University Engineering Department, United Kingdom. Lindemann, U., Maurer, M., et al. (2008). Deduction of Indirect Dependencies, in Structural
Complexity Management. Berlin/Heidelberg: Springer.
Lucea, R. (2007). Cross-Boarder Non-Market Environments; a multi-relational approach (in Essays on Global Non-Market Strategy). PhD Thesis, Sloan School of Management. Cambridge, MA: Massachusetts Institute of Technology.
Mahon, J. F., Heugens, P. P. M. A. R., et al. (2003). Social Networks and Non-Market Strategy.
Journal of Public Affairs 4(2), 170-189.
Moses, J. (2004). Foundational Issues in Engineering Systems: A Framing Paper. Engineering Systems
Monograph. Cambridge, MA: Massachusetts Institute of Technology.
Rowley, T. J. (1997). Moving beyond Dyadic Ties: A Network Theory of Stakeholder Influences.
Academy of Management Review 22(4), 887-910.
Sutherland, T. A. (2009). Stakeholder Value Network Analysis for Space-Based Earth Observation. Master’s Thesis, Engineering Systems Division. Cambridge, MA: Massachusetts Institute of Technology.
Ulrich, K. T. & Eppinger, S. D. (2003). Product Design and Development (Third Edition). Boston: McGraw-Hill/Irwin.
Contact: Wen Feng
Massachusetts Institute of Technology Engineering Systems Division 550 Memorial Drive, Apt. 22E-2 Cambridge, MA 02139
USA
Phone: 1-617-309-8989 Fax: 1-617-324-6910 Email: [email protected]
BY MODELLING DEPENDENCIES MANAGING COMPLEXITY
Dependency Structure Matrix Modelling
Dependency Structure Matrix Modelling
for Stakeholder Value Networks
Wen Feng1, Edward F. Crawley1, Olivier de Weck1
Rene Keller2and Bob Robinson2 1Massachusetts Institute of Technologyassac usetts st tute o ec o ogy 2BP Exploration Operating Company Ltd.
BY MODELLING DEPENDENCIES MANAGING COMPLEXITY
OUTLINE
OUTLINE
• Stakeholder Value Network (SVN) Analysis
• Dependency Structure Matrix (DSM) Modelling for SVN • Dependency Structure Matrix (DSM) Modelling for SVN • Case Study: A Multinational Energy Project
• Conclusions and Future Work
BY MODELLING DEPENDENCIES MANAGING COMPLEXITY
SVN Analysis: Problem Statement
SVN Analysis: Problem Statement
• Traditional Stakeholder Model: Only
examining the direct relationships Traditional Stakeholder Model
between the focal organization and its stakeholders (Rowley, 1997).
• Stakeholder Value Network (SVN): “A
multi-relation network consisting of a multi-relation network consisting of a focal organization, focal organization’s stakeholders, and the tangible and intangible value exchanges between the
f l i ti d it t k h ld
Stakeholder Value Network
focal organization and its stakeholders, as well as between the stakeholders themselves” (Feng and Crawley, 2008).
• Why SVN Analysis: Understanding the y y g impact of both direct and indirect relationships between stakeholders on the success of large engineering projects and Applying such an projects, and Applying such an understanding to inform decisions on stakeholder management strategies in a positive way and with reduced
complexity
12th International DSM Conference 2010- 3 complexity.
BY MODELLING DEPENDENCIES MANAGING COMPLEXITY
SVN Analysis: Methodology
SVN Analysis: Methodology
BY MODELLING DEPENDENCIES MANAGING COMPLEXITY
DSM Modelling for SVN: Representation
DSM Modelling for SVN: Representation
• SVN: (Weighted) Multidigraph, i e a directed graph that is i.e., a directed graph that is permitted to have multiple directed edges with the same
source and target vertices.g
• DSM Representation for SVN:
- First, defining the matrix
elements as characters to elements as characters to name edges (or as 0 if there is no edge);
Second using the “addition”
- Second, using the addition
operation to connect the names of multiple edges with the same source and with the same source and target vertices.
12th International DSM Conference 2010- 5
BY MODELLING DEPENDENCIES MANAGING COMPLEXITY
DSM Modelling for SVN: Algorithm
DSM Modelling for SVN: Algorithm
• Matrix Multiplication: After K times multiplication of the initial times multiplication of the initial DSM, the matrix element (m, n) represents all the K-length
directed paths from stakeholder p
m to stakeholder n (m=n: value loops beginning from and ending
with the same stakeholder).)
BY MODELLING DEPENDENCIES MANAGING COMPLEXITY
DSM Modelling for SVN: Requirements
DSM Modelling for SVN: Requirements
• Simple Path Only: The algorithm should only keep the simple paths (i.e., paths with no repeated vertices) because for simplicity the current SVN paths with no repeated vertices), because for simplicity the current SVN methodology doesn’t differentiate between the various times to engage a specific stakeholder along one value path.
• Connection Constraints: The algorithm should do the “Edge ConstraintConnection Constraints: The algorithm should do the Edge Constraint Check” whenever two paths P1 and P2 are to be connected, because there are logic constraints between the input and output value flows of each stakeholder.
each stakeholder.
• Path Score Calculation: The computation for path score should be finished in parallel with the generation of that path by multiplying the DSM because path scores will be used to rank all the value paths and DSM, because path scores will be used to rank all the value paths and further calculate the defined network measurements.
• All the Value Paths: The algorithm should add the element (i, i) together, from the initial DSM representing the network itself to the DSM after from the initial DSM representing the network itself to the DSM after K-time multiplication (K = total number of stakeholders), because all the value paths for a specific stakeholder (i) will be taken as the sample space to interpret the implications of the network for that stakeholder.
12th International DSM Conference 2010- 7 space to interpret the implications of the network for that stakeholder.
BY MODELLING DEPENDENCIES MANAGING COMPLEXITY
DSM Modelling for SVN: Benefits and Implications
DSM Modelling for SVN: Benefits and Implications
• Benefits:
– Computational Performance: The DSM multiplication algorithm is efficient forComputational Performance: The DSM multiplication algorithm is efficient for most SVN;
– All-at-Once: After K-time multiplication (K = total number of stakeholders), all the value paths between any two stakeholders will be obtained
simultaneously. • Implications:
– Diagonal Elements: each diagonal element can be used to interpret the implications of the network for that focal one, while all the diagonal elements can be used to interpret the implications of the whole multi-relation network; – Off-Diagonal Elements: Element (m, n) represents the influence from
Stakeholder m to Stakeholder n while Element (m n) and Element (n m) Stakeholder m to Stakeholder n, while Element (m, n) and Element (n, m) represent the relationship balance between Stakeholder m and Stakeholder n.
BY MODELLING DEPENDENCIES MANAGING COMPLEXITY
Case Study: A Multinational Energy Project
Case Study: A Multinational Energy Project
Future Project Approval Federal Support Political Local Community Economic Project Lobbying Host-Country Government Regulatory Approval Information Goods/Service Financial Investors Employment Workforce Environmental Support Political Project Approval Taxes Project
Enterprise Host-Country Corporation
Logistical Support Revenue Sharing Compliance Influence ROI Investment High-grade Goods
Low-grade Goods Revenue Sharing
Environmental I t Pl Investment Low-grade Goods Technology Transfer Technology Requirements Technology Consumers Sales Revenue Product Suppliers Product Subsystems Contracts NGO Impact Plan Policy Support 12th International DSM Conference 2010- 9
BY MODELLING DEPENDENCIES MANAGING COMPLEXITY
Key Result: Critical Paths for “Project”
Key Result: Critical Paths for Project
BY MODELLING DEPENDENCIES MANAGING COMPLEXITY
Key Result: Important Stakeholders and Value Flows
Key Result: Important Stakeholders and Value Flows
12th International DSM Conference 2010- 11
BY MODELLING DEPENDENCIES MANAGING COMPLEXITY
Conclusions and Future Work
Conclusions and Future Work
• Conclusions: A DSM based approach to relationship management and the supporting analytical techniques offer a significant improvement in the way a pp g y q g p y project can plan and manage external relationships.
– Prioritisation of critical networks which have the likelihood of having greatest impact on a project;
– Prioritisation of critical relationships to be managed based on the strength of these networks;
– Prioritisation of critical value flows within the networks. • Future Work:
– Theoretical Foundation: Development of a solid mathematical model for value creation and propagation in the network, such as including the description for stakeholder’s decision behavior or using different operations to calculate the stakeholder s decision behavior, or using different operations to calculate the benefits and costs to manage a value path;
– Organizational Application: Exploration on the alignment of organizational structure for better stakeholder management, by integrating Stakeholder Value structure for better stakeholder management, by integrating Stakeholder Value Network with Strategic Issues;
– Technological Application: Exploration on the interaction between technology decisions and stakeholder relationships, by integrating Stakeholder Value
12th International DSM Conference 2010- 12