HAL Id: hal-00296857
https://hal.archives-ouvertes.fr/hal-00296857
Submitted on 16 Dec 2005
HAL is a multi-disciplinary open access
archive for the deposit and dissemination of
sci-entific research documents, whether they are
pub-lished or not. The documents may come from
teaching and research institutions in France or
abroad, or from public or private research centers.
L’archive ouverte pluridisciplinaire HAL, est
destinée au dépôt et à la diffusion de documents
scientifiques de niveau recherche, publiés ou non,
émanant des établissements d’enseignement et de
recherche français ou étrangers, des laboratoires
publics ou privés.
Application of a virtual watershed in academic education
A. L. Horn, G. Hörmann, N. Fohrer
To cite this version:
A. L. Horn, G. Hörmann, N. Fohrer. Application of a virtual watershed in academic education.
Advances in Geosciences, European Geosciences Union, 2005, 5, pp.137-141. �hal-00296857�
Advances in Geosciences, 5, 137–141, 2005 SRef-ID: 1680-7359/adgeo/2005-5-137 European Geosciences Union
© 2005 Author(s). This work is licensed under a Creative Commons License.
Advances in
Geosciences
Application of a virtual watershed in academic education
A. L. Horn, G. H¨ormann, and N. Fohrer
Ecology Centre, Department of Hydrology and Water Resources Management, Christian-Albrechts-University, Kiel, Germany Received: 7 January 2005 – Revised: 1 August 2005 – Accepted: 1 September 2005 – Published: 16 December 2005
Abstract. Hydrologic models of watersheds often represent
complex systems which are difficult to understand regarding to their structure and dynamics. Virtual watersheds, i.e. wa-tersheds which exist only in the virtual reality of a computer system, are an approach to simplify access to this real-world complexity. In this study we present the virtual watershed KIELSHED-1, a 117 km2v-shaped valley with grassland on a “Cambisol” soil type. Two weather scenarios are delivered with the watershed: a simplified artificial weather scenario based on long-term data of a German weather station as well as an unmodified data record. The input data and parameters are compiled according to the conventions of the SWAT 2000 hydrological model. KIELSHED-1 is mainly used for edu-cation, and illustrative application examples, i.e. calculation of water balance, model calibration, development of land use scenarios, give an insight to the capabilities of the virtual wa-tershed.
1 Introduction
Eco-hydrological models (e.g. SWAT – Arnold et al., 1998; HSPF – Johanson et al., 1980; Bicknell et al., 2001) are of-ten structured as complex systems including a multitude of compartments and dynamic processes. This complexity is considered necessary to give a realistic approach to the envi-ronment, i.e. to represent main components as well as trans-port and transformation processes. On the other hand, the model complexity can hamper understanding of system be-haviour considerably. Therefore it is a common approach to investigate models under simplified conditions. Virtual wa-tersheds, i.e. watersheds which exist only in the virtual real-ity of a computer system, are an excellent tool for this pur-pose as the user can define their complexity according to his requirements. Consequently, virtual watersheds have been used frequently in research to investigate model behaviour.
Correspondence to: A. L. Horn
(ahorn@hydrology.uni-kiel.de)
For example, Miller (1995) applied a virtual watershed of 10 km×10 km with a spatial resolution of either 1 km or 2 km to analyse sensitivity of surface heat and moisture fluxes due to topographic slope and azimuth. Smith and Eli (1995) used a virtual watershed of 5×5 grid cells including a drainage pattern to test neural-network models of rainfall-runoff pro-cesses. Szilagyi et al. (1998) tested an aquifer parameter es-timation approach in a rectangularly shaped aquifer as well as in a more complex virtual watershed of irregular shape. Recently, Lenhart et al. (2002) investigated parameter sensi-tivity of the SWAT model in a virtual watershed presented earlier by Eckhardt et al. (1999).
In the context of literature review it is remarkable that there is no consistent notation of virtual watersheds as they are defined in this study. Miller (1995), Smith and Eli (1995) and Szilagyi et al. (1998) refer to synthetic watersheds while Lenhart et al. (2002) uses the term “artificial watershed”. In both cases the notation might lead to ambiguity as the def-initions also hold true for watersheds constructed by man and existing in reality in this way. However, even the vir-tual watershed definition considered in this study is not clear of ambiguity. The term is used frequently to address real-time online information about natural watersheds available in the internet (e.g. http://www.sevierriver.org, date of ac-cess: 17 December 2004). Further some scientists defined a method of rainfall-runoff prediction by neural-networks as a (semi)virtual watershed model due to its minor requirements of information about the natural watershed (Carriere et al., 1996; Guo, 2001). Despite of these ambiguities we think that the virtual watershed definition used in this study is most ap-propriate to stress that such watersheds exist solely in virtual reality.
Virtual watersheds are also a useful approach in educa-tion. The application of eco-hydrological models by stu-dents is the standard case of the confrontation of inexperi-enced users with a complex system. It should therefore be the primary aim of the instructor to devise this first con-tact as simple as possible. Virtual watersheds help for this purpose. In this study we present the set up of a virtual
138 A. L. Horn et al.: Application of a virtual watershed in academic education The virtual watershed KIELSHED-1 covers an area of 117 km2 at a spatial resolution of 50 m
x 50 m. It is a v-shaped valley with a longitudinal inclination along the river of 0.01 m m-1 and a transverse inclination along the slopes of 0.02 m m-1 (Fig. 1). The soil is a Cambisol
with a depth of 2 m, the texture is classified as loamy sand (80% sand, 15% silt, 5% clay). The bulk density of the soil was set to 1.5 g cm-3, the saturated hydraulic conductivity to 30
mm hr-1. Land use of the area is perennial grassland. The grass is cut on 15th May, 30th June
and 30th August and it is fertilised on 7th March, 22nd May and 7th July. The cutting cycle and
fertilizer application rates (125 kg/ha N, 6.5 kg/ha P for the first and second application, 100 kg/ha N, 5.2 kg/ha P for the third application) indicate an intensive land use system.
Fig. 1: Three-dimensional view of the virtual watershed KIELSHED-1 (scale: meters) Two weather scenarios have been prepared for KIELSHED-1. In the first scenario artificial weather conditions were established by compiling daily weather records (i.e. precipitation, air temperature, wind speed, solar radiation, relative humidity) from 01st Jan 1957 to 31st
December 1980 of the Flensburg weather station (northern Germany, near the border to Denmark) of the German National Meteorological Service. The data were modified such that long-term monthly averages were calculated and the results were resampled to daily resolution. This procedure allowed for definition of identical weather conditions in each year. In the second scenario daily weather records from 01st January 1989 to 28th February 2002 of
a station of the Ecology Centre Kiel were used. Data were not modified such that real weather conditions are provided for the model.
All watershed characteristics and input data are defined in the SWAT 2000 input file format. The current version of the KIELSHED-1 configuration can be downloaded from http://www.hydrology.uni-kiel.de/swat.
Fig. 1. Three-dimensional view of the virtual watershed KIELSHED-1 (scale: meters).
watershed (KIELSHED-1) used for academic education in the department’s training courses with the eco-hydrological model SWAT (Arnold et al., 1998). Further we will give some examples on student’s model application in the water-shed.
2 Virtual watershed set up
The watershed characteristics were approximated to a land-scape formed from Pleistocene deposits as can be found in the surrounding of Kiel University and large parts of northern Germany which were ice-covered during Weichselian glacia-tion.
The virtual watershed KIELSHED-1 covers an area of 117 km2 at a spatial resolution of 50 m×50 m. It is a v-shaped valley with a longitudinal inclination along the river of 0.01 m m−1and a transverse inclination along the slopes of 0.02 m m−1 (Fig. 1). The soil is a Cambisol with a depth of 2 m, the texture is classified as loamy sand (80% sand, 15% silt, 5% clay). The bulk density of the soil was set to 1.5 g cm−3, the saturated hydraulic conductivity to 30 mm hr−1. Land use of the area is perennial grassland. The
grass is cut on 15 May, 30 June and 30 August and it is fer-tilised on 7 March, 22 May and 7 July. The cutting cycle and fertilizer application rates (125 kg/ha N, 6.5 kg/ha P for the first and second application, 100 kg/ha N, 5.2 kg/ha P for the third application) indicate an intensive land use system.
Two weather scenarios have been prepared for KIELSHED-1. In the first scenario artificial weather conditions were established by compiling daily weather records (i.e. precipitation, air temperature, wind speed, solar radiation, relative humidity) from 1 January 1957 to 31 December 1980 of the Flensburg weather station (north-ern Germany, near the border to Denmark) of the German National Meteorological Service. The data were modified such that long-term monthly averages were calculated and the results were resampled to daily resolution. This proce-dure allowed for definition of identical weather conditions in each year. In the second scenario daily weather records from 1 January 1989 to 28 February 2002 of a station of
the Ecology Centre Kiel were used. Data were not modified such that real weather conditions are provided for the model. All watershed characteristics and input data are defined in the SWAT 2000 input file format. The current version of the KIELSHED-1 configuration can be downloaded from http://www.hydrology.uni-kiel.de/swat.
3 Sample applications
The model has been applied in various exercises with the main scope of educational training in hydrological modelling and water resources management. Figure 2a shows a sam-ple annual water balance calculation of one hydrological year (1960) for KIELSHED-1 with artificial weather conditions. As annual input data are identical in this model configuration this result is also representative for other hydrological years except of the initial warm-up phase of the model. Results show that 431 mm (49.5%) of the overall 871 mm of precipi-tation percolate to the groundwater while annual evaporation sums up to 438 mm (50.3%). Surface runoff and interflow are insignificant (2 mm/0.2 %). The distribution of water to the different pathways resembles the findings for real water-sheds in Schleswig-Holstein (e.g. Kluge, 2004; Trepel and Kluge, 2004).
Figure 2b gives an example of the analysis of model be-haviour after modification of one parameter, i.e. the base-flow recession coefficient ALPHA BF which influences groundwater flow to the main channel when the upper aquifer receives no recharge (Neitsch et al., 2002 / un-modified ALPHA BF in KIELSHED-1: 0.03 d−1, modified ALPHA BF: 0.015 d−1). The figure demonstrates the ef-fect of parameter change on the groundwater flow (base-flow) to the stream. Both curves show a strong rise and maximum of flow in the winter season. This behaviour is caused by increased percolation of water from the soil to the aquifer leading to a larger volume of water available for baseflow. The increase of percolation is mainly due to the decrease of evaporation/transpiration compared to the sum-mer time while precipitation shows no significant differences in both periods (data not shown). The lower ALPHA BF leads to a pronounced tailing of baseflow in the summer sea-son and a lower winter peak in comparisea-son to the original KIELSHED-1 configuration, i.e. decrease of ALPHA BF stresses the buffer function of the aquifer by damping peaks and increasing water transfer during low-input conditions. The figure also shows that the unmodified ALPHA BF leads to extreme baseflow conditions at the end of the summer pe-riod (September). The river obtains almost no baseflow at this time and as this is the main source of runoff the river would fall dry. This is not a realistic scenario for northern Germany, but the ALPHA BF was accepted in KIELSHED-1 configuration to obtain strong flow dynamics clearly inter-pretable at the beginning of model training.
KIELSHED-1 with real weather conditions leads to more variable output in comparison to the model results from arti-ficial weather. Figure 3a (black line) gives an example of the
A. L. Horn et al.: Application of a virtual watershed in academic education 139
3 Sample applications
The model has been applied in various exercises with the main scope of educational training
in hydrological modelling and water resources management. Fig. 2a shows a sample annual
water balance calculation of one hydrological year (1960) for KIELSHED-1 with artificial
weather conditions. As annual input data are identical in this model configuration this result is
also representative for other hydrological years except of the initial warm-up phase of the
model. Results show that 431 mm (49.5 %) of the overall 871 mm of precipitation percolate
to the groundwater while annual evaporation sums up to 438 mm (50.3 %). Surface runoff and
interflow are insignificant (2 mm / 0.2 %). The distribution of water to the different pathways
resembles the findings for real watersheds in Schleswig-Holstein (e.g. Kluge, 2004; Trepel
and Kluge, 2004).
Fig. 2: Sample application of KIELSHED-1 using the artificial weather scenario, (a)
calculation of water balance for Nov. 1959 to Oct. 1960, (b) comparison of groundwater flow
to the stream for two values of the baseflow recession coefficient ALPHA_BF
Fig. 2b gives an example of the analysis of model behaviour after modification of one
parameter, i.e. the baseflow recession coefficient ALPHA_BF which influences groundwater
flow to the main channel when the upper aquifer receives no recharge (Neitsch et al., 2002 /
unmodified ALPHA_BF in KIELSHED-1: 0.03 d
-1, modified ALPHA_BF: 0.015 d
-1). The
figure demonstrates the effect of parameter change on the groundwater flow (baseflow) to the
stream. Both curves show a strong rise and maximum of flow in the winter season. This
behaviour is caused by increased percolation of water from the soil to the aquifer leading to a
larger volume of water available for baseflow. The increase of percolation is mainly due to
the decrease of evaporation/transpiration compared to the summer time while precipitation
(a) (b)
Fig. 2. Sample application of KIELSHED-1 using the artificial weather scenario, (a) calculation of water balance for Nov. 1959 to Oct.
1960, (b) comparison of groundwater flow to the stream for two values of the baseflow recession coefficient ALPHA BF.
shows no significant differences in both periods (data not shown). The lower ALPHA_BF
leads to a pronounced tailing of baseflow in the summer season and a lower winter peak in
comparison to the original KIELSHED-1 configuration, i.e. decrease of ALPHA_BF stresses
the buffer function of the aquifer by damping peaks and increasing water transfer during
low-input conditions. The figure also shows that the unmodified ALPHA_BF leads to extreme
baseflow conditions at the end of the summer period (September). The river obtains almost no
baseflow at this time and as this is the main source of runoff the river would fall dry. This is
not a realistic scenario for northern Germany, but the ALPHA_BF was accepted in
KIELSHED-1 configuration to obtain strong flow dynamics clearly interpretable at the
beginning of model training.
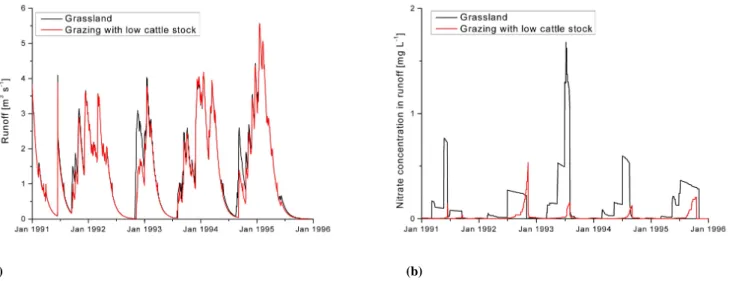
Fig. 3: Simulation of land use change from grassland to grazing with low cattle stock in
KIELSHED-1 using the real weather scenario, calculation of (a) runoff, (b) nitrate
concentration in runoff
KIELSHED-1 with real weather conditions leads to more variable output in comparison to the
model results from artificial weather. Fig. 3a (black line) gives an example of the runoff
dynamics from 1991 to 1995. The basic characteristics of larger runoff during winter time and
a strong decrease in the summer period as described for KIELSHED-1 with artificial weather
conditions can still be recognised but the variation of real weather superposes the general
dynamic.
The KIELSHED-1 version with real weather conditions was used in an advanced student
course for derivation of alternative landuse scenarios. Fig. 3a (red line) shows runoff from the
catchment after change from grassland to all-season grazing with low cattle stock (SWAT
2000 grazing operation with dry weight of consumed biomass: 6.4 kg ha
-1d
-1; dry weight of
biomass trampled down: 6.4 kg ha
-1d
-1; dry weight of manure: 4.8 kg ha
-1d
-1). The impact of
(a) (b)
Fig. 3. Simulation of land use change from grassland to grazing with low cattle stock in KIELSHED-1 using the real weather scenario,
calculation of (a) runoff, (b) nitrate concentration in runoff.
runoff dynamics from 1991 to 1995. The basic characteris-tics of larger runoff during winter time and a strong decrease in the summer period as described for KIELSHED-1 with artificial weather conditions can still be recognised but the variation of real weather superposes the general dynamic.
The KIELSHED-1 version with real weather conditions was used in an advanced student course for derivation of al-ternative landuse scenarios. Figure 3a (red line) shows runoff from the catchment after change from grassland to all-season grazing with low cattle stock (SWAT 2000 grazing opera-tion with dry weight of consumed biomass: 6.4 kg ha−1d−1; dry weight of biomass trampled down: 6.4 kg ha−1d−1; dry weight of manure: 4.8 kg ha−1d−1). The impact of decreas-ing intensity of landuse in comparison to the grassland man-agement system is most obvious in the autumn season. While
the grass is cut down in the grassland management scenario, the higher plant biomass of the grazing scenario leads to in-creased transpiration and lower runoff in this way. Regard-ing nitrate concentration in runoff (Fig. 3b) the two scenar-ios also show strong differences. Excess fertilization of the grassland leads to strong leaching and increase of nitrate con-centration in river water during the vegetation period. Espe-cially in 1993, 1994 and 1995 each fertilization date can be identified by a jump of nitrate concentration in the following time period. For the grazing scenario, the concentrations are generally lower and they show only one annual period of in-crease in autumn/early winter. One reason for the lower con-centrations is the decreased nitrogen input to the system, see above. Only at the end of summer, under conditions of de-creasing evaporation/transpiration and inde-creasing percolation
140 A. L. Horn et al.: Application of a virtual watershed in academic education
of water to the aquifer, excess nitrogen is transported to the groundwater and the river. This results in the observed single peak in December which is followed by an abrupt decrease caused from cessation of nitrogen input and leaching due a strong reduction of cattle biomass on the field.
4 Discussion
The above-mentioned sample applications are typical repre-sentatives of exercises with student groups which have dif-ferent levels of modelling experience. The simplicity of KIELSHED-1 with artificial weather conditions can help be-ginners of hydrological modelling to understand the basic steps of the modelling process like check of water balance (Fig. 2a) and analysis of model sensitivity for certain param-eters (Fig. 2b). The parameter modification can also serve for a simple calibration training, i.e. the modified model ver-sion is given to the students who aim to “calibrate” the model back to original state.
The use of a simplified model holds the risk of reduc-ing complexity too much and sustainreduc-ing an approach which does not reflect realistic conditions, thus leading students to a wrong view of the hydrological behaviour of a system. The structure of KIELSHED-1 was set up to balance the need for and risk of simplicity. For example, soil conditions and landuse were approximated to reality. On the other hand the simple shape of the watershed, the artificial weather and some non-realistic parameters settings (e.g. the baseflow re-cession coefficient) are needed and accepted to ease under-standing of the hydrological system for the inexperienced be-ginner and provide clear results interpretable with restricted knowledge. It is important that the educator is aware of the model restrictions and explains them to the learning group as soon as a sufficient state of knowledge and experience is reached.
The change from artificial to real weather conditions is a major step on the way to deal with a more complex hydrolog-ical system (Fig. 3a). It clearly addresses users with earlier experience in hydrological modelling. While the interpreta-tion of model behaviour under highly variable weather is a major challenge for the users on the one hand, it can also offer the opportunity for more sophisticated exercises which are still in a framework of controlled conditions. The analy-ses of different management scenarios (Fig. 3) give an exam-ple of the power of the model which might also be interesting for scientists seeking a tool for basic research on behaviour of hydrologic systems. The latter group might also benefit es-pecially from the manifold additional options to alter model settings not documented here as they were not in the focus of model set up for educational purposes (e.g. crack flow, in-stream water quality processes, channel degradation, lake water quality, bacteria or pesticide dynamics).
5 Conclusions
The mediation of basic knowledge about modelling of hydrologic systems benefits from the use of virtual wa-tersheds like KIELSHED-1. Students get an improved insight on the representation of processes and interactions in a model. Further, better understanding of the effect of model modifications as well as more competence in inter-pretation of model output can be expected. A wide range of hydrologic conditions can be reproduced with different watershed configurations of KIELSHED-1 which allows for confronting students with a variety of tasks related to real-life problems. This range of application indicates the flexibility of the tool and points at its potential for use in basic research on behaviour of hydrologic systems under constricted conditions.
Edited by: P. Krause, K. Bongartz, and W.-A. Fl¨ugel Reviewed by: anonymous referees
References
Arnold, J. G., Srinivasan, R., Muttiah, R. S., and Williams, J. R.: Large area hydrologic modelling and assessment, Part I: Model development, J. Am. Water Resour. Assoc., 34, 73–89, 1998. Bicknell, B. R., Imhoff, J. C., Kittle Jr., J. L., Jobes, T. H.,
and Donigian Jr., A. S.: Hydrological Simulation Program – FORTRAN, HSPF, Version 12, User’s manual, AQUA TERRA Consultants, Mountain View, California, USA, 2001.
Carriere, P., Mohaghegh, S., and Gaskari, R.: Performance of a vir-tual runoff hydrograph system, J. Water Resour. Plann. Manag., 122, 421–427, 1996.
Eckhardt, K., Fohrer, N., and Frede, H.-G.: Ein methodischer Ansatz zur Analyse der Sensitivit¨at komplexer Modellsysteme, in: Modellierung des Wasser- und Stofftransports in großen Einzugsgebieten, edited by: Fohrer, N. and D¨oll, P., 65–71, Kas-sel University Press, KasKas-sel, 1999.
Guo, J. C. Y.: A semivirtual watershed model by neural networks, Comput. Aided Civ. Infrastruct. Eng., 16, 106–111, 2001. Johanson, R. C., Imhoff, J. C., and Davis Jr., H. H.: User’s manual
for Hydrological Simulation Program – FORTRAN (HSPF), Re-search Grant No. R804971-01, Office of ReRe-search and Develop-ment, U.S. Environmental Protection Agency, Athens, Georgia, USA, 1980.
Kluge, W.: Einfluss von Uferzonen auf die diffusen Eintr¨age von N und P in den Belauer See (Schleswig-Holstein), Archiv f¨ur Naturschutz und Landschaftsforschung, 43, 31–51, 2004. Lenhart, T., Eckhardt, K., Fohrer, N., and Frede, H.-G.: Comparison
of two different approaches of sensitivity analysis, Phys. Chem. Earth, 27, 645–654, 2002.
Miller, N. L.: Sensitivity of surface heat and moisture fluxes due to topographic slope and azimuth, J. Geophys. Res., 100, 18 669– 18 685, 1995.
Neitsch, S. L., Arnold, J. G., Kiniry, J. R., Srinivasan, R., and Williams, J. R.: Soil and Water Assessment Tool user’s man-ual, Texas Water Resources Institute, College Station, Texas, TWRI Report TR-192, available online: http://www.brc.tamus. edu/swat/downloads/doc/swatuserman.pdf (date of access: 11 April 2005), 2002.
A. L. Horn et al.: Application of a virtual watershed in academic education 141
Smith, J. and Eli, R. N.: Neural-network models of rainfall-runoff process, J. Water Resour. Plann. Manag., 121, 499–508, 1995. Szilagyi, J., Parlange, M. B., and Albertson, J. D.: Recession flow
analysis for aquifer parameter determination, Water Resour. Res., 34, 1851–1857, 1998.
Trepel, M. and Kluge, W.: WETTRANS: a flow-path-oriented decision-support system for the assessment of water and nitrogen exchange in riparian peatlands, Hydrolog. Process., 18, 357–371, 2004.