SUCLG2 identified as both a determinator of CSF
Ab
1– 42
levels and an attenuator of cognitive decline
in Alzheimer’s disease
Alfredo Ramirez
1,2,{,∗, Wiesje M. van der Flier
6,7,{, Christine Herold
8,{, David Ramonet
3,{,
Stefanie Heilmann
2,4, Piotr Lewczuk
9, Julius Popp
1, Andre´ Lacour
8, Dmitriy Drichel
8, Eva
Louwersheimer
6,7, Markus P. Kummer
3,8, Carlos Cruchaga
10,11, Per Hoffmann
2,4,13, Charlotte
Teunissen
6,7, Henne Holstege
6,7, Johannes Kornhuber
9, Oliver Peters
14, Adam C. Naj
15, Vincent
Chouraki
16,17, Ce´line Bellenguez
18,19,20, Amy Gerrish
21, International Genomics of Alzheimer’s
Project (IGAP)
{, Alzheimer’s Disease Neuroimaging Initiative (ADNI)
}, Reiner Heun
1, Lutz
Fro
¨ lich
22, Michael Hu
¨ ll
23, Lara Buscemi
24, Stefan Herms
2,4,13, Heike Ko¨lsch
1, Philip Scheltens
6,7,
Monique M. Breteler
8, Eckart Ru
¨ ther
25, Jens Wiltfang
25, Alison Goate
10,12, Frank Jessen
1,8,
Wolfgang Maier
1,8, Michael T. Heneka
3,8,§, Tim Becker
5,8,§and Markus M. No
¨ then
2,4,§1
Department of Psychiatry and Psychotherapy,2Institute of Human Genetics,3Clinical Neuroscience Unit, Department of Neurology,4Department of Genomics, Life & Brain Center,5Institute for Medical Biometry, Informatics, and Epidemiology, University of Bonn, 53127, Bonn, Germany,6Department of Neurology and Alzheimer Center, Neuroscience Campus Amsterdam, VU University Medical Center, 1081 HZ, Amsterdam, The Netherlands,7Department of Epidemiology & Biostatistics, VU University Medical Center, 1007 MB, Amsterdam, The Netherlands,8German Center for
Neurodegenerative Diseases (DZNE), 53175, Bonn, Germany,9Department of Psychiatry and Psychotherapy, Universita¨tsklinikum Erlangen, and Friedrich-Alexander Universita¨t Erlangen-Nu¨rnberg, 91054, Erlangen, Germany,
10
Department of Psychiatry,11Hope Center for Neurological Disorders, School of Medicine,12Department of Genetics, Washington University, St. Louis, MO 63110, USA,13Division of Medical Genetics, University Hospital and Department of Biomedicine, University of Basel, CH-4058, Basel, Switzerland,14Department of Psychiatry, Charite´, 14050, Berlin, Germany,15Center for Clinical Epidemiology & Biostatistics, University of Pennsylvania, PA 19104, Philadelphia, USA,
16
Department of Neurology, Boston University School of Medicine, MA 02118, Boston, USA,17The Framingham Heart Study, MA 01702, Framingham, USA,18Inserm, U744, Lille 59000, France,19Universite´ Lille 2, Lille 59000, France,
20
Institut Pasteur de Lille, Lille 59000, France,21Institute of Psychological Medicine and Clinical Neurosciences, MRC Centre for Neuropsychiatric Genetics & Genomics, Cardiff University, Cardiff, UK,22Department of Geriatric Psychiatry, Central Institute of Mental Health, Medical Faculty Mannheim, University of Heidelberg, 68159, Mannheim, Germany,
23
Centre for Geriatric Medicine and Section of Gerontopsychiatry and Neuropsychology, Medical School, University of Freiburg, 79106, Freiburg, Germany,24Department of Fundamental Neurosciences, UNIL, 1005 Lausanne, Switzerland and25Department of Psychiatry and Psychotherapy, University of Go¨ttingen, 37075 Go¨ttingen, Germany
Received March 1, 2014; Revised June 27, 2014; Accepted July 9, 2014
†
These authors contributed equally.
∗To whom correspondence should be addressed at: Department of Psychiatry and Psychotherapy, University of Bonn, Sigmund Freud-Strasse 25, D-53127,
Bonn, Germany. Tel:+49 22828719323; Fax: +49 22828716097; Email: alfredo.ramirez@ukb.uni-bonn.de
‡
A list of additional IGAP investigators can be found at Supplementary Material, Acknowledgements.
}
A complete listing of ADNI investigators can be found at Supplementary Material, Acknowledgements.
§
Joint senior authors.
#The Author 2014. Published by Oxford University Press. All rights reserved. For Permissions, please email: journals.permissions@oup.com
Cerebrospinal fluid amyloid-beta 1 – 42 (Ab1 – 42) and phosphorylated Tau at position 181 (pTau181) are
biomar-kers of Alzheimer’s disease (AD). We performed an analysis and meta-analysis of genome-wide association study data on Ab1 – 42and pTau181in AD dementia patients followed by independent replication. An association
was found between Ab1 – 42 level and a single-nucleotide polymorphism in SUCLG2 (rs62256378)
(P 5 2.5310212). An interaction between APOE genotype and rs62256378 was detected (P 5 9.5 3 1025), with the strongest effect being observed in APOE-14 noncarriers. Clinically, rs62256378 was associated with rate of cognitive decline in AD dementia patients (P 5 3.1 3 1023). Functional microglia experiments showed that SUCLG2 was involved in clearance of Ab1 – 42.
INTRODUCTION
Alzheimer’s disease (AD) is a complex disorder in which several pathways contribute to pathology and clinical phenotype. Delin-eation of each pathological pathway and identification of the factors which modulate them are crucial for the development of effective treatment. Information on individual pathological pathways is provided by biomarkers. In AD, cerebrospinal fluid (CSF) levels of Ab1 – 42and phosphorylated Tau (pTau)
reflect cerebral amyloid deposition and tau-related neurodegen-eration, respectively. However, many of the biological factors that influence these core AD pathways remain elusive.
Research has shown that AD risk genes contribute to CSF marker variance (1–4). However, genes may also exist that affect CSF markers without conferring disease susceptibility. These genes may be promising candidates for modulation of the disease process.
The aim of the present study was to identify genetic factors related to heterogeneity in pathological pathways involved in amyloid deposition and tau-related neurodegeneration—as manifested through CSF Ab1 – 42and pTau levels—and which
might influence the clinical course of AD. To achieve this, we performed a four-step investigation involving analysis and meta-analysis of data from genome-wide association studies (GWASs) of these two CSF biomarkers; replication of our top findings in an independent sample; and specific analyses and functional experiments to follow-up promising findings. In con-trast to previous GWAS of CSF biomarkers (1,4,5), the present GWAS was restricted to patients with dementia secondary to AD only in order to enrich for genetic effects occurring after disease onset.
RESULTS Study design
We analyzed GWAS data on CSF biomarkers Ab1 – 42and Tau
phosphorilated at position 181 (pTau181) from three independent
AD cohorts (Bonn1CSF, n ¼ 113; Bonn2CSF, n ¼ 167; ADNI, n ¼ 83). The resulting data were then combined in a meta-analysis. The three GWAS cohorts are described in detail in Materials and Methods and Table1. In all three cohorts, the CSF biomarkers Ab1 – 42and pTau181showed a normal
distribu-tion (Supplementary Material, Figs S1 and S2).
For the replication step, we selected single-nucleotide poly-morphisms (SNPs) that showed consistent allele direction across all three GWAS, which modulated either Ab1 – 42 or
pTau181 with P,5× 1026, and which showed consistent
allele direction across all studies. These 30 SNPs, together with 10 SNPs representing known AD susceptibility genes, were then genotyped in an independent sample of 515 AD dementia patients (Amsterdam Dementia Cohort, ADC). These 40 SNPs represented a total of 39 loci. Two SNPs showing association with CSF levels of Ab1 – 42in the GWAS
meta-analysis were replicated in the ADC, i.e. rs429358 at the APOE locus and rs62256378 at a novel locus containing the SUCLG2 gene. The ADC sample is described in detail in Mate-rials and Methods and Table1. In the ADC cohort, the CSF bio-markers Ab1 – 42 and pTau181 showed a normal distribution
(Supplementary Material, Figs. S1 and S2).
Since these two replicated loci both modulated Ab1 – 42levels
in the CSF, we explored a possible genetic interaction, since this might suggest a biological link between the two loci. We also investigated whether rs62256378 (i) confers AD risk, using a case – control sample and (ii) has a possible effect on cognitive decline in AD dementia patients, using prospective data on Mini-Mental State Examination (MMSE) scores. The samples used in these two analyses are described in detail in Materials and Methods.
Functional experiments were then performed to elucidate the functional role of SUCGL2 in Ab1 – 42homeostasis. First, the
cellular distribution of SUCLG2 was examined in postmortem human brain tissue from individuals who had died from non-neurological disease. Secondly, to follow-up our finding con-cerning genetic interaction with APOE, the effect of APOE-14 carrier status on the protein expression of SUCLG2 was investi-gated using protein extracts from human AD and control post-mortem frontal cortex. Thirdly, the role of SUCLG2 in microglial Ab1 – 42 phagocytosis was analyzed by reducing
SUCLG2 expression through siRNA approaches.
GWAS meta-analysis
Meta-analysis of the three GWAS yielded genome-wide infla-tion factors of l ¼ 1.05 for Ab1 – 42 and l ¼ 1.03 for pTau181
(Supplementary Material, Fig. S3). After l-adjustment, a genome-wide significant association was observed between APOE-14 (rs429358) and Ab1 – 42(P ¼ 1.8× 10210), thus
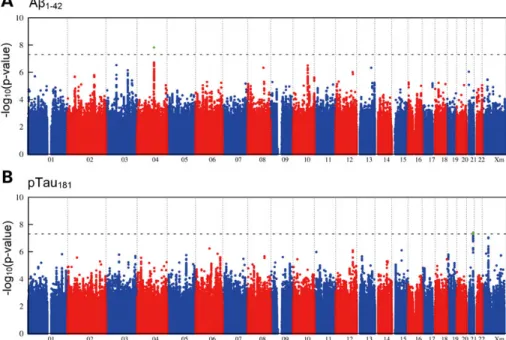
con-firming published data (Table2) (1,4,5). A total of 335 SNPs were below the threshold of genome-wide significance but had a promising P-value of ,5× 1026 (Fig. 1). Of these, 163 showed consistent allele direction across all three GWAS.
Replication and meta-analysis of combined data
Thirty-five of the 40 SNPs included in the replication step were successfully genotyped (Supplementary Material, Table S1).
The replication step revealed a strong association between rs429358 (APOE-14) and Ab1 – 42 levels (P ¼ 1.1× 1025,
b ¼ 20.7 + 0.015, Table 2). The units used to express the effect size of the SNPs (b + SE) are standardized. This associ-ation became stronger in a meta-analysis of the combined GWAS and replication data (P ¼ 4.3× 10217, b ¼ 20.4 + 0.05, Table2).
The second strongest replication signal was for association between an SNP on chromosome 3p14.1 [rs62256378, minor allele frequency (MAF) ¼ 6.1%], and Ab1 – 42levels (P ¼ 1.9×
1026, b ¼ 0.61 + 0.13; Supplementary Material, Fig. S4). The meta-analysis of the GWAS and replication data generated a highly significant finding (P ¼ 2.5× 10212, b ¼ 0.71 + 0.10), with the low-frequency allele being associated with higher Ab1 – 42levels and showing an effect size (standardized units for
b + SE) that was larger than that of APOE-14. Since rs622 56378 was imputed, we genotyped this SNP in 264 individuals from the GWAS step for whom DNA was available. The genotyp-ing of rs62256378 usgenotyp-ing Sequenom technology revealed a con-cordance between imputed and experimental genotypes of .99%, demonstrating the validity of the imputed rs62256378 gen-otypes in the GWAS step (the results of the statistical calculations that involved imputed and experimental genotypes are provided in Supplementary Material, Table S2).
With the exception of APOE, none of the known AD suscep-tibility genes showed genome-wide significant association with Ab1 – 42 or pTau181 levels in the meta-analysis of the three
GWAS and the replication sample (Table 3). Both CD2AP (rs9349407) and APOE (rs429358) showed a nominally signifi-cant association with increased pTau181levels (P ¼ 0.031 and
0.029, respectively).
Effect of rs62256378 on AD risk
In the case – control analysis, no association was found between rs62256378 and AD risk (P ¼ 0.8, OR ¼ 1.03, 95% CI 0.79–1.27). However, we cannot exclude the possibility that an AD association might be detected in a larger case – control sample. To test this, we obtained Stage I association data for rs6225 6378 from the case – control meta-analysis study conducted by the International Genomics of Alzheimer’s Project (IGAP) (6). Here, the SNP rs62256378 showed no association with AD risk in either the complete Stage I analysis (P ¼ 0.7, OR ¼ 0.98, 95% CI 0.91 – 1.06) or the stratum of APOE-14 noncarrier (P ¼ 0.7, OR ¼ 1.02, 95% CI 0.91 – 1.13).
Genetic interaction between rs429358 and rs62256378 Both of the presently replicated loci modulated Ab1 – 42levels.
APOE-14 was associated with lower Ab1 – 42 levels, and the
minor allele A of rs62256378 was associated with higher Ab1 – 42levels. Investigation of a possible interaction between
the two association signals revealed strong evidence for allelic interaction (P ¼ 9.5× 1025, Table4). The effect of the minor allele A of rs62256378 varied substantially depending on APOE-14 carrier – noncarrier status (Table 5). The strongest
Tabl e 1 . Des cript ion of the sampl es use d in th e pres ent st udy Bonn1 CSF Bon n2CS F ADNI ADC AD dem entia patients Heal thy cont rols Bonn1 : 4 3 8 Bonn2 : 641 B onn1 : 1 1 7 9 Bon n2 : 1096 N 113 167 83 51 5 1079 2275 Age (years + SD) 71.6 (+ 7.4) 71.8 (+ 7.7) 74.8 (+ 7.5) 66 .4 (+ 8.8 ) 7 3 .3 (+ 8.8 ) 5 6 .7 (+ 13.8) F : M ratio 1.26 1.19 1 1.05 1.7 1.3 A b1–4 2 (+ SD) 478.3 (+ 186.5) 529.2 (+ 238.1) 149.4 (+ 51 .1) 46 2.5 (+ 147.9 ) N A N A N A N A pTau 181 (+ SD ) 87.5 (+ 36.5) 88.6 (+ 45 .2) 39.5 (+ 20.1) 88 .2 (+ 38 .8) NA NA NA NA Genot ype pl atform Illum ina 61 0 Illum ina 1M-quad Illumina 610 Se quenom Bonn1 : 4 3 8 Bonn2 : 641 B onn1 : 1 1 7 9 Bon n2 : 1096 Illumina 610 Illum ina 1M-q uad Illum ina HumanH ap550 k Illum ina 1M-quad F : M ratio ,female : mal e ratio ;SD, standar d devi ation. A b1–4 2 ,amylo id-beta 1 – 42; pTau 181 ,phos phoryla ted Tau at positio n 181; AD, Al zheimer’s disease; C SF, cereb rospinal flui d; ADN I, Alzheimer’s Diseas e Neur oimagin g Initiati ve cohort; ADC, Ams terdam Dement ia Cohort.
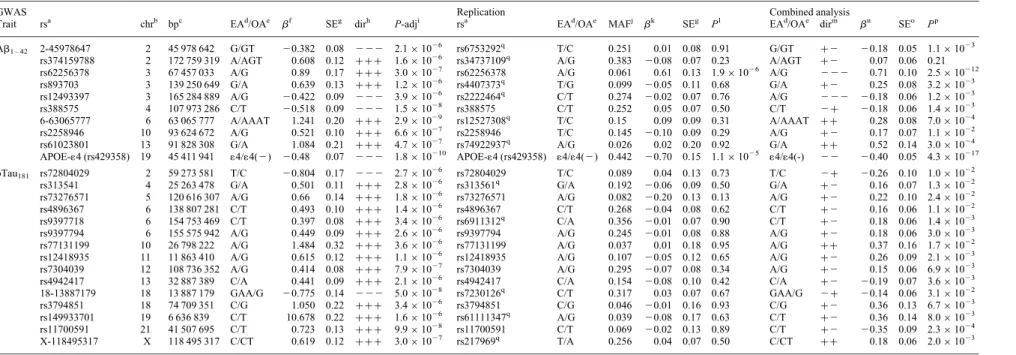
Table 2. Summary of GWAS, replication and overall meta-analysis for SNPs with P , 5× 1026and the same effect direction in all three GWAS samples
GWAS Replication Combined analysis
Trait rsa chrb bpc EAd/OAe bf
SEg dirh P-adji rsa EAd/OAe MAFj bk
SEg Pl EAd/OAe dirm bn SEo Pp Ab1 – 42 2-45978647 2 45 978 642 G/GT 20.382 0.08 2 2 2 2.1× 1026 rs6753292q T/C 0.251 0.01 0.08 0.91 G/GT +2 20.18 0.05 1.1× 10²³ rs374159788 2 172 759 319 A/AGT 0.608 0.12 +++ 1.6 × 1026 rs34737109q A/G 0.383 20.08 0.07 0.23 A/AGT +2 0.07 0.06 0.21 rs62256378 3 67 457 033 A/G 0.89 0.17 +++ 3.0 × 1027 rs62256378 A/G 0.061 0.61 0.13 1.9× 1026 A/G 2 2 2 0.71 0.10 2.5× 10212 rs893703 3 139 250 649 G/A 0.639 0.13 +++ 1.2 × 1026 rs4407373q T/G 0.099 20.05 0.11 0.68 G/A +2 0.25 0.08 3.2× 10²³ rs12493397 3 165 284 889 A/G 20.422 0.09 2 2 2 3.9× 1026 rs2222464q C/T 0.274 20.02 0.07 0.76 A/G 2 2 2 20.18 0.06 1.2× 10²³ rs388575 4 107 973 286 C/T 20.518 0.09 2 2 2 1.5× 1028 rs388575 C/T 0.252 0.05 0.07 0.50 C/T 2+ 20.18 0.06 1.4× 10²³ 6-63065777 6 63 065 777 A/AAAT 1.241 0.20 +++ 2.9 × 1029 rs12527308q T/C 0.15 0.09 0.09 0.31 A/AAAT ++ 0.28 0.08 7.0× 1024 rs2258946 10 93 624 672 A/G 0.521 0.10 +++ 6.6 × 1027 rs2258946 T/C 0.145 20.10 0.09 0.29 A/G +2 0.17 0.07 1.1× 10²² rs61023801 13 91 828 308 G/A 1.084 0.21 +++ 4.7 × 1027 rs74922937q A/G 0.026 0.02 0.20 0.92 G/A ++ 0.52 0.14 3.0× 1024 APOE-14 (rs429358) 19 45 411 941 14/14(2) 20.48 0.07 2 2 2 1.8× 10210 APOE-14 (rs429358) 14/14(2) 0.442 20.70 0.15 1.1× 1025 14/14(-) 2 2 20.40 0.05 4.3× 10217 pTau181 rs72804029 2 59 273 581 T/C 20.804 0.17 2 2 2 2.7× 10 26 rs72804029 T/C 0.089 0.04 0.13 0.73 T/C 2+ 20.26 0.10 1.0× 10²²
rs313541 4 25 263 478 G/A 0.501 0.11 +++ 2.8 × 1026 rs313561q G/A 0.192 20.06 0.09 0.50 G/A +2 0.16 0.07 1.3× 10²²
rs73276571 5 120 616 307 A/G 0.66 0.14 +++ 1.8 × 1026 rs73276571 A/G 0.082 20.20 0.13 0.13 A/G +2 0.22 0.10 2.4× 10²²
rs4896367 6 138 807 281 C/T 0.493 0.10 +++ 1.4 × 1026 rs4896367 C/T 0.268 20.04 0.08 0.62 C/T +2 0.16 0.06 1.1× 10²²
rs9397718 6 154 753 469 C/T 0.397 0.08 +++ 3.4 × 1026 rs6911312q C/A 0.356 20.01 0.07 0.90 C/T +2 0.18 0.06 1.4× 10²³
rs9397794 6 155 575 942 A/G 0.449 0.09 +++ 2.6 × 1026 rs9397794 A/G 0.245 20.01 0.08 0.88 A/G +2 0.18 0.06 3.0× 10²³
rs77131199 10 26 798 222 A/G 1.484 0.32 +++ 3.6 × 1026 rs77131199 A/G 0.037 0.01 0.18 0.95 A/G ++ 0.37 0.16 1.7× 10²²
rs12418935 11 11 863 410 A/G 0.615 0.12 +++ 1.1 × 1026 rs12418935 A/G 0.107 20.05 0.12 0.65 A/G +2 0.26 0.09 2.1× 10²³
rs7304039 12 108 736 352 A/G 0.414 0.08 +++ 7.9 × 1027 rs7304039 A/G 0.295 20.07 0.08 0.34 A/G +2 0.15 0.06 6.9× 10²³
rs4942417 13 32 887 389 C/A 0.441 0.09 +++ 2.1 × 1026 rs4942417 C/A 0.154 20.08 0.10 0.42 C/A +2 20.19 0.07 3.6× 10²³
18-13887179 18 13 887 179 GAA/G 20.775 0.14 2 2 2 5.0× 1028 rs7230126q C/T 0.317 0.03 0.07 0.67 GAA/G 2+ 20.14 0.06 3.1× 10²² rs3794851 18 74 709 351 C/G 1.050 0.22 +++ 3.4 × 1026 rs3794851 C/G 0.046 20.01 0.16 0.93 C/G +2 0.36 0.13 6.7× 10²³ rs149933701 19 6 636 839 C/T 10.678 0.22 +++ 1.6 × 1026 rs61111347q A/G 0.039 20.08 0.17 0.63 C/T +2 0.36 0.14 8.0× 10²³ rs11700591 21 41 507 695 C/T 0.723 0.13 +++ 9.9 × 1028 rs11700591 C/T 0.069 20.02 0.13 0.89 C/T +2 20.35 0.09 2.3× 1024 X-118495317 X 118 495 317 C/CT 0.619 0.12 +++ 3.0 × 1027 rs217969q T/A 0.256 0.04 0.07 0.50 C/CT ++ 0.18 0.06 2.0× 10²³ r2
-values for proxy SNPs were computed on the basis of 1000 Genomes reference data, May 2012 release, CEU sample. GWAS, genome-wide association study.
a
rs number.
b
Chromosome.
c
Physical position in base pairs, according to dbSNP build 37.
d
Effect allele: allele for which the effect estimate is reported.
e
Other allele.
f
Effect estimate (fixed effects meta-analysis) for Step 1 meta-analysis.
g
Corresponding standard error.
h
Effect directions in the three initial studies.
i
Lambda-adjusted P-value (fixed effects meta-analysis), GWAS meta-analysis.
j
Minor allele frequency.
k
Effect estimate from regression analysis. Represents changes in Ab1 – 42or pTau181levels in standard deviations per minor allele. l
P-value of regression analysis.
m
Effect directions for Step 1 (joint direction) and replication analysis.
n
Effect estimate (fixed effects meta-analysis) GWAS meta-analysis plus replication.
o
Corresponding standard error.
p
P-value (fixed effects meta-analysis) GWAS meta-analysis plus replication.
q
Proxy SNP supporting the signal of the GWAS.
Hu man Molecular Genetics, 2014, Vol. 23, No. 24 6647
effect of rs62256378-A in terms of elevation of Ab1 – 42levels
was observed in APOE-14 noncarriers (P ¼ 1.5× 1028, b ¼ 0.97 + 0.17, Table5; Supplementary Material, Fig. S5). The units used to express the effect of the SNPs (b + SE) are standar-dized. In heterozygous APOE-14 carriers, the effect remained significant, although the level of significance was reduced (P ¼ 1.5× 10²³, b ¼ 0.35 + 0.11, Table 5; Supplementary Material, Fig. S5). In APOE-14 homozygotes, no significant effect was detectable for rs62256378-A (P ¼ 0.84). This finding was supported by the consistent pattern of interaction observed across all four sub-samples (Table5). However, the study-specific effect estimates for rs62256378 (Table5) indicate substantial heterogeneity (I2¼ 72%, P ¼ 9.9× 1024 with x2-test for heterogeneity). This heterogeneity was driven by the Bonn1CSF sample, which had a markedly higher effect esti-mate than the other studies. Interestingly, our signal was not driven by this sub-study, since meta-analysis of the remaining three studies also yielded genome-wide significance for rs62256378 (P ¼ 2.2× 1029, b ¼ 0.64 + 0.11).
Rs62256378 and cognitive decline
The SNP rs62256378-A significantly attenuated cognitive decline in AD dementia patients (P ¼ 3.1× 10²³, b ¼ 0.32 + 0.12, Table6; Supplementary Material, Fig. S6). After stratifica-tion for APOE genotype, this effect was significant in APOE-14 noncarriers (P ¼ 0.021, b ¼ 0.32 + 0.16, Table 6). A non-significant trend was observed in heterozygous APOE-14 car-riers (P ¼ 0.07, b ¼ 0.31 + 0.21). No evidence was found for interaction between SUCLG2 (rs62256378) and APOE genotype (P ¼ 0.456).
Conditional analysis of the SUCLG2 locus
This marker is located within a recombination hotspot. This hotspot defines two linkage disequilibrium blocks that span several exons of SUCLG2 on chromosome 3p14.1 (Supplemen-tary Material, Fig. S4). Conditional analysis showed that all add-itional signals in this region were dependent on rs62256378 (Supplementary Material, Table S4).
Functional investigation of the role of SUCLG2
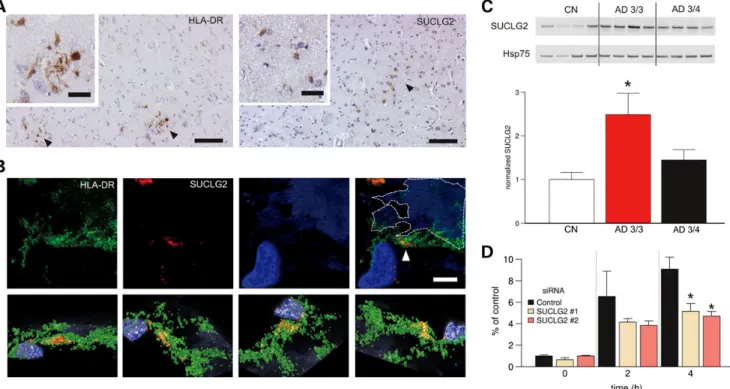
Immunohistochemistry revealed that SUCLG2 expression was mainly confined to microglial cells (7) in the postmortem brains of AD dementia patients and age-matched controls (Fig. 2A and B). The strongest association between rs62256378 and higher Ab1 – 42levels was observed in APOE-14 noncarriers. To
determine whether APOE status influenced SUCLG2 levels, SUCLG2 protein levels were analyzed in human postmortem samples from the frontal cortex, a brain region affected at an early stage of AD. Here, ApoE3/3 carriers showed significantly higher SUCLG2 levels compared with ApoE3/4 carriers (Fig.2C). Controls in turn showed the lowest levels, reinforcing the hypothesis that rs62256378 may influence the disease course in AD, rather than overall disease risk. SUCLG2 levels in micro-glial cells were then lowered using various siRNA approaches (Supplementary Material, Fig. S7). Decreasing microglial SUCLG2 compromised Ab1 – 42 phagocytosis in a
time-dependent manner (Fig.2D). DISCUSSION
The present study demonstrated that genetic variation in SUCLG2 modulated Ab1 – 42levels in AD dementia patients.
Figure 1. Genome-wide signal intensity (Manhattan) plots. (A) Results for the association with CSF Ab1 – 42. (B) Results for the association with CSF pTau181. Both plots show the individual P-values against genomic position. Chromosome number is shown on the x-axis. The results within each chromosome are plotted left to right, with left being the P-terminal end of the corresponding chromosome. Horizontal dashed lines indicate a P-value threshold of 5× 1028(i.e. genome-wide signifi-cance). Green dots depict single-nucleotide polymorphisms with genome-wide significance in the genome-wide association study step.
Furthermore, we found that SUCLG2 was associated with AD clinical course, as measured by change in MMSE over time. Despite substantial evidence for heterogeneity in the effect of rs62256378, the stronger effect estimate observed in Bonn1CSF does not call the validity of our initial result for rs62256378 into question, since the overall signal was not deter-mined by Bonn1CSF; the meta-analysis that excluded this sample also demonstrated genome-wide significance for rs62256378 (P ¼ 2.2× 1029, b ¼ 0.64 + 0.11).
To our knowledge, no previous genetic or biological study has implicated SUCLG2 in AD. The negative result of our case – control analysis suggests that this gene does not confer AD sus-ceptibility, which would explain why it has not been identified in previous case – control GWAS of AD. Possible reasons for the failure of previous GWAS of CSF markers to identify SUCLG2 are 3-fold. First, they included unaffected subjects and individuals with mild cognitive impairment (MCI). Secondly, they analyzed non-imputed datasets. In this regard, we computed r2values for rs62256378 with SNPs from the 1000 Genomes project data, release May 2012. Only five SNPs (rs76856038, rs76856038, rs80028595, rs115298081 and rs74727963) showed r2 values of .0.50 with rs62256378, and none of these are included in the Illumina 550K or Omni marker panels. Thirdly, APOE status was not used as a covariate in the analyses. In contrast, analysis in the present study was restricted to AD dementia patients only, genetic data were imputed, and APOE status was included as a covariate.
Our data also confirmed the previously reported association between the APOE locus and Ab1 – 42levels. Interestingly, the
effect of SUCLG2 was mainly observed in APOE-14 noncar-riers. This suggests that SUCLG2 and APOE converge in their effect on Ab1 – 42levels in some, as yet unidentified, common
biological pathway.
The effect of SUCLG2 on Ab1 – 42levels was surprisingly
high, since we did not expect to identify a novel gene with an effect comparable with APOE. SUCLG2 explained 10.7% of the variance in Ab1 – 42levels in APOE-14 noncarriers, which
is more than the variance explained by APOE-14 in the overall sample (7.1%, Supplementary Material, Table S5).
None of the presently investigated SNPs showed genome-wide significant association with pTau181. To date,
genome-wide significant association with total Tau/pTau181levels has
been reported for four loci, i.e. APOE, SNAR-I, GLIS3 and NCR2 (1,4,5). Besides APOE, a recent GWAS by Cruchaga et al. (5) identified the following three novel genome-wide significant findings for total Tau and pTau181levels: (i) rs9877502
at SNAR-I, P ¼ 4.89× 1029and P ¼ 1.68× 1027for total Tau and pTau181, respectively; (ii) rs514716 at GLIS3, P ¼ 1.07×
1028and P ¼ 3.22× 1029for Tau and pTau181, respectively and
(iii) rs6922617 at NCR2, P ¼ 2.55× 1025and P ¼ 3.58× 1028 for total Tau and pTau181, respectively. Of these three SNPs, only
rs9877502 and pTau181showed a nominally significant association
in the present GWAS meta-analysis of pTau181(P ¼ 9.21× 10 24
). Interestingly, we observed a non-significant trend for rs6922617 (P ¼ 0.07). This locus received further support from the adjacent SNP rs11966476 (P ¼ 0.04) (Supplementary Material, Table S3). We observed a nominally significant association between the pTau181 level and three SNPs: rs429358 (APOE locus),
rs9877502 (SNAR-I) and rs11966476 (NCR2). To our knowledge, our results for SNAR-I and NCR2 represent the first independent
Tabl e 3 . Effect of kn own AD suscep tibility genes on CSF level s o f A b1–4 2 and pT au 181 Referen ce: case – cont rol analysi s (GW AS cat alog ) Gene Report ed SNP Risk allele frequen cy OR Minor allele Major allele Risk allele Effect of suscep tibility allel e on A b1-42 levels a Consi stency b P Effect of sus ceptibil ity allele on pTau 181 levels a Consist ency b P APOE rs429 358 (APOE-1 4) 0.09 3 – 4 C T C 2 0.404 Yes 4.3 × 10 2 17 0.113 Yes 0.024 ABCA 7 rs376 4650 0.1 1.23 G T G 2 0.038 Yes 0.649 0.004 Yes 0.96 CR1 rs665 6401 0.19 1.21 A G A 2 0.104 Yes 0.094 0.121 Yes 0.06 PICAL M rs385 1179 0.63 1.16 T C C 0.006 No 0.909 0.031 Yes 0.581 CLU rs111 36000 0.6 1.16 T C C 0 No 0.995 2 0.007 No 0.909 BIN1 rs744 373 0.29 1.15 G A G 0.007 No 0.895 0.078 Yes 0.17 EPHA1 rs117 67557 0.79 1.11 C T T 0.003 No 0.964 0.015 Yes 0.818 CD2 AP rs934 9407 0.29 1.11 C G C 2 0.086 Yes 0.111 0.119 Yes 0.031 CD3 3 rs386 5444 0.69 1.1 A C C 0.003 No 0.959 0.005 Yes 0.936 MS4A rs610 932 0.58 1.1 T G G 0.024 No 0.652 0.009 Yes 0.871 GWAS , genom e-wi de associat ion stud y; C SF, cerebr ospinal fluid; OR, od ds ratio. aEffect estim ate from regression analy sis. C ovari ates use d for the analy sis are APOE , age and sex . Represents chang es in A b1–4 2 or pTau 181 levels in stand ard devi ations per minor allele. bCon sistency in allele dir ection between the OR observ ed in the pres ent st udy and the OR repo rted in the GWAS cat alog.
replications of these loci. A possible reason for our failure to rep-licate the finding for GLIS3 is that in addition to AD dementia patients, the study by Cruchaga et al. also included MCI patients and controls. If GLIS3 only contributes to pTau181variance in
unaffected individuals or during the preclinical stages of disease, this effect may not be present in our sample.
With the exception of APOE, none of the known AD suscep-tibility genes showed genome-wide significant association with either Ab1 – 42or pTau181levels in the present study. Previous
studies have reported associations between Ab1 – 42or pTau181
levels and the AD susceptibility genes PICALM, CLU, MS4A4A and TREM2 (2,3,5). Again, our failure to replicate these findings, even at a level of nominal significance, may have been due to the fact that our study focused on AD dementia patients only. The present study is the first to report an associ-ation between the AD susceptibility gene CD2AP (rs9349407) and pTau181level (P ¼ 0.031), although this finding was only
nominally significant and requires replication. In the case of TREM2, a genuine association between the SNP originally asso-ciated with AD (rs75932628; p.R47H) and pTau181cannot be
ruled out, since none of the present SNPs in this region displayed sufficient linkage disequilibrium with rs75932628, and this SNP cannot be imputed adequately using available variant databases. SUCLG2 encodes a GTP-specific b-subunit of the succinyl-CoA ligase (SUCL). The mitochondrial matrix enzyme SUCL is a heterodimer, which is formed by an invariable a-subunit (encoded by SUCLG1), and a variable b-subunit which confers nucleoside specificity. This b-subunit is encoded by either SUCLA2 or SUCLG2. In the case of SUCLG2, the SUCL enzyme catalyzes the reversible conversion of succinyl-CoA and GDP to succinate and GTP, respectively (8). Previous studies have identified mutations in SUCLG1 and SUCLA2 in patients with mitochondrial DNA (mtDNA) depletion syn-dromes (MDS). MDS are characterized by a decrease in mtDNA content and a reduction in the activity of mitochondrial respiratory chain complexes I, II, IV and V (9). Interestingly, both features have also been found, to a lesser extent, in AD (10). In line with this, Miller et al. demonstrated that reducing the expression of SUCLG2 led to a decrease in both mtDNA and the activity mitochondrial complex IV (11).
Our observation of higher SUCLG2 expression in APOE-14 noncarriers may be explained in terms of the amyloid cascade hypothesis. While hereditary AD is caused by an overproduction of Ab1 – 42secondary to autosomal dominant mutations in genes
coding for APP and presenilin 1 and 2, sporadic AD is more likely to arise from limited clearance of Ab1 – 42(12). Limited
clearance by microglia is likely to contribute to increased Ab1 – 42burden in the brains of sporadic AD dementia patients,
as described recently for the CD33 risk allele rs3865444 (13). In terms of the interaction of APOE with SUCLG2, an improve-ment in the microglial clearance of Ab1 – 42may be of central
importance in terms of explaining this genetic relationship. In this regard, ApoE is indeed tightly connected to the turnover of Ab1 – 42, since it plays a critical role in the normal proteolytic
clearance of Ab1 – 42(14). Increased levels of ApoE and
lipida-tion of ApoE increase the intra- and extracellular microglial deg-radation of Ab1 – 42by increasing the interaction between ApoE
and Ab1 – 42(15). Notably, ApoE-12 and 13 isoforms have a
higher lipidation status than the ApoE-14 isoform, and ApoE-14 is much less efficient in promoting soluble Ab1 – 42degradation
Tabl e 4 . Ana lysis of interact ion between A b1–4 2 levels, rs49 2358 and rs622 56378 SNP1 Al leles SNP1 SN P2 Al leles SNP2 Bon n1CS F Bonn2C SF ADN I ADC Me ta-analysis Min or Major Min or Major b a SE b P c b a SE b P c b a SE b P c b a SE b P c b a SE b P c rs622 56378 A G rs42 9358 1 4 1 4( 2 ) 2 1.32 0.58 0.02 2 0.55 0.31 0.08 2 0.09 0.40 0.82 2 0.56 0.18 2.0 × 10 2 3 2 0.55 0.14 9.5 × 10 2 5 CSF, cereb rospi nal flui d; ADN I, Al zheimer’s Disease Neu roimag ing Initiati ve cohort ; ADC, Ams terdam Dementia Cohort. a Effect estim ate for allel ic interact ion term x1 x2 . Represents chang es in A b1–4 2 or pTau 181 levels in stand ard devi ations per minor allele. bStanda rd er ror of effect est imate. c P -valu e.
by microglia (14). In the present study, the association between rs62256378 and Ab1 – 42CSF levels was modified by ApoE-14.
The latter also decreased the level of SUCLG2 in microglia, and this in turn impaired Ab1 – 42phagocytosis. Conversely, in AD
patients carrying the SUCLG2 A allele and being APOE-14 non-carriers, microglial Ab1 – 42 clearance is probably improved
through the combination of two mechanisms. First, an ApoE-dependent mechanism that delivers more efficiently Ab1 – 42to
microglia. Second, microglia of these AD patients can more efficiently phagocyte Ab1 – 42. Removal of Ab1 – 42by microglia
is likely to decrease the propensity of Ab1 – 42to aggregate and
deposit. In AD patients, the levels of Ab1 – 42 in the CSF are
lowered quite early after clinical disease onset or possibly even before (16). This is explained by the intrinsic tendency of Ab1 – 42to form aggregates ranging from soluble oligomers to
ultimately insoluble senile plaques. Since this process is posi-tively correlated with the concentration of Ab1 – 42in the brain
parenchyma, decreased degradation of Ab1 – 42 will increase
the concentration of Ab1 – 42and concomitantly its tendency to
form aggregates. As a consequence of this process, the amount of Ab1 – 42that is available to escape into the CSF is lowered.
Therefore, stabilized SUCLG2 levels and concomitant micro-glial clearance may maintain higher Ab1 – 42CSF levels by
redu-cing the tendency of Ab1 – 42to aggregate in the brain.
Furthermore, microglial function may also be of relevance to cognitive performance, as suggested by recent experimental data, which showed that improved microglial clearance was pro-tective in terms of memory function (17). A plausible hypothesis is that improved microglial function may account for the stabil-ization of MMSE scores in rs62256378-A carriers. These find-ings are consistent with a number of previous reports, which have implicated innate immune activation and microglial clear-ance in sporadic AD.
Microglial phagocytosis of Ab1 – 42is highly energy dependent,
and most of this energy is provided by mitochondria. Alternatively, the effect of SUCLG2 on microglial clearance of Ab1 – 42may
be mediated by modulation of oxidative stress and inflammation. The latter is involved in Ab1 – 42clearance in the brain, in which
microglia participate actively by internalizing and degrading soluble (18) and aggregated forms of Ab1 – 42(19). On the other
hand, microglia have been identified as an important source of re-active oxygen species (ROS) (20). The mitochondrial respiratory chain is a major source of ROS. The association between inflam-mation and oxidative damage is mediated by the release of ROS during the inflammatory process. In old transgenic AD mice, microglial function is impaired, as shown by the decrease expression of Ab1 – 42-binding receptors and Ab1 – 42-degrading
enzymes, whereas microglia maintain their ability to produce pro-inflammatory cytokines (21). Thus, a chronic inflammatory status is produced, which increases oxidative stress and the accu-mulation of Ab1 – 42in the brain, and reduces the clearance of
Ab1 – 42. In addition, reducing oxidative stress in transgenic
AD mice has been shown to diminish amyloid plaque burden and microglial activation (22). The maintenance of mtDNA is crucial for mitochondrial function, since it encodes the key enzymes of mitochondrial respiration. Hence, the beneficial effect of the SUCLG2 A allele on the clearance of Ab1 – 42and
on the clinical course of AD may be mediated by improved respiratory chain and mtDNA maintenance, a compensatory mechanism which enhances mitochondrial function by reducing
Tabl e 5 . Ass ociation results for A b1–4 2 and rs622 56378 accordi ng to samp le and AP OE strata Stratum a rs b chr c bp d Minor e Major f Bonn1CSF Bonn2CSF ADNI ADC Meta-analysis b g SE h P i b g SE h b i b g SE h P i b g SE h P i b g SE h P i ALL rs429358 (e4) 19 45 411 941 1 4 1 4( 2 ) 2 0.51 0.11 6.1 × 10 2 6 2 0.33 0.07 5.9 × 10 2 7 2 0.39 0.15 0.01 2 0.70 0.15 1.1 × 10 2 5 2 0.40 0.05 4.3 × 10 2 17 ALL rs62256378 3 6 7 457 033 A G 2.13 0.46 2.5 × 10 2 5 0.82 0.24 6.0 × 10 2 4 0.50 0.29 0.09 0.61 0.13 1.9 × 10 2 6 0.71 0.10 2.5 × 10 2 12 APOE-1 4 noncarriers rs62256378 3 6 7 457 033 A G 1.68 0.57 4.8 × 10 2 3 0.96 0.36 8.8 × 10 2 3 0.66 0.43 0.14 0.94 0.24 1.1 × 10 2 4 0.97 0.17 1.5 × 10 2 8 APOE-1 4 heterozygous rs62256378 3 6 7 457 033 A G 0.24 0.30 0.44 0.45 0.22 0.04 0.48 0.49 0.33 0.32 0.15 0.03 0.35 0.11 1.5 × 10 2 3 APOE-1 4 homozygous rs62256378 3 6 7 457 033 A G – – – 2 0.13 0.33 0.71 2 0.10 0.76 0.90 0.01 0.25 0.96 2 0.04 0.19 0.83 aAnalysis of all patients and within strata defined by APOE-1 4 carrier status. brs number. cChromosome. dPhysical position in base pairs, according to dbSNP build 37. eMinor allele. fMajor allele. gEffect estimate from regression analysis. Represents increase in A b1– 4 2 levels in standard deviations per minor allele. hStandard error of effect estimate. iP -value; ADNI, Alzheimer’s Disease Neuroimaging Initiative cohort; ADC, Amsterdam Dementia Cohort.
microglial oxidative stress and pro-inflammatory activity. This in turn increases the clearance of Ab1 – 42and reduces the rate
of neuronal death.
Interestingly, while the evidence for interaction between SUCLG2 and APOE was strong in terms of the effect on Ab1 – 42
levels (P ¼ 9.5× 1025), no such interaction was evident in the analysis of clinical course (P ¼ 0.456). This may suggest that SUCLG2 contributes to Ab1 – 42 and clinical course through
(at least partially) independent pathways and that the pathway leading to variance in clinical course is not—or at least not strongly—influenced by APOE. This hypothesis is consistent with the lack of consistent evidence for an association between APOE genotype and clinical course, despite the very strong effect of APOE genotype on Ab1 – 42 levels and on disease
susceptibility.
Further studies are now warranted to disentangle the detailed molecular mechanisms underlying the influence of SUCLG2 on both Ab1 – 42levels and disease course.
MATERIALS AND METHODS GWAS samples
GWAS data on the CSF biomarkers Ab1 – 42and phosphorylated
pTau181 from three independent AD cohorts were analyzed
(Bonn1CSF, n ¼ 113; Bonn2CSF, n ¼ 167; ADNI, n ¼ 83). All AD dementia patients included in the GWAS analysis ful-filled NINCDS/ADRDA criteria for probable AD (23). The demographic data of the GWAS AD dementia patients are shown in Table1.
The Bonn1CSF and Bonn2CSF GWAS samples were derived from a larger German GWAS cohort (n ¼ 1079) which was recruited from the following three sources: (i) the German Dementia Competence Network (24) (DCN; n ¼ 391); (ii) the German study on Aging, Cognition and Dementia in primary care patients (25) (AgeCoDe, n ¼ 64); and (iii) the interdiscip-linary Memory Clinic at the University Hospital of Bonn (n ¼ 624). These German patients were classified as two separ-ate samples (i.e. Bonn1, n ¼ 438; and Bonn2, n ¼ 641), as they were genotyped using two different platforms (see below). The Bonn1CSF and Bonn2CSF samples were comprised of AD dementia patients from Bonn1 and Bonn2, respectively, for whom CSF data were available. The Bonn1CSF included 61 patients from the Memory Clinic and 52 from the DCN. The Bonn2CSF consisted of 84 patients from the Memory Clinic and 83 from the DCN.
Between 2003 and 2005, the DCN recruited a large cohort of patients with MCI (n ¼ 1095 patients) or early AD (n ¼ 391). Baseline analysis comprised extensive neuropsychological tests including those of the Consortium to Establish a Registry for Alzheimer’s Disease (CERAD), the MMSE and the Clinical Dementia rating (CDR-SB). Follow-up assessments were per-formed at 12 and 24 months (24). Whole blood, genomic DNA, plasma and CSF were collected from all participants.
AgeCoDe is a German multicenter prospective cohort study. The sample was drawn at random from general practice regis-tries in six German cities, and the selected individuals were contacted by mail. Main inclusion criteria were age 75 years or above and the absence of dementia according to the clinical judg-ment of the respective general practitioner. A total of 3327
Tabl e 6 . Effect of rs62 256378 on decline in MMS E score accor ding to samp le and APOE strata Stratu m a rs b Allele Bon n1 Bonn2 ADN I ADC Meta-analysi s Minor Ma jor b c SE d P e b c SE d P e b c SE d P e b c SE d P e b c SE d P e ALL rs622 5637 8 A G 0.57 0.32 0.08 0.66 0.64 0.15 0.24 0.21 0.11 0.2 8 0.1 6 0.08 0.32 0.12 3.1 × 10 2 3 APOE -1 4 nonca rriers rs622 5637 8 A G 0.57 0.46 0.23 0.26 0.93 0.39 0.01 0.23 0.50 0.6 1 0.2 5 0.02 0.32 0.16 0.021 APOE -1 4 heterozygous rs622 5637 8 A G 0.38 0.56 0.25 1.07 1.03 0.16 0.43 0.42 0.15 0.1 8 0.2 8 0.29 0.31 0.21 0.072 APOE -1 4 homoz ygous rs622 5637 8 A G 2 0.36 1.10 1.00 1.38 2.15 0.25 1.23 0.92 0.14 0.2 9 0.4 5 0.26 0.40 0.37 0.141 a Analysis of all pat ients and wi thin st rata defined by AP OE-e4 car rier status. bPhy sical positio n in base pairs, acco rding to dbSNP build 37 . c Effect ob tained fr om regression analysi s. The b represents attenuation of memo ry decli ne as shown by st andard dev iations of MMSE sco re decli ne. dStanda rd er ror of effect est imate. e One-sided P -valu e for rs622 56378-A as the pro tective allel e.
AgeCoDe participants were recruited between January 2002 and November 2003 (25,26). Each participant is assessed at baseline and at 18 months intervals thereafter. All assessments are per-formed at the participant’s home by a trained study psychologist or physician. At all visits, assessment includes the Structured Interview for Diagnosis of Dementia of Alzheimer type, Multi-Infarct Dementia and Dementia of other etiology according to DSM-IV and ICD-10 (SIDAM) (27). The SIDAM comprises: (i) a 55-item neuropsychological test battery, including all 30 items of the MMSE and assessment of several cognitive domains (orientation, verbal and visual memory, intellectual abilities, verbal abilities/ calculation, visual – spatial construc-tional abilities and aphasia/ apraxia); (ii) a 14-item scale for the assessment of the activities of daily living (SIDAM-ADL-Scale) and (iii) the Hachinski Rosen Scale. Dementia was diag-nosed according to DSM-IV criteria. The AgeCoDe study was approved by all of the respective ethics committees. Written informed consent was obtained from all study participants or their legal guardians. At the time of writing, four waves of follow-up have been completed in the AgeCoDe cohort.
The interdisciplinary Memory Clinic of the Department of Psychiatry and Department of Neurology at the University
Hospital in Bonn provided further patients (n ¼ 624). Diagnoses were assigned according the NINCDS/ADRDA criteria (23) and on the basis of clinical history, physical examination, neuro-psychological testing (using the CERAD neuroneuro-psychological battery, including the MMSE), laboratory assessments and brain imaging.
The third GWAS sample was a subsample of the Alzheimer’s Disease Neuroimaging Initiative (ADNI) cohort. This com-prised 83 AD dementia patients of non-Hispanic Caucasian origin for whom CSF biomarker data were available. The ADNI is a $60 million, 5-year public-private partnership which was launched in 2003 by the National Institute on Aging, the National Institute of Biomedical Imaging and Bio-engineering, the Food and Drug Administration and various private pharmaceutical companies and non-profit making orga-nizations. The Principal Investigator of this initiative is Michael W. Weiner, MD. ADNI is the result of the efforts of many coin-vestigators from a broad range of academic institutions and private corporations, and subjects have been recruited from over 50 sites across the USA and Canada. The initial goal of ADNI was to recruit 800 adults aged 55 – 90 years, i.e. 200 cog-nitively normal individuals for 3-year follow-up, 400 individuals
Figure 2. Functional studies of SUCLG2. (A and B) SUCLG2 localized to microglia in AD brains. (A) Representative DAB immunostaining with SUCLG2 and HLA-DR (as a human microglial marker) in brain cortex of AD subjects. DAB-positive cells with characteristic romboidal nuclei (typically microglial cells) are indi-cated by arrows. Scale bars are 100 and 20 mm on the main and small images, respectively. (B) High-resolution confocal image of an area of frontal cortex from an AD dementia patient immune labelled with HLA-DR (green) and SUCLG2 (red). Plaque autofluorescence is visible in the blue channel and it is highlighted with a dis-continuous line. Most of the SUCLG2 is enclosed by the HLA-DR (arrow). The top panel shows several viewpoints of a 3D reconstruction of the same area, which is shown in the lower panel. (Scale is 10 mm.) (C) Increased levels of SUCLG2 in AD ApoE 3/3 brains. Soluble extracts from postmortem frontal cortex of AD dementia patients with ApoE 3/4 and ApoE 3/3 status plus age-matched healthy controls (CN) were probed with an antibody to SUCLG2. Expression levels were normalized to Hsp75 (CN, n ¼ 6; AD, 3/4, n ¼ 8; AD, 3/3, n ¼ 4). Data are presented as mean + SEM. Asterisk denotes P , 0.05. (D) SUCLG2 silencing is detrimental to extra-cellular Ab1 – 42. FAM-Ab1 – 42phagocytosis was impaired in BV2 cells in which SUCLG2 was silenced by two distinct siRNA compared with negative control siRNA (n ¼ 6). FAM-Ab1 – 42was added at a 500 nMfinal concentration and the amount of internalized Ab1 – 42was assessed at the indicated time points, showing that cells contain less Ab1 – 42in the absence of SUCLG2. Data are presented as mean + SEM. Asterisk denotes P , 0.05.
with MCI for 3-year follow-up and 200 individuals with early AD for 2-year follow-up. Up-to-date information on the cohort is available at www.adni-info.org. All AD dementia patients ful-filled NINCDS/ADRDA criteria (23), and their magnetic reson-ance imaging (MRI) data were consistent with this diagnosis. ADNI participants undergo evaluation at 6- to 12-month inter-vals through a battery of assessments including cognitive and neuropsychological testing, neuroimaging (MRI with or without positron emission tomography) and measurement of plasma and CSF biomarkers. Among other instruments, cogni-tive status is assessed using the MMSE score. The ADNI study is approved by the Institutional Review Board at each of the par-ticipating centers, and all participants provide written informed consent. Data used in the preparation of the present study were obtained from the ADNI database.
Replication sample
These patients were drawn from the ongoing memory-clinic-based ADC of the VU University Medical Center. All patients underwent a standardized 1-day assessment, comprising medi-cal history, informant based history, physimedi-cal and neurologimedi-cal examination, laboratory tests, neuropsychological assessment and brain MRI. Probable AD diagnoses were assigned according to both NINCDS/ADRDA criteria (23), and the core clinical NIA-AA criteria (28). Follow-up took place during routine clin-ical attendance at the memory clinic, and involved patient history, cognitive testing including the MMSE, and a general physical and neurological examination. Patients who failed to attend routine follow-up for at least 2 years after baseline were contacted by telephone, and their cognitive status was evaluated using a standardized interview that included questions concern-ing all cognitive domains, physical complaints and medical history, complemented by the Telephone Interview for Cogni-tive Status (29). In cases where the telephone interview sug-gested clinical progression, patients underwent a detailed evaluation at the outpatient clinic.
Investigation of rs62256378 in AD risk
A case – control sample was used to investigate whether rs62256378 confers AD risk. The AD dementia patients were derived from the Bonn1 and Bonn2 samples (n ¼ 1079). The control sample was mainly comprised of individuals from three population-based studies: the Heinz Nixdorf Recall (HNR) study cohort (n ¼ 1188) (30), the POPGEN biobank (n ¼ 471) (31) and the KORA study (n ¼ 458) (32). These con-trols were not screened for cognitive impairment. Furthermore, 287 healthy elderly individuals from the AgeCoDe cohort, in whom dementia and MCI had been excluded at the last follow-up visit, were also included. The demographic data for these samples are provided in Table1. In addition, Stage I association results for rs62256378 were obtained from a case – control meta-analysis study conducted by the IGAP (6). In Stage I of this meta-analysis 17 008 AD cases and 37 154 controls were analyzed. In addition, APOE-14 carrier – noncarrier stratified association results were obtained from the IGAP.
Investigation of rs62256378 in cognitive decline
The effect of rs62256378 on cognitive decline in AD dementia patients was explored using longitudinal MMSE scores in AD dementia patients from: the Bonn1 (n ¼ 80), Bonn2 (n ¼ 110), ADNI (n ¼ 140) and the ADC (n ¼ 339). The effect of APOE-14 carrier – noncarrier status on the rs62256378 effect on MMSE progression was also analyzed.
CSF collection and analysis
For the Bonn1CSF and Bonn2CSF samples, diagnostic lumbar punctures were performed at the respective Department of Neur-ology or Psychiatry using a standardized technique. The subject was placed in a sitting or supine position, and a 22G atraumatic spinal needle was inserted. The CSF samples were kept on ice for a maximum of 1 h and then centrifuged for 10 min (2000 g at 48C). Samples were aliquoted to 0.25 ml and stored in polypro-pylene tubes at 2808C until analysis. All CSF samples were sent to the Department of Psychiatry in Erlangen for quantification. Levels of Ab1 – 42and pTau181were measured using commercially
available ELISA immunoassays INNOTESTw
b-amyloid(1 – 42)
and INNOTESTw
PhosphoTAU(181p)(Innogenetics), in
accord-ance with the protocols described by Popp et al. (33).
In the ADNI cohort, lumbar puncture was performed using a 20G or 24G spinal needle, as described in the ADNI procedures manual. In brief, CSF was collected into collection tubes pro-vided to each site. The CSF samples were then transferred into polypropylene transfer tubes and placed on dry ice within 1 h of collection. They were then shipped overnight to the ADNI Biomarker Core Laboratory at the University of Pennsylvania Medical Center on dry ice. After thawing for 1 h at room tem-perature and gentle mixing, aliquots (0.5 ml) of these samples were prepared. The aliquots were stored in bar code-labelled polypropylene vials at 2808C. CSF levels of Ab1 – 42 and
pTau181 were measured using the multiplex xMAP Luminex
technology (Luminex Corp) and INNO-BIA AlzBio3 immu-noassays (Innogenetics) according to protocols described else-where (1).
In the ADC cohort, lumbar puncture was performed using a 25G needle. The CSF was collected in polypropylene tubes and centrifuged at 1800 g for 10 min at 48C. The CSF was imme-diately stored at 2208C until further analysis (maximum 2 months). CSF levels of Ab1 – 42and pTau181were measured
using similar commercial ELISA immunoassays to those used for Bonn1CSF and Bonn2CSF. Quantification was performed in the neurological laboratory of the VU University Medical Center in Amsterdam in accordance with the protocols described by Mulder et al. (34).
Standardization of CSF biomarker levels was necessary since values in the ADNI cohort differed substantially from those observed in the Bonn1CSF, Bonn2CSF and ADC cohorts, due to the different platforms used (regular ELISA versus Luminex). Individual CSF levels were standardized within each study using a standard normal transformation. In all four cohorts, the CSF biomarkers Ab1 – 42and pTau181data showed
Genotyping
The Bonn1CSF sample was genotyped on the Illumina 610-quad chip, and was part of the sample investigated by Harold et al. (35). The Bonn2CSF sample was genotyped using the Illumina Omni 1M-quad chip. The ADNI cohort was genotyped using the Illumina 610 chip.
The control sample of Bonn1 was genotyped using the Illu-mina HumanHap550k chip. The control sample of Bonn2 was genotyped with the Illumina 1M-quad chip.
Genotyping in the ADC sample was performed using the Mas-sArray system and a Sequenom Compact MALDI-TOF device (Sequenom). SNPs were selected for the replication step if they modulated either Ab1 – 42 or pTau181 with a P-value of
,5× 1026 and showed consistent allele direction across all three GWAS. A total of 163 SNPs representing 36 novel loci met these criteria. Successful Sequenom assay design was achieved for 40 SNPs. These included rs429358, which charac-terizes APOE-14 versus APOE-14 noncarriers, and 30 SNPs representing 29 potentially novel loci. For seven of the 36 novel loci, design of a Sequenom assay failed due to technical reasons and a lack of additional proxies for the respective locus. SNPs representing the nine other known AD susceptibility genes were also included (Supplementary Material, Table S1) (35–38). Primer sequences and assay conditions are available upon request. Thus, a total of 40 SNPs were genotyped in the ADC cohort.
Since rs62256378 was imputed in the GWAS step, the SNP was genotyped directly in GWAS patients for whom DNA was available using Sequenom (Bonn1CSF, n ¼ 112 and Bonn2CSF, n ¼ 152).
Quality control
The Bonn1 sample was part of the sample investigated by Harold et al. (35) which comprised 19 000 samples prior to QC. Follow-ing strFollow-ingent QC, Harold et al. eliminated 53 383 SNPs and 2850 subjects from their data analysis. No German subjects were excluded. For the present analyses, a check was made for devia-tions from Hardy – Weinberg equilibrium within the German subgroup, and 55 SNPs with an HWE P , 1026were excluded. In the Bonn2 sample, seven individuals were excluded due to potential relatedness, as indicated by high genome-wide identity-by-state values (4 SDs greater than overall mean IBS). SNPs with a genotyping rate of ,99% were excluded. Four indi-viduals were also excluded due to a genotyping rate of ,99%. Finally, 88 SNPs were excluded due to deviation from HWE (P , 1026), and 80 000 SNPs due to low MAF (,1%). The QC criteria used for Bonn2 were applied to the entire ADNI cohort. In total, 24 individuals and 42 199 SNPs were excluded due to a low genotyping rate, 80 SNPs due to deviation from HWE, and 5961 SNPs due to low MAF.
The QC procedure applied to the population-based Bonn1 controls is described elsewhere (39). In this sample, 49 controls were removed due to a low genotyping rate. In addition, 80 con-trols were removed because they overlapped with the HNR control sample used in Bonn2.
In the ADC replication cohort, three samples were excluded due to a genotyping rate of ,95%. In addition, 101 individuals were excluded because their covariate APOE status was
unavailable. A total of five SNPs were excluded due to a low genotyping rate (,95%), strong deviation from HWE (P ¼ 1× 10238) or monomorphic status (Supplementary Material, Table S1).
Statistical analyses
For each of the three GWAS (Bonn1CSF, Bonn2CSF and ADNI), genotype data were imputed using the 1000 Genomes (40) reference data, May 2012 release, and the IMPUTEv2 soft-ware package (41). Imputed SNPs with an information score of ,0.4 or an MAF of ,3% were excluded. Imputation accuracy was satisfactory, with info scores of 0.61, 0.67 and 0.75, in Bonn1CSF, Bonn2CSF and ADNI, respectively. After imput-ation, a total of 6 812 394 SNPs were included in the initial GWAS step and the meta-analysis of the three GWAS. A com-plete (genome wide) set of summary association statistics for both Ab1 – 42and pTau181were deposited at http://intersnp.meb.
uni-bonn.de/CSF_AD.html.
To identify possible stratification within each cohort, a multidi-mensional scaling analysis was performed using PLINK (42). The three leading principal components were retained as covariates.
In each cohort, CSF levels were analyzed as quantitative traits (QTs) using an additive allelic linear regression model, as imple-mented in PLINK. Age, sex and APOE status—as defined by the number of APOE-14 copies—were additional covariates.
The association results were combined in a meta-analysis using the fixed effects model (43), as implemented in YAMAS (44). In addition, heterogeneity measures (45) were computed and meta-analysis was performed under a random effects model (43). Sig-nificance of cross-study differences in the b estimates for rs622 56378 was assessed using the x2-test for heterogeneity.
GWAS generated genome-wide inflation factors for Ab1 – 42
of l ¼ 1.012 in Bonn1CSF, l ¼ 1.005 in Bonn2CSF and l ¼ 1.05 in ADNI. For pTau181, GWAS produced genome-wide
inflation factors of l ¼ 1.006 in Bonn1CSF, l ¼ 1.013 in Bonn2CSF and l ¼ 1.001 in ADNI. The meta-analysis of the three GWAS data yielded genome-wide inflation factors of l ¼ 1.05 and 1.03 for Ab1 – 42and pTau181, respectively
(Sup-plementary Material, Fig. S3). Therefore, we decided to present l-adjusted P-values for the genome-wide analysis instead, and to validate any particular potentially genome-wide significant findings via Monte-Carlo simulation.
The experimental genotypes of the replication ADC cohort were analyzed with INTERSNP (46), and combined with the GWAS results in the meta-analysis fashion described above.
The explained variance was determined using the coefficient of determination R2of the linear regression model without the covariates that were used for P-value computation.
Two SNPs showing association with Ab1 – 42level were
repli-cated in the ADC, i.e. rs429358 at the APOE locus and rs62256378 at a novel locus containing the SUCLG2 gene. A possible genetic interaction between these two association signals was explored as an indicator of a possible biological link. For this, SNP – SNP interaction was analyzed using an allelic interaction test (one degree of freedom test, 1 d.f.). The standard genotype coding and definition of interaction para-meters provided by Cordell and Clayton (47) were used, as implemented in INTERSNP.
Case – control analysis was performed using a standard logis-tic regression test (1 d.f.). Cognitive decline was computed as DMMSE/Dt, where DMMSE was the difference in the MMSE scores between time point A and time point B, and where Dt was the time in days between time points A and B. DMMSE/Dt was then analyzed as a QT. Educational status and MMSE at time point A were used as additional covariates.
Human brain tissue
Postmortem human brain tissue specimens from patients with histologically confirmed AD and from age-matched controls who had died from non-neurological disease (75 + 10 years at the age of death) were obtained from the Neurological Tissue Bank of the Biobank from the Hospital Clinic-Institut d’Investi-gacions Biome`diques August Pi i Sunyer in Barcelona. Post-mortem duration varied from 1.5 to 5 h; neither age nor postmortem sampling time differed significantly between con-trols and AD dementia patients.
Immunohistochemistry
For colocalization of SUCLG2 in human brain cortex, tissue sec-tions were subjected to paraffin removal at 608C for 30 min, xylene treatment and rehydration through a graded ethanol series. Antigen unmasking was performed by heating the tissue sample to 1008C for 20 min in 10 mM sodium citrate
buffer (pH ¼ 6). Sections were incubated with rabbit anti-SUCLG2 antibody (Novus Biologicals, NBP1-32521) diluted to 1 : 400 and mouse anti-HLA-DR (Thermo scientific, MA1-35420) diluted to 1 : 100. Consecutive sections were further incubated with biotinylated secondary antibody, and signal amplification was achieved with HRP – streptavidin – biotin conjugates (Vectastain Elite ABC system). Diaminoben-zidine (DAB)-stained sections were then counterstained with hematoxylin. Brightfield images were then obtained using an axioplan microscope (Zeiss). In parallel, sections were incu-bated with Alexa 488 and Alexa 546-conjugated secondary anti-bodies and mounted on a dapi-containing mounting media (Vectorlabs). An attempt was made to quench autofluorescence. Hi-Res confocal images were obtained using a Leica SP5 Laser Scanning Confocal Microscope (Leica). Following deconvolu-tion, 3D reconstruction was performed using Huygens Scientific Volume Imaging.
Cell culture and transfection
BV2 murine microglial cells were obtained from the American Type Culture Collection. The cells were maintained at 378C in 5% CO2 DMEM medium, supplemented with 10% fetal calf
serum and 1% penicillin/streptomycin. The following were obtained from Invitrogen: three different Stealth siRNA directed to exons 4, 5 and 6 – 7 of SUCLG2 (5′-GCGGUUUGAAAGGA
GGUGUUCAUU-3′, 5′-CCCUGGAUAUUUCUAGAGAAA
CAUA-3′ and 5′-ACCAGGCUGCAGAUCAGAUUACAAA-3′); the recommended Stealth negative control; and the positive (GAPDH) control siRNA duplexes. Transfections were per-formed using lipofectamine 2000 (Invitrogen) in accordance with the manufacturer’s recommendations.
Western blot
Protein extracts from BV2 cells or frozen human brain tissue were homogenized in TNE buffer (10 mMTris – HCl, pH 7.4;
150 mMNaCl, 5 mMEDTA; 0.5% NP-40; 1× complete protease
inhibitor cocktail (Roche); 1× phosphatase inhibitor cocktail I and II (Sigma – Aldrich). Protein concentration was determined using the BCA method (Pierce Biotechnology). A total of 20 mg of protein was resolved by SDS – PAGE, transferred to PVDF and probed with rabbit anti-SUCLG2 antibody (Novus Biologicals, NBP1-32521) diluted to 1 : 500. Following over-night incubation, the membranes were rinsed three times in TTBS and incubated at 228C in 800CW donkey anti-rabbit sec-ondary antibody in 5% nonfat milk in TTBS, pH ¼ 7.5. The blots were visualized using an LI-COR Biosciences Odyssey infrared imaging system (Lincoln). After visualization, the blots were stripped through rinsing with TBS. They were then incubated at 558C for 30 min in a buffer containing 200 mMglycine, 2%
SDS and 100 mMmercaptoethanol. Membranes were rinsed in
TBS and then blocked and reprobed with mouse monoclonal anti-Hsp75 (UC David/NIH NeuroMab Facility, clone N52A/ 42) diluted to 1 : 1000; rinsed three times in TTBS; incubated at 228C in 800CW donkey anti-mouse secondary antibody in 5% nonfat milk in TTBS, pH ¼ 7.5; and visualized using the LI-COR system (Lincoln).
Phagocytosis of FAM-labeled Ab1 – 42(FAM-Ab1 – 42)
Following incubation of Ab1 – 42at 378C for 3 days, microglial
phagocytosis of aggregated FAM-Ab1 – 42(Anaspec) was
mea-sured using a plate-based assay. Control or SUCLG2-silenced BV2 cells were plated at 50 000 cells per 100 ml in black 96-well plates, and FAM-Ab1 – 42was added to a final
concentra-tion of 500 nMand incubated for 0, 2 or 4 h. The FAM-Ab1 –
42--containing medium was then removed and the remaining extracellular FAM-Ab1 – 42was quenched for 1 min with 100 ml 0.2% trypan blue in PBS, pH ¼ 4.4. Following aspiration, fluor-escence was measured at 485 nm excitation/535 nm emission using an Infinite 200 reader (Tecan). To normalize for cell numbers, 100 ml at 50 mg/ml Hoechst Dye 33342 in PBS was added and the sample was incubated for 30 min. Fluorescence was measured at 360 nm excitation/465 nm emission using the Infinite 200 reader (Tecan). In addition, microglial FAM-Ab1 – 42
phagocytosis was verified by confocal microscopy using a BX61 microscope equipped with a disc-spinning unit (Olympus).
SUPPLEMENTARY MATERIAL
Supplementary Material is available at HMG online.
ACKNOWLEDGEMENTS
We thank Dr Lara Buscemi from the Universite´ de Lausanne, Switzerland for her assistance with confocal microscopy. We also thank Dr Ellen Gelpı´ from the Neurological Tissue Bank of the Biobank of the Hospital Clinic-Institut d’Investigacions Biome`diques August Pi i Sunyer, Barcelona, Spain for providing postmortem human brain tissue from AD dementia patients and controls.
Conflict of Interest statement. None declared.
FUNDING
This work was supported by grants from the Bundesministerium fu¨r Bildung und Forschung (BMBF) (KND grant 01 GI 0422 and KNDD grant 01GI 0711), as well as grants from the Deutsche Forschungsgemeinschaft (DFG) (BE 3828/3-2 and BE 3828/ 4-1 to T.B., HE 3350/8-2 (KFO177) to M.T.H.), T.B., M.T.H. and M.M.N. are members of the DFG cluster of excellence ImmunoSensation. This work was also supported by the Biomar-kAPD Project of the Joint Programme—Neurodegenerative Disease Research by a grant from the BMBF (01ED1203D to P.L. and M.T.H.). Research of the VUmc Alzheimer center is part of the neurodegeneration research program of the Neurosci-ence Campus Amsterdam, the Netherlands. The VUmc Alzhei-mer Center is supported by AlzheiAlzhei-mer Nederland and Stichting VUmc fonds. The clinical database structure was developed with funding from Stichting Dioraphte. Data used in preparation of this article were obtained from the ADNI database (http://adni. loni.ucla.edu/). As such, the investigators within the ADNI con-tributed to the design and implementation of ADNI and/or pro-vided data but did not participate in analysis or writing of this report. Data collection and sharing for this project was funded by the Alzheimer’s Disease Neuroimaging Initiative (ADNI) (National Institutes of Health Grant U01 AG024904) and
DOD ADNI (Department of Defense award number
W81XWH-12-2-0012). ADNI is funded by the National Insti-tute on Aging, the National InstiInsti-tute of Biomedical Imaging and Bioengineering and through generous contributions from the following: Alzheimer’s Association; Alzheimer’s Drug Dis-covery Foundation; BioClinica, Inc.; Biogen Idec, Inc.; Bristol-Myers Squibb Company; Eisai, Inc.; Elan Pharmaceuti-cals, Inc.; Eli Lilly and Company; F. Hoffmann-La Roche Ltd and its affiliated company Genentech, Inc.; GE Healthcare; Inno-genetics, N.V.; IXICO Ltd; Janssen Alzheimer Immunotherapy Research & Development, LLC; Johnson & Johnson Pharma-ceutical Research & Development LLC; Medpace, Inc.; Merck & Co., Inc.; Meso Scale Diagnostics, LLC; NeuroRx Research; Novartis Pharmaceuticals Corporation; Pfizer, Inc.; Piramal Imaging; Servier; Synarc, Inc.; and Takeda Pharmaceutical Company. The Canadian Institutes of Health Research is provid-ing funds to support ADNI clinical sites in Canada. Private sector contributions are facilitated by the Foundation for the National Institutes of Health (www.fnih.org). The grantee organization is the Northern California Institute for Research and Education, and the study is coordinated by the Alzheimer’s Disease Co-operative Study at the University of California, San Diego. ADNI data are disseminated by the Laboratory for Neuro Imaging at the University of California, Los Angeles. This research was also supported by National Institute of Health (grants numbers P30 AG010129 and K01 AG030514).
AUTHORS’ CONTRIBUTIONS
Study concept and design: A.R., W.M.v.d.F., C.H., F.J., W.M., M.T.H., T.B., M.M.N. Acquisition data: A.R., W.M.v.d.F., C.H., D.R., S.H., P.L., J.P., A.L., D.D., P.H., R.H., L.B., Sherms, A.G., F.J., W.M., M.T.H., T.B., M.M.N. Sample
contribution: W.M.v.d.F., D.R., J.P., E.L., C.T., H.H., J.K., O.P., R.H., L.F., M.H., H.K., P.S., M.M.B., E.R., J.W., F.J., W.M., M.T.H. Data analysis: A.R., W.M.v.d.F., C.H., D.R., S.H., P.L., A.L., D.D., E.L., M.P.K., C.C., P.H., L.B., Sherms, M.M.B., F.J., W.M., M.T.H., T.B., M.M.N. Statistical analysis and interpretation: A.R., W.M.v.d.F., C.H., D.R., A.L., D.D., E.L., M.P.K., L.B., Sherms, F.J., W.M., M.T.H., T.B., M.M.N. Drafting of the manuscript: A.R., W.M.v.d.F., C.H., D.R., S.H., P.L., J.P., A.L., D.D., E.L., M.P.K., C.C., P.H., C.T., H.H., J.K., O.P., R.H., L.F., M.H., L.B., Sherms, H.K., P.S., M.M.B., E.R., J.W., A.G., F.J., W.M., M.T.H., T.B., M.M.N. REFERENCES
1. Kim, S., Swaminathan, S., Shen, L., Risacher, S.L., Nho, K., Foroud, T., Shaw, L.M., Trojanowski, J.Q., Potkin, S.G., Huentelman, M.J. et al. (2011) Genome-wide association study of CSF biomarkers Abeta1 – 42, t-tau, and p-tau181p in the ADNI cohort. Neurology, 76, 69 – 79.
2. Schjeide, B.M., Schnack, C., Lambert, J.C., Lill, C.M., Kirchheiner, J., Tumani, H., Otto, M., Tanzi, R.E., Lehrach, H., Amouyel, P. et al. (2011) The role of clusterin, complement receptor 1, and phosphatidylinositol binding clathrin assembly protein in Alzheimer disease risk and cerebrospinal fluid biomarker levels. Arch. Gen. Psychiatry, 68, 207 – 213.
3. Elias-Sonnenschein, L.S., Helisalmi, S., Natunen, T., Hall, A., Paajanen, T., Herukka, S.K., Laitinen, M., Remes, A.M., Koivisto, A.M., Mattila, K.M. et al. (2013) Genetic loci associated with Alzheimer’s disease and cerebrospinal fluid biomarkers in a Finnish case-control cohort. PLoS ONE, 8, e59676.
4. Han, M.R., Schellenberg, G.D. and Wang, L.S. (2010) Genome-wide association reveals genetic effects on human Abeta42 and tau protein levels in cerebrospinal fluids: a case control study. BMC Neurol., 10, 90. 5. Cruchaga, C., Kauwe, J.S., Harari, O., Jin, S.C., Cai, Y., Karch, C.M.,
Benitez, B.A., Jeng, A.T., Skorupa, T., Carrell, D. et al. (2013) GWAS of cerebrospinal fluid tau levels identifies risk variants for Alzheimer’s disease. Neuron, 78, 256 – 268.
6. Lambert, J.C., Ibrahim-Verbaas, C.A., Harold, D., Naj, A.C., Sims, R., Bellenguez, C., DeStafano, A.L., Bis, J.C., Beecham, G.W., Grenier-Boley, B. et al. (2013) Meta-analysis of 74,046 individuals identifies 11 new susceptibility loci for Alzheimer’s disease. Nat. Genet., 45, 1452– 1458. 7. Mattiace, L.A., Davies, P. and Dickson, D.W. (1990) Detection of HLA-DR
on microglia in the human brain is a function of both clinical and technical factors. Am. J. Pathol., 136, 1101– 1114.
8. Johnson, J.D., Mehus, J.G., Tews, K., Milavetz, B.I. and Lambeth, D.O. (1998) Genetic evidence for the expression of ATP- and GTP-specific succinyl-CoA synthetases in multicellular eucaryotes. J. Biol. Chem., 273, 27580 – 27586.
9. Ostergaard, E. (2008) Disorders caused by deficiency of succinate-CoA ligase. J. Inherit. Metab. Dis., 31, 226 – 229.
10. Silva, D.F., Selfridge, J.E., Lu, J., E, L., Cardoso, S.M. and Swerdlow, R.H. (2012) Mitochondrial abnormalities in Alzheimer’s disease: possible targets for therapeutic intervention. Adv. Pharmacol., 64, 83 – 126.
11. Miller, C., Wang, L., Ostergaard, E., Dan, P. and Saada, A. (2011) The interplay between SUCLA2, SUCLG2, and mitochondrial DNA depletion. Biochim. Biophys. Acta, 1812, 625 – 629.
12. Mawuenyega, K.G., Sigurdson, W., Ovod, V., Munsell, L., Kasten, T., Morris, J.C., Yarasheski, K.E. and Bateman, R.J. (2010) Decreased clearance of CNS beta-amyloid in Alzheimer’s disease. Science, 330, 1774. 13. Bradshaw, E.M., Chibnik, L.B., Keenan, B.T., Ottoboni, L., Raj, T., Tang, A., Rosenkrantz, L.L., Imboywa, S., Lee, M., Von Korff, A. et al. (2013) CD33 Alzheimer’s disease locus: altered monocyte function and amyloid biology. Nat. Neurosci., 16, 848 – 850.
14. Jiang, Q., Lee, C.Y., Mandrekar, S., Wilkinson, B., Cramer, P., Zelcer, N., Mann, K., Lamb, B., Willson, T.M., Collins, J.L. et al. (2008) ApoE promotes the proteolytic degradation of Abeta. Neuron, 58, 681 – 693. 15. Tokuda, T., Calero, M., Matsubara, E., Vidal, R., Kumar, A., Permanne, B.,
Zlokovic, B., Smith, J.D., Ladu, M.J., Rostagno, A. et al. (2000) Lipidation of apolipoprotein E influences its isoform-specific interaction with Alzheimer’s amyloid beta peptides. Biochem. J., 348, 359 – 365. 16. Tarawneh, R. and Holtzman, D.M. (2010) Biomarkers in translational
research of Alzheimer’s disease. Neuropharmacology, 59, 310 – 322.