Publisher’s version / Version de l'éditeur:
ASTM Special Technical Publication, 217, pp. 32-46, 1958-02-01
READ THESE TERMS AND CONDITIONS CAREFULLY BEFORE USING THIS WEBSITE. https://nrc-publications.canada.ca/eng/copyright
Vous avez des questions? Nous pouvons vous aider. Pour communiquer directement avec un auteur, consultez la
première page de la revue dans laquelle son article a été publié afin de trouver ses coordonnées. Si vous n’arrivez pas à les repérer, communiquez avec nous à [email protected].
Questions? Contact the NRC Publications Archive team at
[email protected]. If you wish to email the authors directly, please see the first page of the publication for their contact information.
NRC Publications Archive
Archives des publications du CNRC
This publication could be one of several versions: author’s original, accepted manuscript or the publisher’s version. / La version de cette publication peut être l’une des suivantes : la version prépublication de l’auteur, la version acceptée du manuscrit ou la version de l’éditeur.
Access and use of this website and the material on it are subject to the Terms and Conditions set forth at
Unbalance errors in guarded hot plate measurements
Woodside, W.; Wilson, A. G.
https://publications-cnrc.canada.ca/fra/droits
L’accès à ce site Web et l’utilisation de son contenu sont assujettis aux conditions présentées dans le site LISEZ CES CONDITIONS ATTENTIVEMENT AVANT D’UTILISER CE SITE WEB.
NRC Publications Record / Notice d'Archives des publications de CNRC:
https://nrc-publications.canada.ca/eng/view/object/?id=e3d24ac4-8e8a-4199-a556-77f6ca10b4ef https://publications-cnrc.canada.ca/fra/voir/objet/?id=e3d24ac4-8e8a-4199-a556-77f6ca10b4ef
S e r
TH1
N2lr2
no.
48
c . 2
NATIONAL
RESEARCH
COUNCIL
C A N A D A D I V I S I O N O F B U I L D I N G R E S E A R C H - BUlLDlNG RESEARCH
'\
-
LIBRARY
-
RY,R
4
1958
L X T ' I O N A L RESEARCH COUNCIL)
N R C 4 4 5 0UNBALANCE ERRORS IN GUARDED HOT PLATE
MEASUREMENTS
BY W I L L I A M WOODSIDE AND A. G. W I L S O N R E P R I N T F R O M A M E R I C A N S O C I E T Y F O R T E S T I N G M A T E R I A L S S Y M P O S I U M O N T H E R M A L C O N D U C T I V I T Y M E A S U R E M E N T S A N D A P P L I C A T I O N S O F T H E R M A L I N S U L A T I O N S A S T M S P E C I A L T E C H N I C A L P U B L I C A T I O N N O 217 1957 P 3 2 46 R E S E A R C H P A P E R NO. 48 O F T H E D I V I S I O N OF B U I L D I N G R E S E A R C H OTTAWA F E B R U A R Y 1958 P R I C E 25 C E N T SThis p u b l i c a t i o n i s b e i n g d i s t r i b u t e d by
t h e D i v i s i o n o f Building Research of t h e N a t i o n a l
Research Council a s a c o n t r i b u t i o n towards b e t t e p
b u i l d i n g i n Canada.
I t
should n o t be reproduced
i n whole o r i n p a r t , w i t h o u t permission o f t h e o r i -
g i n a l p u b l i s h e r . The D i v i s i o n would be g l a d t o be
of a s s i s t a n c e i n o b t a i n i n g such p e d s s i o n .
F u b l i c a t i o n s of t h e D i v i s i o n o f Building
Research may be o b t a i n e d by m a i l i n g t h e a p p r o p r i a t e
r e m i t t a n c e ,
( a Bank, Ekpress, o r Post O f f i c e Money
Order o r a cheque ma.de paya.ble a t par i n Ottawa,
t o t h e Receiver General of Canada, c r e d i t N a t i o n a l
Research c o u n c i l ) t o t h e N a t i o c a l Research Council,
Ottawa.
S t a m p a r e not acceptabl-e.
A
coupon s y s t e m has been i n t r o d u c e d t o
make payments f o r p u b l i c a t i o n s r e l a t i v e l y simple,
Coupons a r e a v a i l a b l e i n denominations of
5,
25,
and
9
c e n t s ,
and may be obtained by making
are-
m i t t a n c e a s i n d i c a t e d above,
These coupons
may be
used f o r t h e purchase of a l l N a t i o n a l Research
C o u n c i l p u b l i c a t i o n s i n c l u d i n g s p e c i f i c a t i o n s o f
t h e Canadian Government S p e c i f i c a t i o n s Board.
Authorized Reprint from the Copyrighted Symposium on Thermal Conductivity llieasurements and
Applications of Thermal Insulations
Special Technical Publicaliotr No. 217
Published by the
AIIERIC,\S SOCIETY POR TESTIXG ~ ~ I \ T E R I : & L S
1957
UNBALANCE E R R O R S I N GUARDED HOT P L A T E MEASUREMENTS BY W. WOOD SIDE^ AND A. G. WILSON'
The errors in thermal conductivity measurement in three different designs of guarded hot plate caused by small temperature differences (unbalances) between test area and guard ring are described. The dependence of these errors upon: (a) the magnitude and direction of the unbalance, (b) the size and design of heater plate, (c) the conductivity and thickness of the specimens tested, and (d) the temperature difference between hot and cold plates is in- vestigated. The percentage error in measured conductivity is shown to increase as the conductivity of the specimens tested decreases. Errors as high as 6 per cent were obtained even when the ASTM balance requirement was satisfied. There are two constants for any heater plate which determine its error sensitivity to unbalance. If these constants are known, the maximum toler- able unbalance required to achieve any desired accuracy in measured con- ductivity may be calculated. The experimental determination of these con- stants, involving a minimum of two tests on each of two sets of specimens of different conductivity, is described.
T h e guarded hot plate is the most difference between the test area and widely used apparatus for the precise guard ring should not exceed 0.75 per determination of the thermal conduc- cent of the temperature difference be- tivity of insulating and other building tween hot and cold plates. One per cent materials. I t has been standardized b y is the limit specified by R I L E M 3 (I).( the ASTM.? During a test, the tempera- Gilbo (2), working with a n 8-by 8-in. ture of the guard ring is held as closely hot plate and testing 1-in. thick cork as possible to the test area temperature specimens with a deep groove cut into by either manual adjustment of the the faces of the specimens so that the guard ring heating current, or some heater contact area and guard contact system of automatic control. T h e ASTM area were separated found that a tem- method of test requires t h a t during the perature difference or unbalance between 5-hr equilibrium period the temperature the test area and guard ring of 0.2 F caused a n error in the conductivity of
'
Research Oficer arid I-Iead respective y. -Building Services Section, Division of Building 3 R6union Intert~ationale cles Lahoratoircs
Itcsearch, Nntioual ltesearcli Council of Can- d'Essais e t de Recherches s u r les b?ati.riaux e t adn, Ottawa, Canacla. les Constructions (RILEM). An iilternatioilal
3lcthocl of Test for Thermal Corlcluctivity ii>aterials testing organisation.
of IIaterials by Atcans of tlie Guardecl H o t " T h e holdface ilunlhers i n parentheses refer Plate (C 177 - 4 9 , 1955 Book of ASTI1 Stand- t o tlie list of references appended t o this paper, ards, P a r t 3, p. 1084. see p. 46.
3 2
3 per cent. The temperature difference between hot and cold plates was not stated. He attributed part of the dis- agreement among results of several lab- oratories to lack of temperature balance between test area and guard ring.
Roux et a1 (3) investigated the errors due to unbalances of the order of 0.03 F in their 12-in. hot plate, using four different materials. They concluded that such an unbalance would produce errors of 0.1 per cent for a cement plaster
( k = 7.06), 0.16 per cent for yellow- wood ( k = 1.00), 0.27 per cent for masonite insulation board ( k = 0.40), and 0.52 per cent for cork ( k = 0.30 Btu in. per hr sq f t deg Fahr).
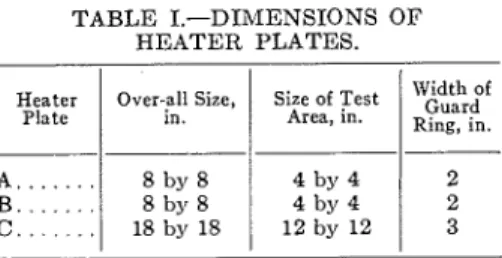
TABLE I.-DIMENSIONS OF HEATER PLATES.
low lateral thermal resistance, errors caused by a given unbalance are large compared with those for a similar plate with an air gap. For example, Pascal, in testing cork 10 cm thick, found an error of 35 per cent in conductivity due to an unbalance of 1 per cent of the temperature difference between hot and cold plates.
This present paper deals with the unbalance errors of three different de- signs of guarded hot plates and the factors that influence these errors. It is shown how errors due to unbalance may be calculated, knowing two constants for the hot plate and the conditions under which the test is performed. A method for the simple determination of these constants is described.
More recently Pascal (4) also noted that the error due to unbalance depended upon the conductivity of the specimen tested, being greater the lower the con- ductivity. The test and guard areas of his 50-by 50-cm hot plate were separated by a 3-mm thickness of araldite insula- tion. By calculating the lateral heat flow directly through this araldite sep- arator for a given unbalance. he obtained the maximum allowable unbalance for any desired precision in the conductivity determination and for any power input to the test area. This, however, neglected the lateral flow through the specimens themselves. Pascal recognized that a 3-mm air gap would have a thermal resistance to lateral flow six times as great as his 3-mm araldite gap, but retained the araldite for reasons of sur- face continuity and mechanical strength of the plate. However, as a result of this
Heater
Plate
A B
c
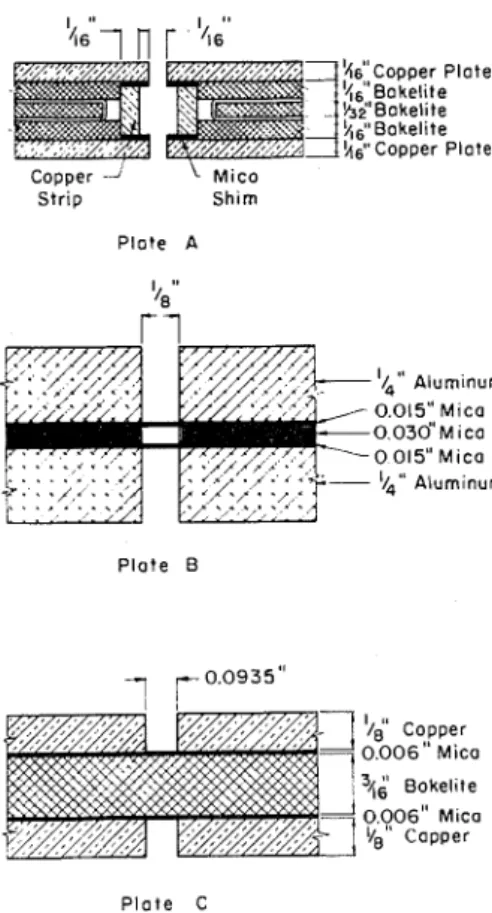
is patterned after the U. S. National Bureau of Standards (NBS) modified guarded hot plate apparatus originally described by van Dusen (5) and has a &-in. gap separating test and guard areas, with &-in. thick copper surface plates. Plate B is similar to one designed and used successfully a t the University of Saskatchewan and is very much simpler and less expensive to coilstruct than the NBS design. I t has a $-in. gap between test and guard areas and
1 '
~ - 1 n . thick aluminum surface plates. Both heater plates A and B were used in conjunction with cold plates of NBS design. Plate C has been used by the National Research Laboratories for several years and has been described by Niven ( 6 ) . I t has +-in. thick copper sur-
face plates. The gap width of plate C is not uniform, being greater a t the top of the test area than at the other three the plates are shown in Table I. Plate A Over-,all Size, ~n 8 by 8 8 by 8 18 by 18 Size of Test Area, in. 4 by 4 4 by 4 12 by 12
'%.;dof
APPARATUS R ~I n ~ ~ ,The three heater plates tested for sensitivity to thermal unbalance be- 2 tween the test area and guard ring were supported vertically. The dimensions of
sides and varying between 0.121 and 0.082 in. The average gap width is 0.0935 in. The details a t the gaps of the three heater plates are shown in Fig. 1.
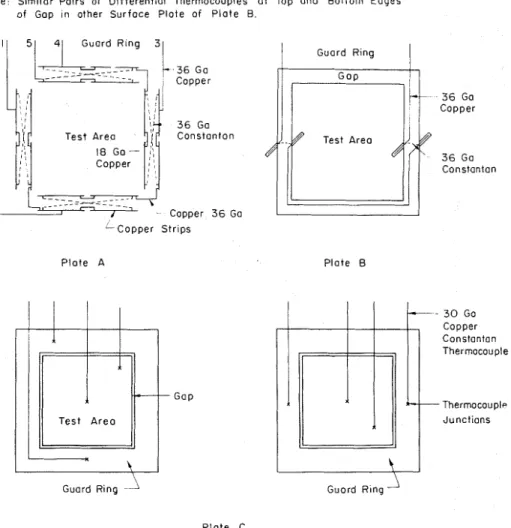
The temperature difference between test area and guard ring is measured differently in each of the heater plates,
ZZ'ZZ37 kgl'copper Plate
In all the test work to be described. the guard-ring heater current was con- trolled manually to produce thermal balance or any desired unbalance be- tween test and guard areas.
The source of direct current supplied to the heater plates is a motor-generator set with an output of 110 v. This is regulated and controlled by d-c voltage regulator-controller assemblies based on
Copper -i Mico S t r i p Shim Plote A I$'' Aluminum 0.015" Mico 0.03d'~ ica 0 015" Mico '4" A l u r n i n u n Plate B
a circuit designed by Dauphinee and Woods (7) which reduce voltage fluctua- tions by a factor of 100 and permit continuous variation of the regulated output fed to the heaters from 0 to 70 v. The cold plates are supplied with a water-ethylene glycol mixture from a 90-gal reservoir containing heating and cooling units and automatically main- tained by a mercury thermostat a t any desired temperature to better than
f 0.1 F.
In all tests the edges of the specimens were e x ~ o s e d to the ambient air in the laboratory. The laboratory was con- ditioned to 73 f 1 F and to relative humidities below 15 per cent.
P l a t e C
FIG. 1.-Details at Gaps of Heater Plates.
as shown in Fig. 2. In plate A the un- balance is measured by four differential thermocouples in series, to &0.0012 F. I n plate B the unbalance is measured by two sets of two differential thermo- couples in series, to f 0.0024 F. In plate C, the unbalance is taken as the difference between the temperature aver- ages of the four guard ring and four test area thermocouples and is measur- able to f 0.005 F.
i\'Iaterials tested in the three sets of hot plate apparatus included the follow- ing in order-of increasing conductivity: silica aerogel, rock wool batt insulation, expanded polystyrene, cellular poly vinyl-chloride, fiberboard, plywood, cellular concrete, Lucite, sand, and rubber, so that a range of thermal con- ductivity from 0.15 to 2.30 Btu in. per hr sq f t deg Fahr was covered. speci- mens of the materials that are moisture sensitive were conditioned to constant weight in a ventilated oven at 140 F
prior to each test. All tests were per- formed a t a mean temperature of 75 F.
The specimens were installed in the apparatus and a test performed to de- termine their apparent conductivity with a temperature unbalance between
~ O O D S I D E AND ~VILSON ON UNB.~LANCE ERRORS IX GUARDED HOT PLATE 3.5
test area and guard ring. When the varied between +3.0 and -3.0 F, taking temperature difference between hot and the positive sign to indicate that the cold plates, the temperature difference test area was a t a higher temperature between test and guard areas, and the than the guard ring. Thus for each value
Note S ~ m ~ l o r P a ~ r s of D ~ f f e r e n t ~ o l Thermocouples a t Top and Bottom Edges of Gap In other Surfoce P l o t e of P l a t e B
I / 51 41 Guord Ring 3 ! Copper 3 6 Ga 'Copper S t r ~ p s P l a t e A
/
Guard Ring Plate B 3 6 Ga Copper 3 6 Ga Constontan Constantan GapGuard Ring Guord R ~ n g -I\
P l o t e C
FIG. 2.-Thermocouples U s e d t o M e a s u r e T e m p e r a t u r e Unbalance. power input to the test area had re-
mained constant for a 5-hr period, the apparent thermal conductivity, k,,
,
was calculated. This was repeated several times, each time with a different tem- perature unbalance between test and guard areas, but with all other con- ditions unchanged. The unbalances
of the unbalance A0 a value of the apparent conductivity Kc,, was obtained. Since all other conditions such as mean temperature, density, and moisture con- tent were held constant in each test series, the variation of k,, was caused only by the variation of AO.
three different sets of apparatus and for each material tested.
In addition, several tests were per- formed, in which the hot plate to cold plate temperature difference 0 was varied as well as the unbalance.
To determine the effect of specimen thickness upon unbalance errors, Lucite was tested with plate A a t two different thicknesses3 in. and 2 in. The ASTM limits specimen thicknesses to 1 in. for a
and A0 shown in this figure is typical of the results obtained with all plates and all specimens tested. The true value of the thermal conductivity k is taken to be the value of k,, when A0 = 0 and can be read directly from the graph. As can be seen, excellent agreement between the three plates was obtained. When the guard ring is a t a higher temperature than the test area, that is, for A0
<
0, the test area receives heatFIG. Plates. All 0.36 0.34 0
:
0.32 Y.<
0 . 3 0 - .--
0heater plate of dimensioils equal to those of plate A. However, the 2-in. Lucite specimens were being tested as part of another test series designed to determine errors due to edge heat loss to the ambi- ent air, and it was therefore convenient to use them for the unbalance tests.
from the guard section, and hence a smaller power input
Q,,,
to the test area is required to maintain a given tempera- ture gradient through the specimen. This means that for A0<
0 the measured thermal conductivity kc,, is less than the true conductivity k, since for A0 # 0, k,,, = Q,, L / A 0 ; 5 and for A0 = 0,In Fig. 3, kc, is plotted against A0 for rock wool batt insulation tested with the three different heater plates. The straight-line relationship between k,,,
I I I
,
1 - --
,' 0.28 0 - u-,
0 . 2 6 - - 0.16 I II
I I I l l W h e r e :Q = total heat input to test area, Btu per hr, when A0 = 0,
&,,
, = total heat illput to test area, Btu per hr, when A0 Z 0.
A = test area, sq f t (both faces of heater plate),
L = specimen thickness. in. - - - I I I -1.6 -1.2 -0.8 -0.4 0 0.4 0.8 1.2 1.6 2.0 2.4 2.8 3.0 Unbalance, d e g Fahr
3.-Effect of Temperature Unbalance on Measured Conductivity of Rock Wool for
h4#/
(J-
I - Plate A ( / " B = Rockwool) 4 0 F - - - - - - - Guard Cooler I l l - I I I I I I Ik = QL/A0. The reverse holds for with plate A, the test being conducted A8
>
0, that is, when the guard is with zero guard ring power input. This cooler than the test area, k,,>
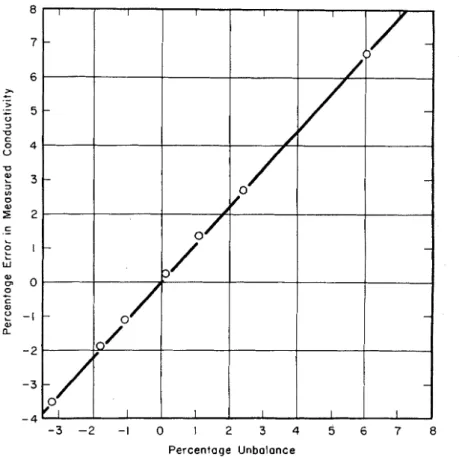
k. test gave a n error of 76 per cent in con- I n Fig. 4, Ak X 100/k, the percentage ductivity a t A0 X 100/0 = +60. Byerror in conductivity caused by an un- extrapolating the line in Fig. 4 to this balance A0 is plotted against A0 X 100/0, value of A0 X 100/0, a n error of 69 per the unbalance expressed as a percentage cent is found. Thus the error remained
Percentage Unbalance
FIG. 4.-Percentage Error in Measured Conductivity, Determined a t Several Temperature Dif- ferences Between Hot and Cold Plates, aerszw. the Unbalance Expressecl as a Percentage of the Temperature Difference.
of the temperature difference between hot and cold plates, for plate A and $-in. fiberboard. The temperature difference 0 was varied between 39 and 58 F in these tests. As can be seen from this figure, the error is directly proportional to A0
x
lOO/0 over the range covered (approximately -3.0 to +6.0 per cent). To determine if Ak/k is proportional to A0 for larger unbalances, a single test was performed on the same specimenapproximately proportional to A0 even for the highest positive unbalance attain- able in this test. In Figs. 5, 6, and 7, Ak X 100/k is plotted against A8 X 100/0 for plates A, B, and C, respec- tively, for all specimens tested.
When a temperature difference exists between the central test area and the guard ring, not only will heat be trans- ferred directly across the gap, but also heat, which originated in the test area
2 0
1 6
A I " Expanded Polystyrene 8-
1 2
Z 0
!!in
Fibreboard 8 = 3 9 F ond-
.- > .- +3/4'
Plywood 8 = 4 0 F t 8 8 I " Cellular Concrete 8 = 4 0 F D c 3/4' Lucite 8 = 4 0 Fs
e I " Sand 8. 4 0 F C .- 0 ? W w - 4 rn 0.-
C - 8 L al a - 1 2 - 1 6 - 2 0 - 8 - 7 - 6 - 5 - 4 - 3 - 2 - 1 0 1 2 3 4 5 6 7 8 Percentage Unbalance IFIG. 5.-Percentage Error in Measured Conductivity versw Percentage Unbalance for Mate- rials Tested with Plate A.
0 34" S ~ l l c a Aerogel 8 = 3 5 F + I/." Flbrebaard 8 = 40 F
3/411
L u c ~ t e 8 = 40 F I " Rubber 8 = 40 F '14" E x p a n d e d Polyvinyl C h l o r ~ d e 8 = 12 F P e r c e n t a g e UnbalanceFIG. 6.-Percentage Error in Measured Conductivity verstls Percentage Unbalance for Materials Tested with Plate B.
of the heater plate, will be conducted to guard ring area be denoted by q Btu through the specimens toward that part per hr. The total heat flow out of the of the cold plate which is opposite the test area will now be (Q
+
q).6 2 " sand 9 = 40 F
-8 - 6 - 4 - 2 0 2 4 6
Percentage Unbalance
FIG. 7.-Percentage Error in Measured Conductivity aerszw Percentage Unbalance for Material Tested with Plate C.
guard ring. This occurs when the un- When A0 = 0,
balance is positive; the reverse takes k = QL/AB. . . . (1 ) place with a negative unbalance. This
means that the heat flow and isothermal In the unbalanced condition, the ex- surfaces in the specimen will be dis- perimentally determined conductivity is: torted. I t is the sum of these two heat kcxp = (Q
+
q) L I A B . . . . .. ( 2 ) flows, that is, the heat flow directly
across the gap and that which is dis- .'.Ak = k,,, - k = qL/AB
placed out of or into the central test :.q = Q a k / k . . . . (3)
area section of the samples, which will
be termed "error heat flow" and which Or using Eq
results in an error in the measured con- q = A 0 a k / L . . . .
ductivity. The method for calculating (4) this error heat flow from the test results From the plot of k,, uerszcs AO, the error is described below. Ak in conductivity for any unbalance Let the normal heat flow from the A0 may. be obtained directly, and hence test area under balanced conditions be using Eq 4, q, the total error heat flow
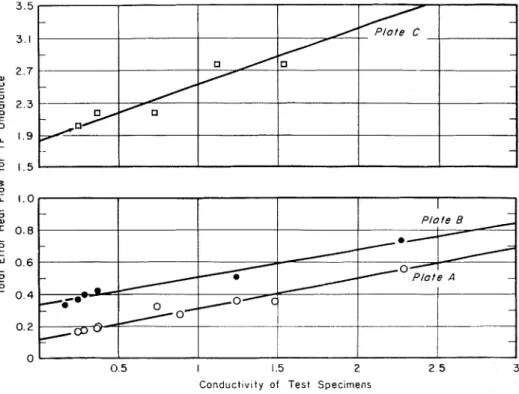
Q Btu per hr. Suppose that the guard for any unbalance AO, may be calculated. ring is A0 F cooler than the test area. Using Eq 4, q for a 1 F unbalance has Let the error heat flow from test area been calculated for each specimen tested
in each of the three plates. I n Fig. 8
these values are plotted against con- ductivity, and it is evident that q in- creases approximately linearly with k.
The scatter in the experimental points for plate C may be caused by the less accurate method of measuring unbal- ances in this heater plate. I n plate C, the thermocouples which detect the
across the gap when there is a 1 F tem- perature unbalance between test and guard areas. Thus qo is a plate constant which depends only on the size and design of the heater plate, and is one of the two characteristics of any guarded hot plate which determine its sensitivity to unbalance. The other is the slope of
the q versus k graph which is denoted by
-
iL-
1 0 0 m I O . 8 L 2 1; - 0 6 0-
'
0 4 0 2 0 0 5 I 15 2 2 5 3Conduct~v~ty of Test Speclrnens
FIG. 8.-Dependence of Total Error Heat Flow for a 1 F Unbalance upon Conductivity.
unbalance are not located adjacent to c. This second plate constant depends the gap but some distance from it only upon the size of the plate and the (Fig. 2), and hence when there is a gap width. Comparing the graphs of q
temperature gradient across the guard- versus for plates A and B, which are ring surface the unbalance measured is both of the same size but have different not the temperature difference directly gap widths, it is seen that the larger the width of the gap separating test and guard across the gap. areas, the smaller the value of c. The When k = 0, that is, when perfectly ASTI\{ method specifies in. as the
insulating specimens are placed on each ,,,imU, gap width. B~ making the side of the heater plate, q = qo
.
There- gap width larger, errors due to unbalance fore qo is the lateral heat transfer directly will be smaller, but the size of the testTABLE 11.-VALUES O F qo AND c FOR The dependence of q upon
k
can beTI-IE THREE PLATES.
(Btu per hr deg Fahr unbalance) represented by:
Unbalance, deg Fohr
Heater Plate
A . . . B . . . .
C . . . . .
FIG. 9.-Measured Conductivity of 2 in. Lucite Plotted Against Temperature Unbalance Be- tween Test and Guard Areas for Plate A.
. . .
q = q o + ~ k (5)
40 c
If one wishes to attach a physical mean-
0.120 0.192 ing to c, it may be defined as that por-
0.336
1.840 0.680
0.170 tion of the error heat flow which flows
area becomes more indefinite, and the distortion of the heat flow lines out of the test area, even under balanced con- ditions, becomes greater. The maximum specified gap width, however, should not be independent of the linear dimension of the test area. Specifying a maximum value for the ratio of gap width to lin- ear dimension of test area would appear to be more logical.
through a specimen of unit conductivity
caused by an unbalance of 1 F. Equation
5
shows the breakdown of the total error heat flow into its two component parts: ( a ) the heat transfer directly across the gap and (b) the error flow through the specimens themselves. For materials of low conductivity, qo is the more important factor. Table I1 shows the values of qo and c for the three plates.I t can now be seen why, when plotting mens the error for a given unbalance is
A k / k versus AO/O (Figs. 5, 6, and 7) less dependent upon k , as can be seen
different lines are obtained for materials from Figs. 5, 6, and 7.
of different conductivity. From E q 5 Equation 6 predicts that the percent-
Percentage Unbolonce
FIG. 10.-Relationship Between Percentage Error in Measured Conductivity and Percentage Unbalance, Based on Unit Thickness of Test Specimens, Showing the Effect of Conductivity upon the error.
the total error heat flow for a n unbal- age error in measured conductivity is ance A0 F is: proportional to the specimen thickness
q' = (40
+
ck)AR. tested. T o verify this, Lucite was testedin plate A a t two thicknesses-0.75 in.
Ak A = - - q' - ( q ,
+
ck)AR and 2.0 in.-and a t different degrees ofk Q ~ A R / L
'
unbalance. Whenor AR = -0.5, Ak = 0.016 for L =
4
in.Ak L A0
-
-
- - - (qo/k+
c ) . . . ( 6 )k A 0
Therefore for a given unbalance AO, the error A k / k increases as the conductivity of the material decreases if the other factors L and O remain unchanged. Thus the largest unbalance errors are obtained with low conductivity specimens, as ob- served by Roux et a1 ( 3 ) . As k increases,
qo/k becomes smaller in comparison to
c, and hence for high conductivity speci-
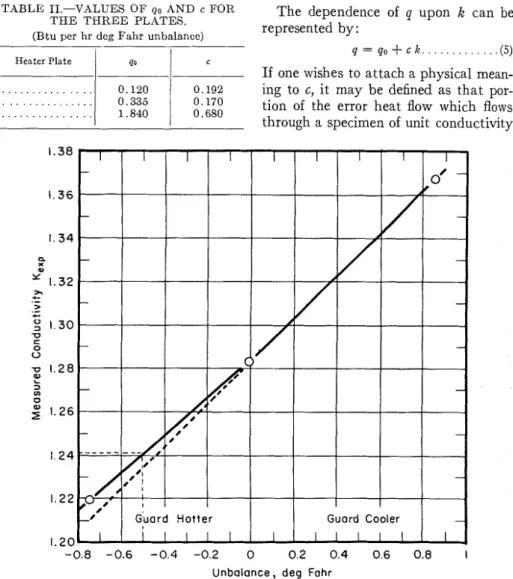
From Fig. 9, which is a plot of k,, versus A0 for the 2-in. specimen of Lucite, when A0 = -0.5 F, A k = 0.042 (for
L = 2 in.). Since 0.016 X 2.0
+-
0.75 =0.043, the test verifies that the error in conductivity due to unbalance is directly proportional to the specimen thickness.
I n Fig. 9, the value of k at AO = 0 (1.28) is greater than the value obtained with the $-in. specimen (1.24), due to the greater heat loss from the specimen
edges in the case of the thicker specimen. Also it is seen that larger errors result when the guard ring is cooler than the test area than when it is warmer by the same amount. The reason for this asym- metry is the edge heat loss which acts in the same direction as a positive un- balance and which can be counteracted by a negative unbalance. From Fig. 9, it is apparent that a -0.5 F unbalance would exactly nullify the effect of the edge heat loss. This asymmetry effect
for fiberboard (k = 0.372) has a smaller slope than the lines for plywood and cellular concrete which have higher conductivities (0.743 and 0.890 respec- tively). This is because the specimens were all of different thicknesses. The results can be reduced to a common thickness, say 1 in., by multiplying Ak/k by 1/L before plotting against AO/O. This has been done for plate A in Fig. 10, where the slopes of the lines decrease as k increases.
Percentage Unbalance
FIG. 11.-Percentage Error in Conductivity for Specimens of Unit Thickness Due t o Error Heat Flow in the specimens only, Plotted Against Percentage Unbalance, Showing the Linear Relation- ship Predicted by Eq 7.
was not observed when testing thinner specimens of thickness of 1 in. or less in plate A, since there the edge heat loss effect was not "felt" in the test area. This effect could therefore be used to determine if specimens of too great a thickness are being tested in any given heater plate. If no asymmetry is appar- ent in the unbalance results, the edge heat loss effect is negligible.
I n Figs. 5, 6, and 7, the slopes of the lines of percentage error in conductivity plotted against percentage unbalance do not decrease with increasing conduc- tivity. For example, in Fig. 5 the line
If the error Ak/k is multiplied by the ratio (q - qo)/q = ck/q, which is the ratio of the error heat flow in the speci- mens to the total error flow, only the error due to error heat flow in. the speci- mens remains, and this is independent of k. This is apparent when both sides of Eq 6 are multiplied by (q - q~)/q:
2
q - P ok ( q ) - A s C '
Therefore, the fraction of the total error, due to error heat flow in a 1-in. thick specimen is:
I n Fig. 11, Ak/k (q - qo/q) l / L has been plotted against AO/O for plate A for all specimens tested. The slope of the line is equal to the value of c/A for the plate.
Equation 6 might appear to indicate that the unbalance errors are inversely proportional to the test area of the plate. However, c and go also depend upon A, go being directly proportional to the perimeter of the test area. Since, however, the ratio of perimeter to area for a square or a circular plate decreases as area increases, the net effect is that the unbalance error decreases as plate size increases.
I t has been shown that for a given heater plate the largest percentage errors due to unbalance occur with large speci- men thicknesses and low conductivity materials. The thicknesses of the rock wool specimens, the test results for which are shown in Fig. 3, represent the ASTM maximum permissible thick- nesses for the respective plate dimen- sions. Rock wool represents a typical low conductivity material. The temper- ature difference employed in these tests, 40 F, is the minimum permitted by ASTM. The maximum temperature un- balance allowed by ASTM (A0 X 100/8
= 0.75) results in a n error in measured conductivity for these specimens of 2.34 per cent for plate A, 5.24 per cent for plate B and 6.05 per cent for plate C. Thus excessive errors due to unbalance can occur even when the ASTM require- ment is met. I n Britain and continental Europe still greater errors can result since smaller hot plate to cold plate tem- perature differences are common and since, a t least one test method, that of RILEM, (1) permits a larger value
of percentage unbalance (A0 X 100/0
= 1.0).
With the aid of E q 6:
Ak - -
-
- - L A0 k A 0 ( q o l k+
4,
the error due to any unbalance A0 when testing a specimen of conductivity k and thickness L, with a temperature difference 0 and with a plate of test area A , may be calculated if the un- balance sensitivity parameters go and c of that particular plate are known. Conversely if the unbalance errors are to be kept below a certain limiting value Ak/k, then the maximum unbalance A0 that can be tolerated can be calcu- lated. The best heater plate in this re- spect will be the one with the lowest values of qo and c.
One of the unbalance sensitivity con- stants, go, may be roughly determined by calculation if the detailed design and geometry a t the gap are known. The total heat transfer directly across the gap for a temperature difference of 1 F, go, may be separated into the following com- ponents for the purposes of calculation: 1. Conduction or convection transfer across the air gaps,
2. Radiation transfer across the air gaps,
3. Conduction through the plate ma- terial which crosses the gap,
4. Conduction through thermocouple wires crossing the gap, and
5. Conduction through the two test area heater leads which cross the gap. In making the calculations it is as- sumed: (a) that these components are all non-interacting parallel mechanisms of heat transfer; (b) that a 1 F unbalance measured between the test and guard surface plates represents a temperature difference of 1 F for each of the above heat transfer components; and (c) that corner effects may be neglected. Of great importance, then, to the value of qo are: 1. The over-all thickness of the heater plate,
2. The gap width,
3. The perimeter of the test area and hence the size of the plate,
WOODSIDE AND WILSON ON UNBALANCE ERRORS I N Gu-~RDED HOT PLATE 45
4. The number and thickness of ther- mocouple wires crossing the gap, and
5. The emissivity of the metal face plates.
The calculated and experimental val- ues of q a for the three plates are shown in Table 111. The agreement between cal- culated and experimental values suggests that calculated values are adequate for purposes of designing heater plates but should not be relied upon for the pre- diction of the actual error due to heat flow directly across the gap. The calcula- tion of the error heat flow in the speci- mens to give the value of c, the second unbalance sensitivity parameter, is much more di£ficult. The determination of the
The magnitude and variation of the errors in thermal conductivity due to small temperature unbalances between test and guard areas in three different guarded hot plates have been investi- gated. The following conclusions may be drawn.
The percentage error due to unbalance is :
( a ) Directly proportional to the ratio of the unbalance to the temperature dif- ference between hot and cold plates;
( b ) Directly proportional to the thick- ness of the specimen tested;
(c) Strongly dependent upon the con- ductivity of the speciinen tested, being greater the lower the conductivity;
TABLE 111.-COMPARISON OF CALCU- (d) ~ ~upon the size ~ a i d de- ~ ~ d ~ ~ t
LATED AND EXPERIMENTAL
VALUES O F qa. sign of the heater plate.
(Btu per hr deg Fahr unbalance) The relationship between the error due
A . . . . . 0 . 1 2 0.12
B . . . 1 3 3 0 . 2 4
C . . . . 1.84 1.97
Heater Plate
error heat flow in the specimen for a given unbalance by mathematical anal- ysis and by use of the relaxation tech- nique will be described in a future paper. Values of qo and c for any plate may be determined experimentally by the per- formance of a t least two unbalance tests on a t least two different conductivity materials and analyzing the data as described above. Two homogeneous ma- terials of widely different thermal con- ductivities, for example, 0.25 and 2.0, should be selected for this purpose in order to achieve the maximum accuracy in the determination of these constants. For the same reason, it is suggested that the maximum permissible specimen thickness be used for these measure- ments.
to unbalance anh these factors can be expressed by the formula:
Experimental
I t has been shown how, using this rela- tion, the maximum tolerable unbalance to achieve a certain accuracy in conduc- tivity may be calculated provided that two heater plate constants are known. These constants, q o and c, are defined, for unit temperature difference between test area and guard ring, as the heat transfer directly across the gap and the error heat flow in specimens of unit conductivity, respectively.
A poorly designed heater plate, that is, one with large values for q o and c, will require closer balance control to achieve a given accuracy than a well-designed plate under the same test conditions. The value of qo will be low when: (a)
the over-all thickness of the heater plate is small; and ( b ) the gap conductance is low. The value of c will be low when the gap width is large. However, as the gap width increases, the size of the test area
becomes more indefinite and the distor- tion of the isothermals becomes greater. For a given gap width the effect of this distortion is smaller the larger the test area. I t would therefore seem more ap- propriate to specify a maximum value for the ratio of gap width to length of side of test area than to specify a maxi- mum value for the gap width.
The fact that unbalance errors as high as 6 per cent were obtained, even when the ASTM balance requirement of At9 X
100/tI
6
0.75 was satisfied, indicates that much better balance control than is required by the ASTM method is neces- sarv for accurate measurements. Insteadance, say 0.5 per cent, should be speci- fied. The degree of balance required to achieve this accuracy can be calculated prior to any test if the constants for the heater plate have been determined.
Acknowledgments:
The authors greatly appreciate the continued interest and encouragement of Mr. N. B. Hutcheon and wish to ex- press their thanks to Messrs. J. G. The- riault and C. St. Jacques who carried out most of the experimental work. This paper is a contribution from the Division of Building Research, National Research of specifying a maximum value for At9
x
Council of Canada, and is published with100/@, a maximum error due to unbal- the approval of the Director.
(1) Re'union Internationale des Lahoratoires d'Essais et de Recherches sur les Mate'riaux et les Constructions (RIZEM), Bz~lletin, No. 19, pp. 1-12 (1954).
(2) C. F. Gilbo, "Experiments with a Guarded Hot Plate Thermal Conductivity Set," Symposium on Thermal Insulating Materials, Am. Soc. Testing Mats., pp. 45-55 (1951). (Issued as separate publication ASTM S T P
No. 119 )
(3) A. J. I\. Roux, S. J. Richards, and W. &I. H.
Rennhackkan~p, "The Measureinent of the Thermal Properties of Building Materials- The Thermal Conductivity oi Thin 12" Square Samples," Series DR-6, South African Council for Scientific and Industrial Re- search, National Building Research Inst., Nov., 1950.
(4) A. Pascal, "La Mesure de la Conduction Thermiclue des MatEriaus du BQtiment," Inst. Technique du Biitiment et des Tra- vaus Publics, No. 90, June 1955, pp. 583- 598.
(5) M. S. van Dusen, "The Thermal Conductiv- ity of Heat Insulators," Jozrrfzal, Am. Soc Heating and Ventilating Engrs., Vol. 26, No. 7, pp. 625-656 (1920).
(6) C. D. Niven, "On the Testing of Fiber- Board Insulation," Canadian Jolrrnal of
Researclr, Vol. 7 , pp. 115-130 (1932). (7) T . M . Dauphinee and S. B. Woods, "A
d-c Amplifier for Temperature Control,"
Re-diezo of Scientijic Instrz~n~ents, Vol. 26, No. 7, p. 693 (1955).