DOI 10.1007/s11242-014-0355-y
On the Potential of Tomographic Methods when Applied
to Compacted Crushed Rock Salt
Lukas M. Keller · Michael Jobmann · Philipp Schuetz · Philippe Gasser
Received: 30 August 2013 / Accepted: 24 June 2014 / Published online: 5 July 2014 © Springer Science+Business Media Dordrecht 2014
Abstract Compacted crushed rock salt is considered as potential backfill material in
repos-itories for nuclear waste. To evaluate the sealing properties of this material knowledge con-cerning the nature of the pore space is of eminent interest. Here, the pore microstructures of crushed rock salt samples with different compaction states were investigated by X-ray (XCT) computed tomography and Focused Ion Beam nanotomography (FIB-nt). Based on these methods the pore microstructures were reconstructed and quantitatively analyzed with respect to porosity, connectivity and percolation properties. Regarding pores with radii > 4 μm, porosity differs substantially in the two analyzed samples (φ = 0.01 and 0.10). The pore microstructures are considered isotropic in connectivity and percolation threshold. Using two finite-scaling schemes we found percolation thresholds with critical porosities
φc> 0.05. Based on statistical considerations, the millimeter size samples that can be
ana-lyzed by XCT are large enough to provide a meaningful picture of the pore geometry related to macroporosity. The samples contain also a small fraction (i.e.< 0.01) of pores with radii < 1 μm, which were resolved by FIB-nt. Often these pores can be found along grain bound-aries. These pores are granular shaped and are not connected to each other. Typical samples size that can be analyzed by FIB-nt is on the order of tens of microns, which turned out to be too small to provide representative geometric information unless an effort is made that involves several FIB-nt realizations per sample.
L. M. Keller (
B
)ZHAW, Zurich University of Applied Sciences, Winterthur, Switzerland e-mail: [email protected]
M. Jobmann
DBE TECHNOLOGY GmbH, Peine, Germany P. Schuetz
Materials Science and Technology, Center for X-ray Analytics, Dübendorf, Switzerland
P. Gasser
Swiss Federal Institute of Technology, Centre for Imaging Science and Technology, Zürich, Switzerland
Keywords Pore space· Compacted crushed rock salt · Connectivity · porosity
1 Introduction
Decades ago, salt was proposed as a candidate rock for hosting a repository for nuclear waste. Ever since that proposition much work was done in order to assess the sealing proper-ties of this material (Spiers et al. 1988,Spangenberg et al. 1998). For example, it was shown that permeability of dry rock salt decreases under increasing hydrostatic compression due to progressive closer of grain boundary cracks (Popp et al. 2001). Apart from the host rock, con-cepts for radioactive waste repositories include a material that surrounds the waste canisters and fills (i.e. back fill) the cavities between the canisters and the borehole in the host rock. Regarding a repository in salt rock, crushed rock salt is considered as the reference backfill material (Bechthold et al. 1999;Fischer-Appelt et al. 2013). An advantage of the material is the ability to consolidate into a dense material as a result of compactional loading. In any case, a final assessment of the suitability as a backfill material requires an understanding of the microstructure response to compaction. In particular, understanding reduction of poros-ity and pore connectivporos-ity due to compaction is critical when evaluating the sealing property of the material. So far microstructural investigations of compacted crushed rock salt are scarce. In situ X-ray computed tomography (XCT) measurement during compaction of pure halite allowed the reconstruction 3D microstructures corresponding to stages of increasing deformation (Renard et al. 2004). These authors showed that increasing deformation (i.e. pressure solution creep) caused reduction in porosity and related decrease in permeability. Imposing a temperature gradient on compacted salt also causes porosity variations, which in turn affect gas transport properties (Olivella et al. 2011). Thereby, it should be recognized that permeability changes due to porosity changes are particularly pronounced near the crit-ical porosity (percolation threshold) as it was demonstrated for Opalinus Clay (Keller et al. 2013a). Porosity changes at higher porosities than the critical porosity have minor effects on permeability. Hence, the relationship between fundamental microstructural properties such as the percolation threshold and degree of compaction are vital when assessing the sealing properties of compacted crushed rock salt. During the recently performed “preliminary safety analysis of the Gorleben site” a method has been developed to demonstrate the safe enclosure of radioactive waste in salt rock (Müller-Hoeppe et al. 2013). The safety is ensured by the tight salt rock itself and by the geotechnical barrier system containing shaft and drift plugs to seal the man-made excavations underground. One key aspect is that the proper working of the engineered barriers has to be proved for a certain period of time necessary to sufficiently compact the backfill material (crushed rock salt). Currently, it is assumed that after reaching a porosity of about 1 vol. % the backfill material is as tight as the natural salt rock and if that is the case, the engineered barriers may fail without threatening the safety since the backfill material takes over the sealing function. One aim of this study was to investigate whether tomographic methods together with percolation theory can give indications about a critical porosity of crushed rock salt that, once reached, doesn’t allow any more permeation to occur.
To assess these sealing properties of crushed rock salt we used XCT and Focused Ion Beam nanotomography (FIB-nt) in order to obtain 3D reconstructions of the macroporosity (radii> 4 μm) and microporosity (radii < 1 μm). The reconstructed pore microstructures were then analyzed with respect to homogeneity, percolation properties and representativity using the same procedure that was recently applied to Opalinus Clay (Keller et al. 2013a).
2 Samples
Two samples with different degrees of compaction were examined (Table1). The sample material originates from oedometer tests that were carried out by the German Federal Institute of Geosciences and Natural resources (BGR). Natural crushed rock salt has been used with a grain size distribution between 0.06–8.0 mm. Sample 47/5 was compacted during 78 hours at a temperature of 200◦C using a load rate of 0.36 (and less) mm/h. The high temperature increases the viscous behavior of the crushed salt and allows a much more rapid compaction of the material. Sample 051 was compacted during 6 hours at a temperature of 100◦C using a load rate of 0.36 up to 3.6 mm/h. According to microstructural investigations using thin-sections performed by DBE TECHNOLOGY GmbH, the porosity and connectivity of the selected samples are different. Sample 051 is reported to have a higher porosity and the pore space is better connected when compared to sample 47/5.
3 Analytical Methods
The absolute size of the analyzed volumes, smallest resolved pore radii and bulk porosity related to the respective tomographic methods are documented in Table1.
3.1 Sample Preparation
XCT: Salt prisms with ground areas of around 3x3 mm and heights of about 5-10 mm were cut with a diamond saw and were subsequently lightly sanded to remove material that was damaged during sawing. XCT scans were then performed in the center of the material in order avoid artifacts related to mechanical sample preparation.
FIB-nt: Salt slabs with a thickness of around 1 mm were cut with the help of a saw with a thin (thickness of saw blade= 200 μm) diamond blade. Afterwards the slaps were lightly sanded to remove material that was damaged during sawing. To stabilize the salt slabs, they were sandwiched between two 50μm thick glass discs, which were glued together with epoxy. Then, a cross-section was cut with a diamond saw. The surface of this cross-section was polished locally by using a Hitachi IM 4000 broad ion beam (BIB) instrument. The polished area was subsequently investigated by SEM and FIB-nt. Scanning Electron Microscope (SEM) imaging of BIB polished crushed rock samples is used for a material characterization on the mm-scale (for comparison: typical sample size of the FIB-nt analyzed volume is a cube of 10−30 μm edge length). BIB polishing occurred at 6keV for 1.5 h.
3.2 X-ray Computer Tomography (XCT)
We used the same methods and instruments as described inKeller et al.(2013b). Resolution given in voxel size of the reconstructed 3D image was 4μm.
3.3 Focused Ion Beam Nanotomography
3D information can be obtained by acquiring a sequence of cross sectional images spaced evenly through a region of a bulk specimen, and reconstructing those two-dimensional images into a three-dimensional representation of the sampled volume. One image stack for each analyzed sample was collected (Table1). Additional information on the method can be found for example inKeller et al.(2013b).
Ta b le 1 V alues of v o lume fractions of pores, inte g ral range A3 and coef fi cient αfor d if ferent data sets obtained from d if ferent tomographic m ethods. (See also K eller et al. 2013a for m eaning o f inte g ral range A3 and coef fi cient α ) Sample Compaction (mm/h; T ;time) Characteristic of sample location Method Sample v o lume [μ m] Porosity [vol.%] Smallest pore radii Inte gral range A3 [μ m 3] Coef ficient α Figure 47/5 0 .36–0.00036; 200 ◦C; 78 days Fine-grained salt FIB-nt 15.9 × 15.6 × 9.65 1. 12 5 n m 0 .4 1 0 .1 9 F ig . 4 a,b Lar g e & small grains XCT top 2192 × 1480 × 2460 0. 84 μ m 17.9 0 .44 F ig. 2 a,b Lar g e & small grains XCT bottom 2088 × 1656 × 2516 1. 04 μ m– – – 051 3.6–0.36; 100 ◦C; 6d ay s Fine-grained salt FIB-nt 28.5 × 24 × 10.4 0. 23 0 n m – – F ig . 4 c,d Lar g e & small grains XCT top 1972 × 1760 × 1716 9. 64 μ m 14.74 0.33 Fig. 2 c,d Lar g e & small grains XCT bottom 1924 × 1792 × 2224 10 .04 μ m– – –
3.4 Image Processing 3.4.1 X-ray Tomography
In the XCT scans the edges of the analyzed volumes appeared brighter when compared to its interior. This is a common large-scale artifact and was corrected by applying a 3D in-house image background filter. A mean shift filter was then applied to reduce the noise in the images. Grey-level contrast thresholding allowed an accurate segmentation of i) pores, a ii) mineral (anhydrite?) with bright contrast and a iii) matrix consisting of salt minerals. Based on the segmented image stacks the pore space was visualized by using the Avizo software developed by the Visualization Science Group (http://www.vsg3d.com).
3.4.2 FIB-nt
The SEM images were aligned by using the algorithm implemented in the free image process-ing software Fiji (Schindelin et al. 2012). Then, the maximal overlapping area was cropped from the images of the aligned SEM image stacks. Vertical stripes in the images, which are artifacts of ion milling (i.e. the so-called waterfall effect) were then eliminated by applying an in-house destriping filter. Then, a 3D background correction was applied in order to reduce systematic large-scale intensity variations, which are caused by shadowing effects related to the oblique imaging angle and to the subsidence of the image plane into the milled trench. The reconstruction of a 3D microstructure requires a segmentation of the images, i.e. the pores have to be located in the images. Due to weak image contrast, the pores were manually segmented from the SEM images using the tools for manual segmentation provided by the Avizo software. For 3D visualization, we used the Avizo software.
4 Results
4.1 Micro- to Macro-scale Pore Structures Based on BIB and SEM Imaging
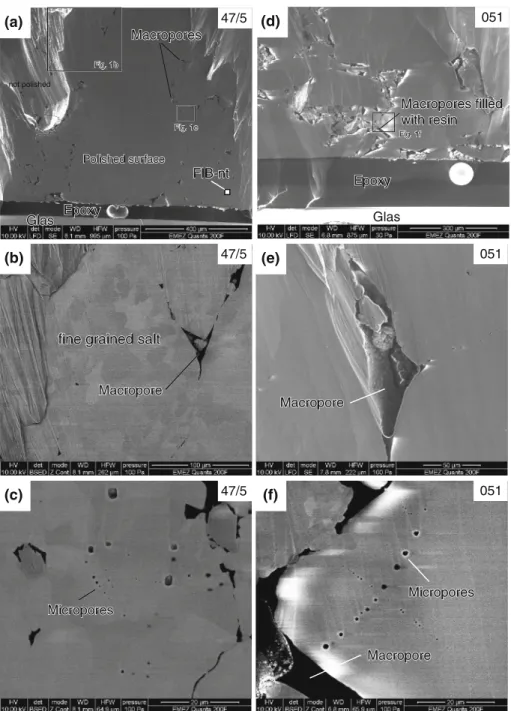
SEM images on the hundreds of micron scale and SEM images at higher magnifications of the prepared samples are shown in Fig.1. The SEM images reveal that the examined samples contain nano-scale (micropores) (Fig.1c, f) and micron-scale pores (macropores) (Fig.1b, e). The geometry of the macropores is defined by geometric incompatibilities between angular salt grains and/or grain aggregates. Geometric compatibility between grains is higher in sample 47/5 when compared to sample 051, which results in a lower porosity and connectivity in sample 47/5. Micropores are located in compact grain aggregates, mainly along grain boundaries but also in the interior of grains. In 2D these pores have a circular shape. 4.2 Macro-scale Pore Structure Based on XCT
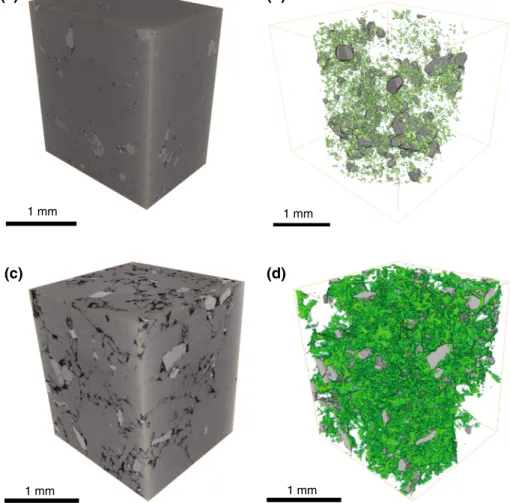
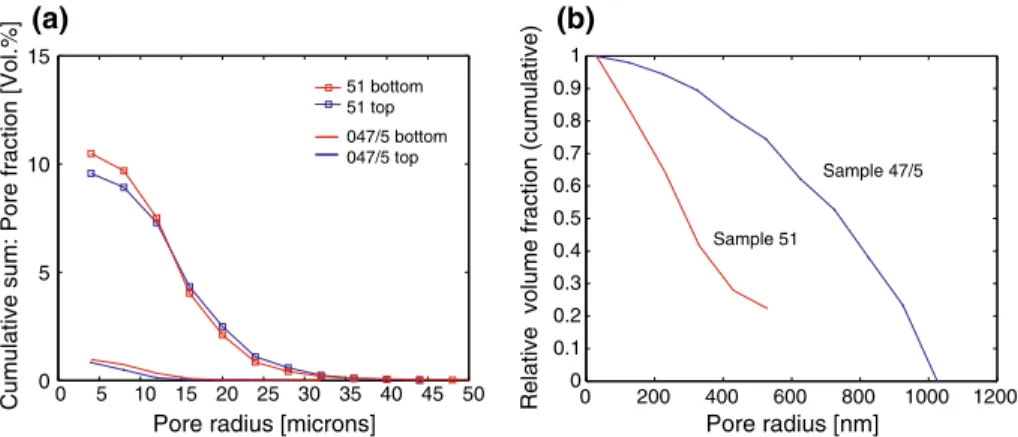
3D reconstructions of the analyzed samples and pore space reconstructions are shown in Fig.2. Regarding sample 47/5 (Fig.2a,b), the porosity related to pores with radii> 4 μm is around 1 vol. % and the pore space consist of numerous isolated pore objects. Substantially higher macro porosity (∼10 vol%) was found in sample 051 (Fig.2c, d), which is also connected on the size of the analyzed samples. The samples differ also with respect to pores size distribution. Continuous pore size distributions (Münch and Holzer 2008) calculated on the base segmented image stacks are shown in Fig.3a. The majority of pores in sample 47/5
fine grained salt fine grained salt
Macropore Macropore
fine grained salt
Macropore (b) 47/5 Micropores Micropores Micropores (c) 47/5 (e) Macropore Macropore Macropore 051 (f) Micropores Micropores Macropore Macropore Micropores Macropore 051 Polished surface Polished surface Macropores Macropores Polished surface Epoxy Epoxy Glas Glas Epoxy Glas Macropores not polished FIB-nt FIB-nt FIB-nt (a) 47/5 Fig. 1b Fig. 1b Fig. 1b Fig. 1c Fig. 1c Fig. 1c (d) Macropores filled Macropores filled with resin with resin Macropores filled with resin Epoxy Epoxy Epoxy Glas 051 Fig. 1f Fig. 1f Fig. 1f
Fig. 1 SEM images at different magnifications of samples 47/5 and 051. a and d Overview of the
area, which was polished with help of a BIB instrument. Rectangles mark areas imaged at higher resolutions. b Different crystallographic orientations of salt grains leads to a grey scale contrast (i.e. orientation contrast) and makes individual salt grains visible. The image shows that the compact areas are in fact grain aggregates and not single crystals. c Images at higher magnifications docu-ment micropores in otherwise compact grain aggregates. e Macropore with epoxy in angular corners.
f It is noticeable that micropores are all along more or less straight lines (crystal planes?) crossing each
1 mm 1 mm
(a) (b)
(c) (d)
1 mm 1 mm
Fig. 2 Visualization of the XCT data set of sample 47/5 and sample 051. a 3D reconstruction of the analyzed
volume of sample 47/5 and b 3D reconstruction of pore space (green) and a mineral (anhydrite) with bright image contrast (grey). c 3D reconstruction of the analyzed volume of sample 051 and d 3D reconstruction of pore space (green) and a mineral (anhydrite) with bright image contrast (grey)
have radii< 20 μm and the most frequent pore radii is around 10 μm. Sample 051 contains larger pores with radii< 40 μm and the most frequent pore radii is around 15 μm and is thus, similar to the one of sample 47/5.
4.3 Micro-scale Pore Structure Based on FIB-nt
3D reconstructions of the analyzed volume and 3D reconstructions of the pore space are shown in Fig.4. The analyzed volumes contain a small number of pores with radii< 1 μm (Fig.3b) and a porosity in the 0.2 to 1.0 vol. % range. On the size of the analyzed volumes, micropores are inhomogenously distributed and the pore size distributions of the two samples are therefore difficult to compare and are thus, given as relative distributions (i.e. normalized so that porosity sums one) (Fig.3b). Often crystal planes define the pore shape, which in the case of salt results in a cubic or circular pore geometry (Fig.4a). On the scale of observation,
0 5 10 15 20 25 30 35 40 45 50 0
5 10 15
Pore radius [microns]
Cumulative sum : Pore fractio n [ Vol .% ] 51 bottom 51 top 047/5 bottom 047/5 top 0 200 400 600 800 1000 1200 0 0.1 0.2 0.3 0.4 0.5 0.6 0.7 0.8 0.9 1 Pore radius [nm] Relative volume fractio n ( cumulative ) Sample 47/5 Sample 51 (a) (b)
Fig. 3 a Compilation of continuous pore size distributions (Cumulative distribution) for different salt samples,
which are based on 3D data from XCT. b Relative (i.e. normalized so that porosity sums one) continuous pore size distributions of microporosity in samples 47/5 and 051 based on 3D data from FIB
10 µm (a) 10 µm (b) (c) (d) Micropores Micropores 15 µm Micropores Micropores Micropores Macropore Salt 15 µm Macropore Micropores
Fig. 4 Visualization of the FIB data sets. a 3D reconstructions of the analyzed volume documenting the
granular pore geometry of sample 47/5 and related b 3D reconstruction of pore space. c 3D reconstructions of the analyzed volume of sample 051 and related d 3D reconstruction of pore space showing a macropore and numerous in plane micropores
these pore objects are spatially isolated and do not touch each other (Fig.4). Such micropores occur in-plane along grain boundaries (Fig.4d) and at grain triple points. The orientation contrast between salt grains visible in SEM images gives an idea of the grain size of such aggregates (Fig.4a). Within the analyzed volume the grain size ranges between a few microns to tens of microns.
5 Local Porosity Analyses, Percolation Threshold and Representativity of XCT
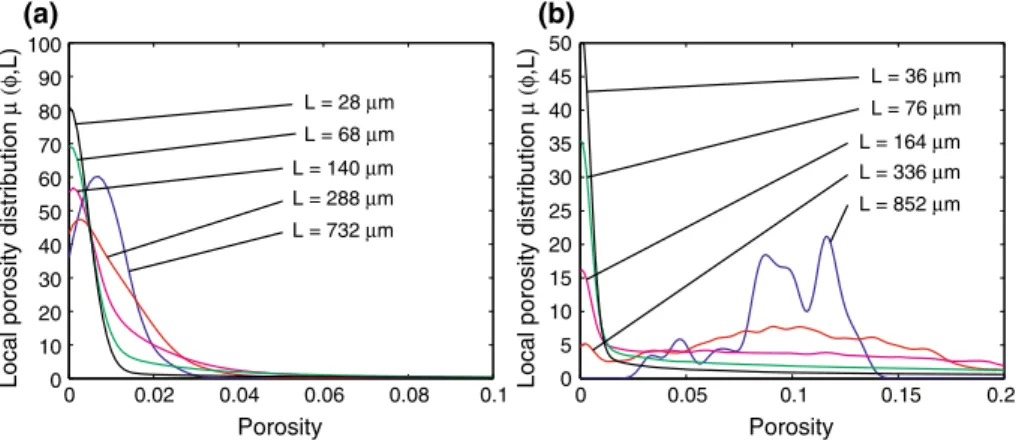
This paragraph summarizes the results obtained by applying local porosity theory and clas-sical percolation theory to the voxel representation of the pore microstructures. In addition, the representativity of XCT when applied to crushed salt rocks is evaluated on the base of a statistical approach. All these calculations are based on a sub-volume analysis. Thereby, the analyzed volume is subdivided into a regular grid and porosity and pore connectivity were measured in cells or samples of different sizes L. For methodological details the reader is referred toKeller et al.(2013a), who applied the same approach to Opalinus clay. With increasing L the local porosity distributionsμ of sample 47/5 change from a wide distribution to a distribution with a single peak at the position of the bulk porosity (Fig.5a). Development of a single peak occurs for cells with edge lengths L>∼700 μm. Local porosity distributions μ can be regarded as a probability measure to find a local porosity within cell or sample of certain size L. This means that at millimeter length scale there is a high probability to find a local porosity that equals the bulk porosity, which in turn can only be true if the pore space, at this length scale, possesses a certain degree of homogeneity. Regarding sample 051 the development of single peak at length scale of>800 μm is indicated and points also to a certain degree of homogeneity (Fig.5b). However, at this length scale locale porosity fluctuations are still present, which indicates that sample 051 is less homogenous on the one-millimeter length scale when compared to sample 47/5. This fact can be explained by different size spectrums of pores within the two samples. A larger volume must be analyzed to capture enough of the geometric content related to the larger pores of sample 051 to represent the complexity of the pore space
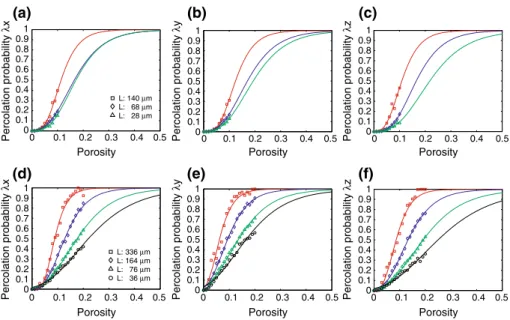
Calculated percolation probabilitiesλ related to macroporosity are displayed in Fig.6. Smooth curves in Fig.6are fitted sigmoid function curves, which were used as input for
0 0.05 0.1 0.15 0.2 0 5 10 15 20 25 30 35 40 45 50 0 0.02 0.04 0.06 0.08 0.1 0 10 20 30 40 50 60 70 80 90 100 Local porosity distribution μ ( φ ,L) Porosity L = 28 μm Local porosity distribution μ ( φ ,L) Porosity L = 68 μm L = 140 μm L = 288 μm L = 732 μm L = 36 μm L = 76 μm L = 164 μm L = 336 μm L = 852 μm (a) (b)
Fig. 5 Local porosity distributions calculated for different length L of measuring cell and on the base of XCT
0 0.1 0.2 0.3 0.4 0.5 0 0.1 0.2 0.3 0.4 0.5 0.6 0.7 0.8 0.9 1 0 0.1 0.2 0.3 0.4 0.5 0 0.1 0.2 0.3 0.4 0.5 0.6 0.7 0.8 0.9 1 0 0.1 0.2 0.3 0.4 0.5 0 0.1 0.2 0.3 0.4 0.5 0.6 0.7 0.8 0.9 1 0 0.1 0.2 0.3 0.4 0.5 0 0.1 0.2 0.3 0.4 0.5 0.6 0.7 0.8 0.9 1 0 0.1 0.2 0.3 0.4 0.5 0 0.1 0.2 0.3 0.4 0.5 0.6 0.7 0.8 0.9 1 0 0.1 0.2 0.3 0.4 0.5 0 0.1 0.2 0.3 0.4 0.5 0.6 0.7 0.8 0.9 1 (a) (b) (c) Percolation probability λ x Porosity Percolation probability λ y Porosity Percolation probability λ z Porosity Percolation probability λ x Porosity Percolation probability λ y Porosity Percolation probability λ z Porosity L: 140 μm L: 68 μm L: 28 μm (d) (e) (f) L: 336 μm L: 164 μm L: 76 μm L: 36 μm
Fig. 6 Percolation probabilitiesλα(φ, •) of macroporosity along different directions. Symbols are computed
values and lines smooth interpolations. a Sample 47/5: x-direction, b Sample 47/5: y-direction and c Sample 47/5: z-direction. d Sample 051: x-direction, e Sample 051: y-direction and f Sample 051: z-direction
the calculation of the percolation threshold (see below andKeller et al. 2013a). The sigmoid functions were fitted to the data by using the simplex search method ofLagarias et al. (1998). The position of the λ curves corresponding to different directions do not differ much and the macroporosity is therefore considered as near isotropic in its connectivity. The relative position between bulk porosity and the position of theλ curves gives an idea of the connectivity of the pore structure. Regarding sample 47/5 major connectivity changes occur at much higher porosities (i.e.>0.05) when compared to the bulk porosity (i.e. ∼ 0.01) of the sample. This indicates that macropores are poorly connected. On the contrary, for sample 051 major connectivity changes for subsample sizes occur at similar porosity values as the bulk porosity (i.e.∼ 0.1) of the sample. This indicates good connectivity of the sample.
The local porosity distributions corresponding to the microporosity of sample 47/5 indi-cates that pore microstructure does not possess homogeneity on the sample size that can be analyzed by FIB-nt. Due to the lack of homogeneity and strong geometrical arrangement of micropores, percolation probability calculations yielded no meaningful results and were thus, not applied to sample 051.
The critical porosityφc(i.e. percolation threshold) at which one can expect a
percolat-ing pore network is a crucial parameter. Here, we used two finite-size scalpercolat-ing schemes in combination with the results obtained from local percolation analysis to calculate the critical porosity (for details seePringle et al. 2009;Keller et al. 2013a).
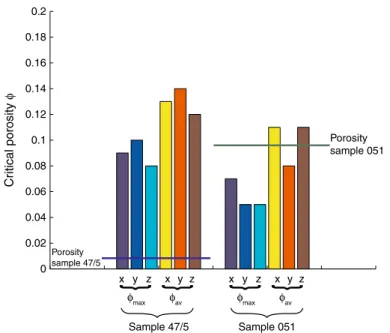
Concerning the macroporosity of sample 47/5, the calculations yielded values for the percolation threshold in the 0.08–0.14 porosity range. Values along axes in different directions and calculated with a specific scaling scheme do not differ much (i.e.∼0.02) indicating near isotropic space geometry (Fig.7). The calculated values are substantially higher than the bulk porosity, which documents the poor connectivity of the microstructure. Regarding sample 051 the calculations yielded values in the 0.05–0.11 porosity range but values related to a
0 0.02 0.04 0.06 0.08 0.1 0.12 0.14 0.16 0.18 0.2 x y z
{
φmax x y z{
φav Sample 47/5 x y z{
φmax x y z{
φav Sample 051 Cr itical porosity φ Porosity sample 051 Porosity sample 47/5Fig. 7 Bar plot shows a compilation of the calculated percolation thresholds related to macroporosity for all
samples. The values related to different percolation directions (x,y,z) are grouped according to the applied scaling scheme (i.e.φmaxandφav)
0 100 200 300 400 500 600 700 800 900 -0.1 -0.05 0 0.05 0.1 0.15 0.2 0.25 0.3 0 0.1 0.2 0.3 0.4 0.5 0.6 0.7 0.8 0.9 1 L [μm] Porosity Relative error εr L [mm] RVE N=1 (a) (b) 1 2 3 4 5 6 7 8 9 10
Fig. 8 a Mean value of macroporosity (i.e. sample 051) and intervals of confidence versus size of measuring
cells L. b Relative errorε•vs. RVE of porosity for a single XCT realization. The plot gives an idea of the relative error on porosity that is related to a single XCT scan. As an example: for a salt sample with volume edge length of 5 mm the relative error on porosity is about 0.40
specific scaling scheme do not differ much (i.e.∼ 0.03) which indicates a near isotropic space geometry (Fig.7). Critical porosities are lower than bulk porosity, which indicates good connectivity of macropores in sample 051.
The evaluation of the representativity of XCT when applied to crushed salt is based on a statistical approach outlined by Kani et al. (2003) (see also Keller et al. 2013afor some details). By inspection of Fig.8it can be seen that the mean porosity of sample 051 does not vary much with increasing cell size and that the associated interval of confidence decreases asymptotically. These results indicate that the true mean value of porosity can
be predicted from a sample size that is smaller than the representative volume element (RVE) and that only a sample of infinite size will produce an error-free measurement. In this way of thinking, a realistic size of RVE (i.e. not to large), which can also be used for macroscopic modeling, should be calculated for an acceptable error.Kanit et al.(2003) provide an expression V = {(4[1 − Mφ]A3)/(MφNε2r)}1/αfor the smallest volume V that must be measured to determine the porosity for a given relative error εr and number of
realization N . The meaning and approach to determine parameters A3andα can be found inKeller et al.(2013a). The true mean value of porosity Mφ was set to the measured bulk porosity. This is supported by the fact that calculated mean values do not vary much in dependence of L. The values of A3, α and volume fractions can be extracted from Table1. Then, the size of the RVE can be calculated for a given precision of the mean value that results from different realizations N (i.e. independent measures cells with the size of the RVE). For N = 1, Fig.8b shows the relative precisionsεr in dependence of LRV E. Note, LRV E can
also be considered as sample size and thus, the plot gives an idea of the accuracy of XCT when applied to salt. For samples with edge length between 2–3 mm (= sample size of this study) the relative error is around 0.5. The relative error can be reduced to around 0.3 if two XCT realizations (as in this study) are performed. Or formulated differently: if we accept a relative error of 0.3 and if we perform two XCT realizations the RVE is a volume with an edge length between about 2–3 mm.
As it was indicated already by local porosity distribution and again indicated by RVE calculations, FIB does not provide representative information on the nano- to micron- scale pore structure unless numerous FIB realizations (i.e.>10) are performed. Such an approach is not efficient because FIB is too time consuming and thus, other method must be taken into consideration.
6 Discussion
6.1 Implications Based on XCT
The macroporosity related to pores with radii> 4 μm was investigated in millimeter size compacted crushed rock salt samples by using XCT. The two analyzed samples differ sub-stantially in porosity and pore connectivity. Macroporosity of sample 051 is around 0.1 and the pore space is fully connected. On the contrary, sample 47/5 has a macroporosity of around 0.01 and the pore space is not connected on the millimeter scale. By applying combination of local porosity theory and percolation theory to pore microstructures allowed to estimate critical porosities at the onset of percolation (i.e. percolation threshold). Regarding pores with radii> 4 μm, a percolating pore network must be taken into consideration in case porosities exceed values of about 0.05. In addition, the analysis reveals that the resolved pore space must be considered as isotropic in its connectivity and percolation threshold.
6.2 Implications Based on FIB
On the base of FIB, micropores with radii< 1 μm can often be observed along grain bound-aries of otherwise compact salt grain aggregates. Porosity that is related to these small pores is as low as 0.01 and the pore space is very poorly connected. Often the pore geometry is defined by crystallographic planes, which suggest that these pores are related to the formation of fluid inclusions.
Taking small samples from large rock bodies raises the question about the representative-ness of the reconstructed pore microstructures. Regarding macroporosity calculations based on local porosity theory and RVE calculations reveal that the pore space on the millimeter scale possess a certain degree of homogeneity. Thus, the samples size that can be analyzed by XCT is large enough to provide representative geometric information on the pores structure, of which radii exceed 4μm. On the contrary the sample size that can be analyzed by FIB-nt is too small to provide representative geometric information on microporosity. Nevertheless, FIB based pore microstructures gives at least an idea of the 3D geometry of these smaller pores.
7 Conclusions and Outlook
• By using XCT and FIB-nt, the present study analyzed pores with radii larger than 4 μm (macropores) and smaller than about 1μm (micropores). Hence, pores with radii in the 1 to 4μm range were not considered. In addition, the typical sample size related to FIB nanotomography turned out to be too small to provide representative geometric informa-tion on microporosity. This means that pores with radii 1 to 4μm should additionally be analyzed with a XCT device, which can reach resolutions down to around 1μm or less. • Concerning pores with radii > 4 μm, XCT provides representative geometric information
about the pore structure.
• Regarding pores with radii > 4 μm, XCT and “critical” porosity determination confirm that an originally connected pore network within a compacted crushed salt sample can be disconnected by further compaction if the porosity falls significantly below the “critical” porosity. Connectivity and percolation isotropy is indicated for the pore space of the analyzed samples.
• Outlook: Computer tomographic investigations together with local porosity and perco-lation theory seems to be a useful tool to identify minimum porosities that have to be reached within the crushed salt backfill to stop any permeation. Based on the prelimi-nary investigations in this study minimum critical porosity for pore with radii> 4 μm is near 5 vol.%. XCT investigations on samples with porosities around 5 vol. % should be performed to identify more clearly the critical porosity and the necessary RVE to be representative on larger scales.
Acknowledgments We would like to thank the Federal Ministry of Economics and Technology (BMWi
= Bundesministerium für Wirtschaft und Technologie) for funding the research and development activities described in this article under contract No. FKZ 02E10730.
References
Bechthold, W., Rothfuchs, T., Poley, A., Ghoreychi, M., Heuserman, S., Gens, A., Olivella, S.: Backfilling and Sealing of Underground Repositories for Radioactive Waste in Salt. BAMBUS Proj. Final. Rep. EUR 19124EN (1999)
Fischer-Appelt, K., Baltes, B., Buhmann, D., Larue, J., Mönig, J.: Synthesebericht zur Vorläufigen Sicherheit-sanalyse für den Standort Gorleben, GRS-290, ISBN-978-3-939355-66-3 (2013)
Kanit, T., Forest, S., Gailliet, I., Mounoury, V., Jeulin, D.: Determination of the representative volume for random composites: statistical and numerical approach. Int. J. Solids Struct. 40, 3647–3679 (2003) Keller, L.M., Schuetz, P., Gasser, P., Holzer, L.: Pore-space relevant for gas-permeability in Opalinus Clay:
Statistical analysis of homogeneity, percolation and representative volume element. J. Geophy. Res. 118, 1–14 (2013a)
Keller, L.M., Schuetz, P., Erni, R., Rossell, M., Lucas, F., Gasser, P.: Characterization of multi-scale microstruc-tural features in Opalinus Clay. Microporous and Mesoporous Materials 170, 83–94 (2013b)
Lagarias, J.C., Reeds, J.A., Wright, M.H., Wright, P.E.: Convergence Properties of the Nelder-Mead Simplex Method in Low Dimensions. SIAM Journal of Optimization 9, 112–147 (1998)
Müller-Hoeppe, N., Buhmann, D., Czaikowski, O., Engelhardt, J., Herbert, H.-J., Lerch, C., Linkamp, M., Wieczorek, K., Xie, M.: vorläufige Sicherheitsanalyse Gorleben Abschlussbericht Arbeitspaket 9b Integrität geotechnischer Barrieren - Teil 1: Vorbemessung. GRS-Bericht, Köln (in German) (2013)
Münch, B., Holzer, L.: Contraticting geometrical concepts in pore size analyzes attained with electron microscopy and mercury intrusion. J. Am. Ceram. Soc. 91, 4059–4067 (2008)
Olivella, S., Castagna, S., Alonso, E.E., Lloret, A.: Porosity Variations in Saline Media Induced by Temperature Gradients: Experimental Evidences and Modeling. Transp. Porous Med. 90, 763–777 (2011)
Popp, T., Kern, H., Schulze, O.: Evolution of dilatancy and permeability in rock salt during hydrostatic compaction and triaxial deformation. J. Geophys. Res. 106, 4061–4078 (2001)
Pringle, D.J., Miner, J.E., Eicken, H., Golden, K.M.: Pore-space percolation in sea ice single crystals. J. Geophy. Res. 114, C12017 (2009)
Renard, F., Bernard, D., Thibault, X., Boller, E.: Synchrotron 3D microtomography of halite aggregates during experimental pressure solution creep and evolution of permeability. Geophys. Res. Lett. 31, L07607 (2004) Schindelin, J., Arganda-Carreras, I., Frise, E., Kaynig, V., Longair, M., Pietzsch, T., Preibisch, S., Rueden, C., Saalfeld, S., Schmid, B., Tinevez, J., White, D.J., Hartenstein, V., Eliceiri, K., Tomancak, P., Cardona, A.: Fiji: an open-source platform for biological-image analysis. Nature Methods 9(7), 676–682 (2012) Spangenberg, E., Spangenberg, U., Heindorf, C.: An experimental study of transport properties of porous rock
salt. Phys. Chem. Earth 23, 367–371 (1998)
Spiers, C.J., Peach, C.J., Brzesowsky, R.H., Schutjens, P.M.T.M., Liezenberg, J.L.: Long-term rheological and transport properties of dry and wet salt rocks, Technical Report, EUR 11848, Nuclear Sci. and Tech., Office for Official Pub. oft he EC, Lux., pp. 161