+
SHORT AND LONG TERM BEHAVIOUR OF
ASSEMBLAGES OF CRUSHED ROCK PARTICLES
IN OEDOMETER COMPRESSION
Thèse
Vahid Abbasi
Doctorat en génie civil
Philosophiæ Doctor (Ph. D.)
Québec, Canada
SHORT AND LONG TERM BEHAVIOUR OF
ASSEMBLAGES OF CRUSHED ROCK PARTICLES
IN OEDOMETER COMPRESSION
Thèse
Vahid Abbasi
Sous la direction de :
iii
Résumé
Au cours des dernières décennies, un noyau plutôt mince supporté par des épaulements en enrochement a été le modèle le plus économique et sans danger pour les barrages. Plusieurs rapports d'inspection de tassement et de déformation des barrages en enrochement au cours de la mise en eau et le fonctionnement de ces structures. Les tassements rapides ont été associés à la mise en eau. Cependant, la pression hydrostatique peut également contribuer à des changements considérables dans les déformations volumétriques au début de fonctionnement de barrages en amont. Le premier objectif de cette thèse est de montrer expérimentalement l'influence de la pression hydrostatique sur les matériaux concassés d’enrochement. Les essais de compression unidimensionnelle ont été menés par un grand œdomètre. L'équipement est conçu de manière à modifier la pression hydrostatique lors de l'essai, sans aucune influence sur les contraintes effectives.
Premièrement, une étude approfondie est réalisée sur l’influence des dimensions de cellule et aussi l’influence de système de transfert de la charge à l’échantillon. Il a été établi que la hauteur de la cellule a de grandes influences sur la réponse de ces roches concassées en compression. La force de frottement entre la cellule et l'échantillon est la source de comportement varié de l’échantillon avec des hauteurs différentes. Une méthode simple, basée sur un double essai œdométrique peut être utilisée afin de définir la force de frottement dans les échantillons. Trois systèmes sont utilisés pour étudier l'influence de différents systèmes de chargement des échantillons. Ces systèmes transfèrent la charge à l’aide d’une plaque fixe, semi-fixe et rotulé. La plaque fixe transfère la charge d’une manière non-uniforme à l'échantillon, contrairement à d’autres systèmes étudiés. Donc, les résultats obtenus avec la plaque fixe de chargement doivent être utilisés avec une prudence particulière.
Le comportement des matériaux d’enrochement dépend de plusieurs paramètres. Basés sur l’utilité de ces matériaux dans le barrage, quatre paramètres sont choisis pour cette étude. Ces paramètres sont la densité, le type de roches concassées, le niveau de contrainte et la taille des roches concassées. L'influence de ces paramètres sur le comportement à court terme de ces matériaux a été définie avec les essais expérimentaux. L’essai de compression unidimensionnelle a été choisi pour les études sur les enrochements avec des roches concassées. Les conditions de matériau ont été à sec, saturé sous la pression atmosphérique ou la pression hydrostatique. Le module œdométrique est utilisé pour représenter l'état de matériau dans l’essai de compression unidimensionnel.
Un essai de fluage a été réalisé pour montrer le comportement à long-terme des matériaux granulaires grossiers saturés. L’essai a été réalisé sur les roches concassées de granite en plusieurs niveaux de charge et sous une pression hydrostatique constante. Les résultats de l’essai montrent une relation linéaire entre la contrainte et le temps dans une échelle logarithmique. La thèse présente également des informations sur le modèle phénoménologique à trois paramètres de Zhang et al. (Zhang et al.), développé pour simuler le comportement du fluage à plusieurs niveaux du sable saturé en compression. Le même modèle a été utilisé pour décrire pertinemment les résultats de l'essai sur des matériaux granulaires grossiers. Le comportement semblable de matériaux granulaires à particules fines et grossiers confirme l’existence de mécanismes identiques dans la structure des matériaux granulaires sous effet de fluage.
Le deuxième essai de fluage a été réalisé sous différents niveaux de pression hydrostatique. Les résultats de l’essai montrent une relation linéaire entre la pression hydrostatique et le temps dans une échelle logarithmique. La thèse présente également un modèle de fluage qui prendre en compte l’effet de la pression hydrostatique sur des matériaux granulaires grossiers.
iv
Abstract
During the past decades, a rather thin core supported by rockfill shoulders was the most economical and safe design for dams. There are different reports of settlement and deformation inspection of rockfill dams during impounding and operation of these structures. The rapid collapse settlements have been associated with water impoundment. However, hydrostatic pressure may also contribute to significant change in volumetric deformations during the life of dams in upstream. The first aim of this thesis is to show experimentally the influence of hydrostatic pressure on crushed rockfill materials. In this way, the one-dimensional compression tests were conducted using the large oedometer equipment. The equipment is conceived in a manner to change the hydrostatic pressure during the test without any influences on the effective stresses.
A comprehensive study is primarily carried out on the equipment effects on the test results. This study provides the impact of cell dimensions, and also the system influences on the loading transfer to sample. It was established that the height of the cell has great influences on the response of the crushed rock in compression. The frictional force between cell and sample is the source of dissimilarity in behaviour of the sample with different heights. A sample method, based on a double oedometer test, can be used to define the frictional force in the samples. Three systems are used to investigate the influence of different techniques of loading the samples. These systems transfer the loading using the fixed, the semi-fixed and the rotational platen. The fixed platen system transfers the loading in a non-uniform manner to the sample in contrast to other studied systems. Thus, the results obtained with the fixed platen of loading, must be used with a special caution.
The behaviour of rockfill materials depends on several parameters. Based on the materials utility in dam, four parameters are chosen for this study. These parameters were the bulk density, the rock mineral type, the stress state and the particle size. The influence of these parameters on the short-term mechanical behaviour is defined with the experimental tests. The tests consisted of the one-dimensional compression tests on the uniform crushed rock particles. The materials are tested in the similar conditions which they are in rockfill dams means the air-dry condition, the flooded under atmospheric or hydrostatic pressure. The oedometric modulus is used to represent the mechanical state of materials under one-dimensional compression test.
The one-dimensional creep test is also carried out to show the long-term behaviour of saturated coarse granular materials. The test was realised on the granitic crushed rock particles in multiple stage of stress under a constant hydrostatic pressure. The test results show a linear relationship between stress-strain and strain-time in a log-log scale. The thesis also presents the information on the three-parameter phenomenological model of Zhang et al.(2006) developed to reproduce the multiple stage creep behaviour of saturated sand in compression. The same model is used to describe accurately the results of test on coarse crushed rock particles. The similar behaviour of coarse and fine granular materials confirms the occurring of identical mechanisms in the structure of granular materials under creep effect. The second creep test was conducted under different levels of hydrostatic pressure. The test results show a linear relationship between the hydrostatic pressure and time in a logarithmic scale. The thesis also presents a creep model that takes into account the hydrostatic pressure effect in coarse granular materials.
v
Table of contents
Résumé ... iii
Abstract ... iv
Table of contents ... v
List of Tables ... vii
List of figures ... viii
Acknowledgements ... xi
Chapter 1: General Introduction ... 1
Chapter 2: Using large oedometer cells to characterize the behaviour of an
assemblage of crushed rock particles ... 5
Résumé ... 5
Abstract ... 5
2.1
Introduction ... 6
2.2
Material tested ... 6
2.3
Apparatus ... 7
2.3.1
300 mm oedometer cell ... 7
2.3.2
200 mm oedometer cell ... 8
2.3.3
Load transfer systems ... 9
2.4
Procedure of sample preparation ... 11
2.4.1
Oedometric modulus ... 11
2.4.2
Grain breakage ... 12
2.5
Testing program ... 13
2.5.1
Test series A: effect of the height of oedometer ... 14
2.5.2
Test series B: effect of the diameter of oedometer ... 14
2.5.3
Test series B and C: effect of the loading transfer system ... 14
2.6
Test results ... 15
2.6.1
Influence of sample’s height ... 15
2.6.2
Modeling ... 16
2.7
Influence of sample’s diameter ... 22
2.8
Influence of loading transfer system ... 23
2.8.1
Rotational platen versus semi-fixed platen ... 24
2.8.2
Rotational platen versus fixed platen ... 25
2.9
Conclusion ... 27
Chapter 3: Short-term oedometric behaviour of coarse granular materials under
hydrostatic pressure ... 29
Résumé ... 29
Abstract ... 29
3.1
Introduction ... 30
3.2
Background ... 30
3.2.1
Settlements due to wetting in rockfill dam ... 30
3.2.2
Settlement due to wetting in laboratory tests ... 32
3.2.3
Rockfill classification... 34
3.2.4
Definition of bulk density ... 35
3.2.5
Definition of rock mineral ... 35
vi
3.2.7
Definition of particle size ... 36
3.3
Materials tested ... 37
3.4
Equipment ... 39
3.5
Sample preparation and testing procedure ... 41
3.6
Testing program ... 41
3.6.1
Bulk density effects ... 41
3.6.2
Rock mineral effects ... 42
3.6.3
Stress state influences ... 43
3.6.4
Particle size effects ... 44
3.7
Test results ... 45
3.7.1
Bulk density effects ... 47
3.7.2
Rock mineral effects ... 48
3.8
Influence of stress state ... 51
3.9
Particle size effects ... 54
3.10
Conclusion ... 56
Chapter 4: Long-term oedometric behaviour of coarse crushed rock materials under
hydrostatic pressure ... 57
Résumé ... 57
Abstract ... 57
4.1
Introduction ... 58
4.2
Background studies ... 59
4.3
Research objective and methodology... 60
4.3.1
Materials tested ... 61
4.3.2
Equipment ... 62
4.3.3
Sample preparation... 65
4.3.4
Testing program ... 65
4.4
Test results ... 66
4.4.1
Multi-stage stress creep test under constant hydrostatic-pressure ... 66
4.4.2
Creep test under Multi-stage hydrostatic-pressure ... 70
4.5
Conclusion ... 73
Chapter 5: General Conclusion ... 74
References ... 77
Appendix 1: Experimental test results on Quebec region (Sablière Drapeau) granite 82
Appendix 2: Experimental test results on Sainte-Marguerite-3 Dam’s Anorthosite
(SM3) ... 121
vii
List of Tables
Table 1 : Material properties and the data on the tests ... 14
Table 2 : Nomenclature on oedometer modeling ... 18
Table 3 : Results of modeling oedometer test ... 21
Table 4: Samples characteristics and the results of the tests ... 24
Table 5 : Range of crushing strengths of some igneous metamorphic rocks (after
Wahlstrom 1974) ... 35
Table 6: Characteristics of the samples in the bulk density study on uniform crushed
granitic rock particles from Quebec (test series 1) ... 42
Table 7 : Initial properties of the samples tested for the rock mineral study (d
50=24mm, maximum vertical stress= 3MPa and compacted to maximum index
density) ... 43
Table 8 : Characteristic of the samples of one-dimensional compression tests used in
the stress state effects study ... 44
Table 9 : Results of one-dimensional compression tests in the stress state effects
study ... 52
Table 10 : Creep parameters for sands of Changzhou ... 60
Table 11 : Characteristic of samples in creep tests ... 65
Table 12 : Creep parameter for modeling of crushed granitic rock material of
Romaine ... 69
Table 13 : Creep parameters for Romaine crushed rock particles under multi-stage
hydrostatical-pressure ... 72
viii
List of figures
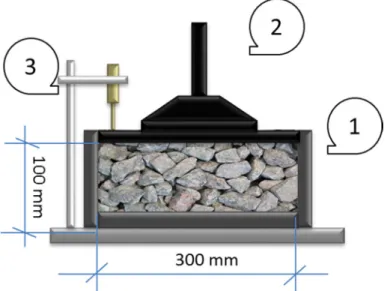
Figure 1 : 300mm oedometer cell and its main components: 1) cell 2) loading transfer
system 3) Displacement measurement (LVDT) ... 7
Figure 2 : 300 mm oedometer cell ... 8
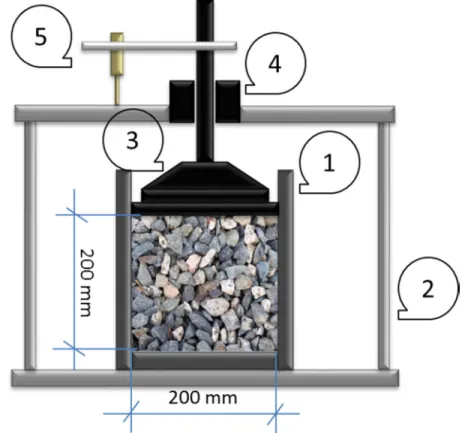
Figure 3 : 200mm oedometer cell and its main components: 1) cell 2) chamber 3)
loading transfer system 4) loading guide 5) Displacement measurement (LVDT)
... 8
Figure 4 : The 200 mm cell placed in the press machine during a compression test .... 9
Figure 5 : a) Fixed platen in 200 mm cell; b) Rotational platen in 200 mm cell; c)
Semi-fixed platen in 300 mm cell; d) Rotational platen in 300 mm cell ... 10
Figure 6 : Stress-strain curve in a large oedometer test on air-dry uniform crushed
granitic rock of Quebec ... 12
Figure 7 : a) Initial and final grain size distribution b) Variation of the grain size
distribution produced by particle breakage ... 13
Figure 8 : Distribution of vertical stress σ
yin the sample based on numerical
simulation of oedometric test after Verveckaite et al. (2007) ... 15
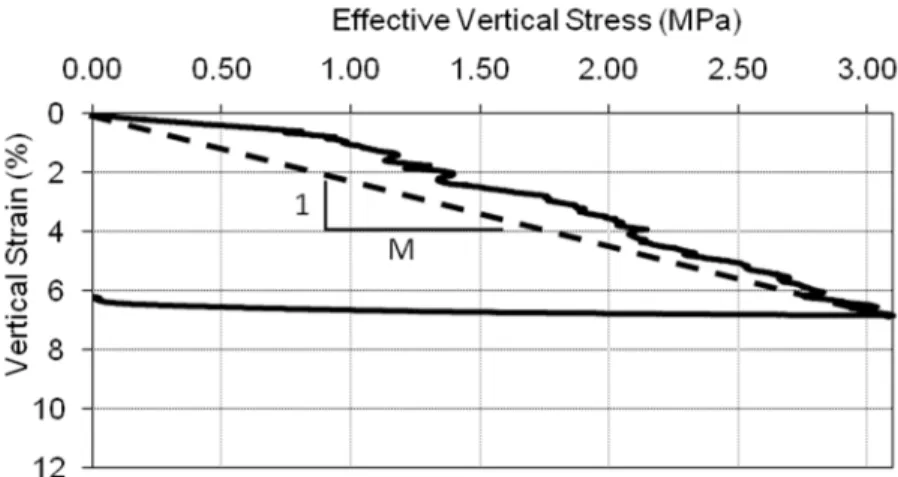
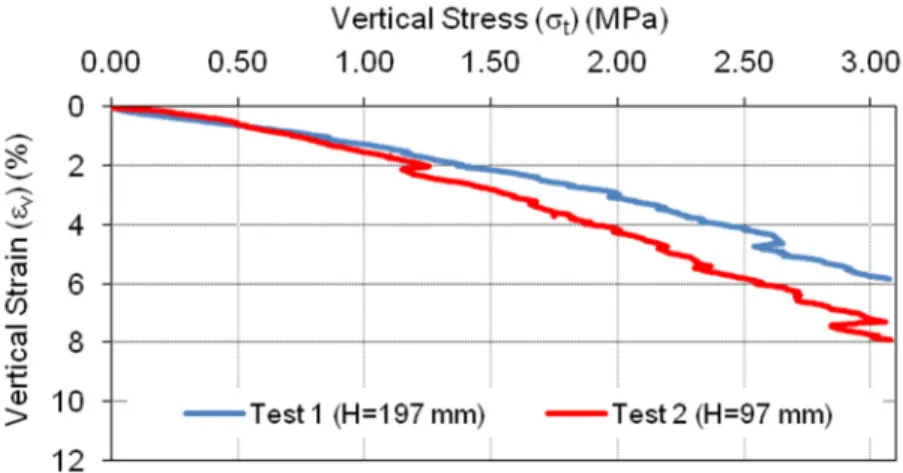
Figure 9 : Results of vertical strain versus vertical stress applied on the top of the
sample (Serie A) ... 16
Figure 10 : The oedometer test modeling ... 16
Figure 11: a) frictional force per unit area; b) equivalent vertical stress due to friction
... 17
Figure 12: Schematic of samples behaviour (AF
1and AF
2are the stress-strain at the
end of test) ... 19
Figure 13 : Modeling of sample behaviour (A
FLis the stress-strain in a frictionless
oedometer) ... 20
Figure 14 : Results of oedometer tests (solid line) and the result of model in a
frictionless oedometer (dashed line) ... 21
Figure 15 : Influence of the sample diameter (samples height=100 mm) ... 23
Figure 16 : Influence of the sample diameter in grain breakage (samples height=100
mm) ... 23
Figure 17 : Typical bilinear Strain-stress curve in oedometer test... 24
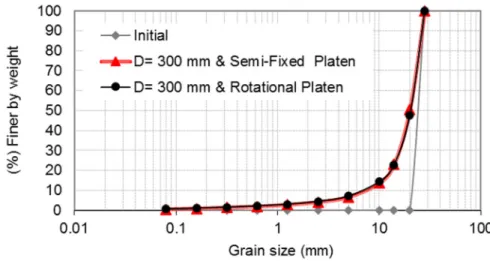
Figure 18 : Result of compression test using rotational platen and semi-fixed platen 25
Figure 19 : Result of the grain size analysis in compression test with the 300 mm cell
... 25
Figure 20 : Result of compression test with 200 mm cell (Oedometric modulus
dashed line) ... 26
Figure 21 : Result of grain size analysis in compression test with the 200 mm cell .. 27
Figure 22: Proposed distribution of vertical effective stress in the sample with
rotational platen (a) and fixed platen (b) ... 27
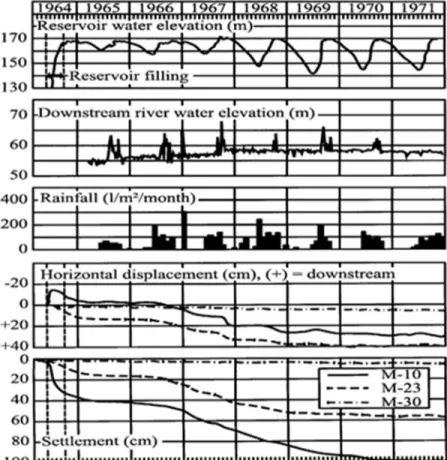
Figure 23: Infiernillo dam, Mexico (after Marsal et al. 1976) ... 31
Figure 24: Settlements and horizontal displacements observed in topographic marks
(after Marsal et al. 1976) ... 31
ix
Figure 26: (a) Effect of saturation at laboratory contact test of shaped point; contact
angle 169.1◦ (after Clements 1981) (b) Effect of jetting dry rockfill under load
and of initial wetting (after Sowers et al. 1965a) ... 33
Figure 27: Compressive strength of granitic rocks as a function of strain rate under
the confining pressures of: (a) 0.1 MPa, (b) 50 MPa, (c) 100 MPa, and (d)
200 MPa (after Masuda 2001) ... 34
Figure 28 : Grain size of crushed granitic materials before and after triaxial test (Lee
and Farhoomand 1967) ... 37
Figure 29 : Crushed rock particles of samples of: a) Quebec granite b) Romaine
granite c) SM3 Anorthosite ... 39
Figure 30 : a) Primary large scale oedometer equipment; 1) cell 2) chamber 3)
air-entering 4) pore water-pressure measuring 5) water-pressure measuring 6)
displacement measurements (LVDT); b) Final configuration of large scale
oedometer equipment ... 40
Figure 31 : Stress-strain behaviour of crushed rock particles with the fixed and
rotational platen ... 46
Figure 32: M3 calculation method for the test with the maximum stress level lower
than 3 MPa ... 46
Figure 33: One dimensional oedometer test on the uniform crushed granitic rock
particles of Quebec (Sabliere Drapeau) with d
50=24 mm ... 47
Figure 34 : One dimensional oedometer test on the uniform crushed granite rock of
Quebec (Drapeau) with d
50=24 mm ... 48
Figure 35 : Initial and final grain size distribution in the samples from Quebec
materials ... 49
Figure 36 : One dimensional oedometer test on the uniform crushed Anorthosite rock
of SM3 dam’s with d
50=24 mm ... 49
Figure 37 : Initial and final grain size distribution in the samples from SM3 materials
... 49
Figure 38 : One dimensional oedometer test on the uniform crushed granite rock of
Romaine’s dam with d
50=24 mm ... 50
Figure 39 : Initial and final grain size distribution in the samples from Romaine
materials ... 50
Figure 40: One dimensional oedometer test on the uniform crushed rock; granite of
Quebec (Drapeau), SM3 dam’s Anorthosite and Romaine’s dam Granite with
d
50=24 mm ... 51
Figure 41 : Vertical Strain-Vertical Effective Stress curve in the tests of Q-35, Q36,
Q37 and Q-38 (reference to Table 8) ... 53
Figure 42 : Particle size curve before and after the tests of Q-35, Q36, Q37 and Q-38
(reference to Table 8) ... 53
Figure 43 : Influence of stress state on oedometric modulus ... 54
Figure 44 : Effects of stress state on particle breakage at
effective verticalequal to 3 Mpa
... 54
Figure 45 : Effects of particle size on particle breakage at
effective verticalequal to 3
MPa ... 55
Figure 46 : Effects of particle size on oedometric modulus at
effctive verticalequal to 3
x
Figure 47 : Records of crest settlement of different types of rockfill dams built during
the twentieth century. Name (height in m) of the dam next to each curve (Data
sources: Marsal et al. 1976; Naylor 1997; Sherard and Cooke 1987; Smith and
Nguyen 2006; Soriano and Sànchez 1999) ... 58
Figure 48 : Particle size distribution curve of crushed rock for the creep test in
oedometer ... 62
Figure 49 : Schematic of large oedometer cell with hydrostatic-pressure control and
creep testing system ... 63
Figure 50 : Photo of the improved oedometer for creep testing ... 63
Figure 51 : Set-up of the large oedometer system with hydrostatic-pressure control for
creep test ... 64
Figure 52 : Stress and strain history in multiple-stages creep test ... 66
Figure 53 : Stress-strain behaviour of sample ... 66
Figure 54 : Log-log plot of creep curves ... 67
Figure 55 : Log-log plot of isochronal curves of stress-strain ... 68
Figure 56 : Results of creep modeling in a constant hydrostatic pressure (U=100 kPa)
... 69
Figure 57 : Results of creep modeling in log-log in a constant hydrostatic pressure
(U=100 kPa) ... 69
Figure 58 : Stress, strain and hydrostatic-pressure history in multiple-stages creep test
... 70
Figure 59 : Log-log plot of isochronal curves of hydrostatic pressure-strain ... 71
Figure 60 : Results of creep modeling in the variable hydrostatic pressure ... 72
Figure 61 : Results of creep modeling in log-log in the variable hydrostatic pressure
... 72
xi
Acknowledgements
The completion of my PhD project was made possible by the contribution of many people and organizations.
I would like to warmly thank my thesis supervisor, Professor Jean-Marie Konrad, for his invaluable support and patience, for his precious and never lacking enthusiasm for research. I want to thank him for warmly guided me through the course of this research that has led to the discovery of many results in this thesis. I would like to thank him for his unique way of leadership and interminable ideas. I also acknowledge him for assisting me financially during my Ph.D.
I would like to express my gratitude to engineer Francois Gilbert, whose expertise, understanding and patience, added considerably to my graduate experience. I want to thank him for patiently listening to all my requests and providing help whenever needed. I also want to thank him for providing me with insight, which helped me solve many of the problems I encountered with the laboratory equipment.
I would like to thank Dr Jacques Locat from Université Laval and Dr Tikou Belem from UQAT (Université du Québec en Abitibi-Témiscamingue) and Dr Jean Côté from Université Laval for having accepted to evaluate this thesis and participate in the jury. I also want to thank them for their very interesting comments and suggestions that allowed me to improve the quality of this thesis.
This research work was funded through the NSERC (Natural Sciences and Engineering Research Council of Canada)-Hydro-Québec Industrial Research Chair in life cycle optimisation for embankment dams (CRIBAR).
I thank the professors and the students of the Geotechnical Section, the members of CREIG (Chaire industrielle de Recherche sur l’Exploitation des Infrastructures soumises au Gel) and CRIBAR, who were the great friends and advisers.
Finally, I would like to specify my eternal appreciation to my wife, Maryam, for her love, encouragement and endless supports through my life.
xii
To
My wife “Maryam”
&
1
Chapter 1: General Introduction
During the past century there has been a trend toward building high dams, particularly for a hydroelectric purpose. A rather thin core supported by rockfill shoulders was the most economical and safe design for such dams. The impounding of dams put the rockfill materials of upstream under wet condition. The major inconvenience of rockfill materials is the different settlement in air-dry and wet conditions. There are different reports of settlement and deformation inspection of rockfill dams during impounding (Justo 1991) and operation of these structures (Mohammadzadeh 2010). These deformations are likely to result in cracking of the core or cause local high stress regions in the body of the dam.
This is a well-known phenomenon which has received a continuous interest ever since the worldwide use of rockfill in dams and, more particularly, since the beginning of the 20th Century. In large earth and rockfill dams, rapid collapse settlements have been associated with water impoundment. It was also soon realized that wet compaction reduced notably collapse settlements as well as the rate of settlement development in time (Sherard and Cooke 1987).
The first impoundment leads usually to the maximum collapse settlements in the upstream shoulder. However, Alonso (2003) has shown that strong rainfalls may also contribute to significant volumetric deformations during the early life of dams in downstream.
The physical local phenomena at the particle scale govern the global behaviour of rockfill dam. It is important to have an understanding of particle behaviour under the condition in which they are subjected. In the upstream, the rockfill materials are under hydrostatic-pressure. The hydrostatic-pressure starts at the impounding moment and continues in whole life of service in a rockfill dam. However, there is a lake of literature about the influence of hydrostatic-pressure on rockfill materials. The first aim of this thesis is to study the influence of hydrostatic-pressure on the mechanical behaviour of rockfill material. In this way, the experimental test is carried out on crushed rock particles under the similar condition of rockfill materials of upstream. The experimental tests are realised by means of the large (200 and 300 mm diameter) oedometers.
The design of rockfill dams needs information about rockfill materials. Furthermore, the performance of designed rockfill materials which come from different sources must be evaluated before their use in a specific dam (Ramsay et al. 1974). However, the data on the mechanical behaviour of rockfill materials are scarce in the literature. The large particle size of rockfill materials is the principal cause of few laboratories tests on representative samples.
A common classification similar to soil materials is necessary for rockfill materials to harmonize the research in this domain. The description and, in particular, the classification of aggregates in a manner appropriate to their use in the construction industry has long posed problems, not only of a scientific nature but also from practical and commercial points of view (Smith and Colhs 2001).
Rockfill materials can be classified in a variety of ways, the chosen method depending on the nature of the rock and the use for which the classification is required. As noted earlier, the settlement of rockfill materials is an important parameter in rockfill dam. This parameter can be worthwhile in the classification of rockfill materials for using in dam design. The following is a review of the major finding during last decades used to obtain different parameters on the rockfill behaviour.
2
One of the basic parameter is the bulk density which is not an intrinsic property of a material. It can change depending on how the material is handled. It depends partially on the particle properties. In rockfill, it depends on rock quality like compactness, uniformity, cracking and its mineralogy. The bulk density has great influences on the compression behaviour of fill materials. It is attainable in field and can be selected as a classification parameter in fill materials.
The mechanical behaviour of rockfill materials is mainly dependent on the rock particle mineral. Hartley (1974) provided a useful summary of the main petrographical factors affecting the toughness or crushing strength of aggregates. Furthermore, each rock mineral type behaves differently in air-dry or flooded with/without hydrostatic-pressure. The behaviour of rock particles under the above-mentioned conditions can be an excellent parameter for the choice of materials in rockfill dams.
Rockfill is a granular material constituted by rock particles with a diameter varying between 0.5 to 1.5 meters. In practice, it is not economical to test samples of rockfill in a real scale. An alternative is to test on the scaled granular material and extend this knowledge to the real situation. This method needs an excellent understanding about the effect of grain-size on the behaviour of a granular material. Lee and Farhoomand (1967) have investigated the influence of grain size on the mechanical behaviour of granular materials. Their experiences include the triaxial tests on soils with uniform gradation. Materials with smaller maximum particles size have fewer breakages. Their results have also shown that coarse uniform soils are more compressible than fine uniform soils.
The effect of the grading on rockfill behaviour, focusing on the effect of the degree of uniformity of the grain size and the fine fraction has been recently studied by Ramon et al. (2008). Their results indicate that grading with a higher uniformity (poorly graded) have a more compressible behaviour and enhanced collapse deformations than well graded distributions when they have in common the d50 dimension. In the case of grading with the same degree of uniformity, a smaller d50 value means a less compressible behaviour and a reduced collapse deformation.
The distribution of defects inside the particles is the origin of this observation. A bigger particle has more defects than a smaller one. The more defects in particles result in less tensile strength of the particles. This fact has been observed experimentally by Marsal (1973), Barton and Kjaernsli (1981), Lee (1992) and Nakata et al., (2001) among others.
The stress in granular materials is transmitted to the particles through forces acting on contact areas. Therefore, a higher stress state results in a higher contact force between particles. In consequence, there is a higher probability for particles breakage. These phenomena are well-known in granular materials. Mesri and Vardhanabhuti (2009) have examined sand samples to clarify their compression characteristics. Their results indicate that during the increase in effective vertical stress, mechanisms such as tighter packing and particle damage determine the relationship between void ratio and effective vertical stress. This behaviour is observed by several researchers in rockfill dams and also in laboratory tests. Holestol et al. (1965) measured settlements of the Venemo rockfill dam in Norway. This dam was composed of spoil from a tunnel excavation in sound unweathered granitic gneiss and amphibolite rock. Settlements at various locations within this 61m high dam were measured by settlement gauges buried within the fill. Compression increased with depth below the fill surface, and amounted to about 5 per cent near the base of the dam for a period of two years during and immediately after construction.
The classification of any granular media is not completed without considering the effect of bulk density, rock's mineral, particle size, and stress state. Furthermore, it is unsafe to use the rockfill materials in dams before their examination under three essential conditions of wet, dry and under hydrostatic-pressure.
3
Rockfill materials are used in many structures such as breakwaters, railway embankments and dams. These structures are commonly exploited for a long time. Furthermore, the significant weight of rockfill media creates the creep deformation in rockfill structures. In rockfill dams and many earth dams, creep is responsible for the majority of post-constructive displacements which, in turn, may produce cracking of the impervious element or piping (Justo and Durand 2000). Continuous settlements have been recorded in rockfill dams after their construction and for many decades (Marsal et al. 1976; Sherard and Cooke 1987; Sowers et al. 1965a). The crest settlement records of some dams built during the twentieth century show that the deformation process is still active after 10, 20 and 30 years of operation.
Time dependent strains are commonly superposed on another source of deformation. An understanding of the time-dependent deformation should be helpful in developing a comprehensive engineering approach to qualify the rockfill materials.
Time dependent behaviour of geomaterials has been recognized in clays (Bjerrum 1967; Leroueil 1996, 2006), in sands (Di Benedetto et al. 2002; Lade and Liu 1998; McDowell and Bolton 1998; Tatsuoka et al. 2000), in rocks and soft rocks (De Gennaro et al. 2003; Fabre and Pellet 2006; Šuklje 1957) and in rockfill (Alonso et al. 2009; Oldecop 2007; Shen and Zuo 1991).
Oldecop (2007) proposed a model based on crack propagation for unsaturated rockfill materials. Various constitutive models take into account time-dependent behaviour of rockfill using a logarithmic relationship between time and the long-term strain component (Charles 1991; Sowers et al. 1965a; Zhang et al. 2006) examined the creep of various sands in drained oedometer tests. According to the Zhang results, a linear relationship was obtained between the logarithms of strain and stress.
McDowell and Khan (2003) have examined the creep of brittle granular materials subjected to one-dimensional compression. The test results of pasta material are compared with the behaviour of sand at much higher stress levels. It was found that for both materials, particle crushing was the possible mechanism for creep. Based on the previous research on sand and other non-cohesive granular material, it can be concluded that the creep behaviour in coarse granular material is due to particle crushing. As explained previously, the first aim of this thesis is to study the influence of hydrostatic-pressure on the mechanical behaviour of rockfill material during reservoir filling and during dam operation. The experimental test on the scaled sample of crushed rock particles is chosen to bring out the effects of hydrostatic-pressure. The oedometer test is chosen as the most representative test for the settlement behaviour of granular materials. This type of test is chosen for its simplicity, its low-cost and the minimum parameter to manage. The materials which tested under hydrostatic-pressure are compared with the materials tested in two reference state of material means wet and air-dry. The materials are tested under short-term loading to see the instantaneous behaviour of materials. The materials are also tested under long-term loading to see the effects of hydrostatic-pressure in a long period of time. The order of the presentation of these topics in the thesis is as follows:
In chapter 2, two granitic crouched rock particles are used to study the influences of friction between materials and oedometer wall on the test results. The experimental tests are realized by means of two large (200 and 300 mm diameter) oedometers. The tests were realized on different diameters and heights of the sample. The study results propose the adequate oedometer dimension to have the minimum of wall friction in the samples of crushed rock particles. Chapter 2 also treats the distribution of stress within the sample that is directly related to its mechanical loading. Three different loading transfer systems were designed and fabricated to bring out their influences on oedometer test results. These systems transfer
4
the loads using a fixed, a semi-fixed and a rotational platen. The degree of freedom in these systems was 1,2 and 3, respectively.
One of the most conspicuous phenomena observed in rockfill masses when stressed is the fragmentation of the component grains. Particle breakage changes the grain size distribution and significantly affects the deformation characteristic of the materials. The chapter also contains the concepts and formulas for studying the amount of grain breakages due to change in the state of stress in samples.
The oedometric modulus is one of the parameters, which can be used to model the behaviour of crushed rock particles at each level of stress. The chapter explains how M3 (oedometric modulus at the stress level of 3 MPa) can be used as an important parameter to show the behaviour of crushed rock particles in an oedometer test.
In chapter 3, a new large oedometer cell was designed to perform the test on the materials under hydrostatic-pressures. The concept led to realize the tests under different hydrostatic-pressures without any changes in effective stress. The apparatus let to test the materials in the relevant condition which they are found in rockfill dam structures. The oedometer had 200 mm diameter and was used to study the materials under air-dry, wet and under different hydrostatic-pressure. The samples have the height about 100 mm with the particle size which varies from 20 mm to 56 mm.
Chapter 3 presents an experimental investigation on the four parameters which influence significantly the compression behaviour of crushed rock particles. The studied parameters were bulk density, rock mineral type, stress state and particle size. The tests consisted of the one-dimensional compression tests on the anorthosite and two types of granite rock particles. The first type of granite come from a Quebec region quarry named Sablière Drapeau. The second type of granite come from Romaine project. The project involves four rockfill dams in the north of Havre-Saint-Pierre, in Minganie (Côte-Nord region), Quebec. Anorthosite materials come from the Sainte-Marguerite-3 (SM-3) rockfill dam. The dam is located some 90 km north of the town of Sept-Îles, Quebec. It is among the highest rockfill dam in eastern Canada. SM-3 has a 171 m high rockfill dam that created a 140 km long reservoir, some 120 m deep near the dam toe.
The major objective of chapter 4 is to show that hydrostatic pressure has influences on the creep behaviour of the assemblage of crushed rock particles. The one-dimensional creep tests are carried out under constant and variable hydrostatic-pressure. The tests were realised on the granitic materials of Romaine rockfill dams. The maximum particle-size of the crushed rock in studied assemblages was limited to 32.5 mm. The tests were carried out on the 100 mm samples in a large oedometer of 200 mm. The three-parameter phenomenological model of sand is used to model the multiple stress stage creep behaviour of coarse granular materials under constant hydrostatic-pressure. The similar behaviour of coarse and fine grain materials confirms that the creep behaviour of all brittle granular materials could essentially be the same.
Finally, the chapter also presents a four-parameter phenomenological model developed to reproduce the multiple stress stages creep behaviour of materials under multiple hydrostatic-pressure stages. The model can be used to describe the strain-stress-hydrostatic pressure-time relation of crushed rock particles in an oedometer creep test.
5
Chapter
2:
Using large oedometer cells to
characterize the behaviour of an assemblage
of crushed rock particles
Résumé
Des essais de compression sur des échantillons de roche concassée grossiers en granite ont été réalisés dans les cellules œdométriques de 200 et 300 mm de diamètre. Les grains utilisés sont tous uniformes avec la dimension moyenne de 24 mm. Une étude systématique a été effectuée sur l'équipement œdométrique et les facteurs qui influencent les résultats de l’essai. Il a été établi que la hauteur de la cellule a une grande influence sur la réponse de compression de ces roches concassées. La force de frottement entre la cellule et l'échantillon est la source de ce comportement. Une méthode simple, basée sur un double essai œdométrique peut être utilisé afin de définir la force de frottement dans les échantillons. Un autre facteur qui a aussi des effets sur la réponse de compression de la roche concassée dans l’essai œdométrique est la manière dont la charge est transférée à l'échantillon. Trois systèmes ont été utilisés pour étudier l'influence de différentes techniques de chargement des échantillons. Ces systèmes utilisant le plateau fixe, librement mobile et le plateau rotulé afin de transférer la charge à l’échantillon. Le système de plateau fixe crée un transfert non-uniforme de la charge dans l'échantillon, contrairement aux autres systèmes étudiés. Subséquemment, les résultats obtenus avec le plateau fixe doivent être utilisés avec une précaution particulière.
Abstract
One-dimensional compression tests were conducted on assemblage of coarse crushed granitic rock particles to study the influence of large (200mm and 300mm diameter) oedometer equipment on their compressional behaviour. The used crushed rock particles were uniform with an average diameter of 24 mm. It has been established that the height of cell has a great influence on the compression response of these assemblages of crushed rock particles. The frictional force between cell and sample was the source of this behaviour. A simple method, based on a double oedometer test, can be used to define the frictional force in the samples. Another factor which has also the effects on the response behaviour of crushed rock in oedometer is the loading transfer to the sample. Three systems were used to investigate the influence of different techniques of loading the samples. These systems transfer the loads using a fixed, a semi-fixed and a rotational platen. The fixed platen system creates a non-uniform transfer of loading in the sample in contrast to the other studied systems. Thus, the results obtained with the fixed platen of loading, must be used with a special caution.
6
2.1 Introduction
A classical oedometer test is a laboratory test that allows characterizing the soil stress-strain behavior during one-dimensional compression. The device appears to have been developed by J.Frontard in France, around 1910 (Powrie 2004). Karl Terzaghi’s discovery about the principle of effective stress was based on the results of a series of experiments using oedometers, carried out in the early 1920s at Robert College in Istanbul, Turkey (Bjerrum et al. 1961). The tests are performed by applying loads to a soil sample, confined in a rigid ring (about 75 mm), and measuring the deformation response.
Initially, this apparatus was developed to investigate the one dimensional stress-strain behaviour during compression or swelling of cohesive soils. The need to understand the deformation characteristic of coarser materials (sand, gravel and rockfill) extended its use to the study of these granular media. Consequently, there was a continuous effort to develop larger consolidation cells in order to test specimens with field gradations in order to subject them to representative levels of load. Several researchers (Abbasi and Konrad 2009; Fumagalli 1969; Honkanadavar et al. 2011; Marsal 1973; Massiéra et al. 1999; Oldecop and Alonso 2001; Ramon et al. 2008; Sowers et al. 1965b) have studied the behaviour of coarse granular materials with large oedometers in which the diameters varied from 200 to 1000 mm.
In an oedometer test the side friction between the ring and the sample plays an important role. Substantial shear stresses develop on the wall of an oedometer during compression test, so that the applied load is not transmitted equally to all points of sample (Parkin 1991). Several methods are used by researchers to minimize the sidewall friction.
The use of floating rings can result in less wall friction rather than a fixed ring(Lamb 1953). Disadvantages of the floating ring are related to difficulties in set up, and to soil squeezing or falling out of the junction of the bottom porous plate and ring (Day 2006).
Wall linings are more common means for reducing sidewall friction (Egretli and Singh 1988), but inefficient for angular crushed rock particles. Another possible means of overcoming this problem is using a compressible material (such as rubber) between cell and sample (Fumagalli 1969). The initial calibration of machine with such a material may not necessarily remain valid after compacting a sample in place. Because of these disadvantages, the fixed ring oedometer is the most popular and easiest setting setup. The clear conclusion that arises from all this experimental work is that the friction in oedometer test cannot be eliminated completely.
Ever since Terzaghi, the oedometer test has been improved and corrected many times (Chen 2000). However, researchers have less treated the load transfer system. The distribution of stress in the sample is directly related to its loading condition. Three loading transfer systems were designed and fabricated to bring out their influences on oedometer test results.
2.2 Material tested
Two different granitic crushed rock particles are used to study the side friction effects on oedometer test. These materials are referred to as Quebec and Romaine crushed rock particles. Quebec’s material was from the Quebec region (Sablière Drapeau). The particles contained about 66% granitic gneiss, 24% biotite, and 9% hornblende (Konrad and Lemieux 2005). The particle density and water absorption for particles size between 20 mm and 28 mm, in accordance with BNQ 2560-067(1983) was 2.69 and 0.59%, respectively. Romaine’s granite was from the crushed rock particles of Romaine’s rockfill dams’ site. The Romaine project involves the construction of four rockfill dams in the north of Havre-Saint-Pierre, in
7
Minganie (Côte-Nord region), Quebec. The heights of rockfill dams are 37.6, 121, 92 and 87.3 meters. The particle density and water absorption of Romaine's materials was 2.71 and 0.49%, respectively. These values are measured using uniform particle size varying between 20 mm and 28 mm in accordance to the BNQ 2560-067(1983) method.
2.3 Apparatus
The experimental tests were carried out using two large fixed ring oedometer. The diameters of rings were 200 mm and 300 mm, respectively. In the following, these two cells are described in detail.
2.3.1 300 mm oedometer cell
The cell, as shown in Figure 2, consists of a 300 mm diameter tube which acts as a shell, with a wall thickness of 7 mm. A welded flange to the shell allows the unit to be bolted onto the base plate. The cell parts are made from steel (see Figure 2). The height of the shell allows having samples with a height to diameter ratio of 1/3 (maximum height = 100 mm). The upper plate consists of a disc which loads the sample through different loading systems described below in detail. The ring wall and the base plate have smooth surfaces. They are polished before each test in order to have the same contact condition between cell and sample.
LVDTs were placed outside of cell on the base plate. They measure the displacement of three points of the upper plate. These points are considered carefully to be on the border of the disc with equal distance from each other. The average of these measurements is equal to the axial displacement of the sample. The required load is provided by a press. It can apply up to 500 kN with imposing constant displacement rates from 4 to 112 (mm/day). The load is transferred to sample by a stiffened thick plate (25 mm) to prevent the bending in the upper plate. A load cell is installed between the press and cell. It measures the loading force before applying to sample. The load cell has capacity of 445 kN with nonlinearity about ±0.05% of maximum capacity. The results of the test are monitored and recorded by a data logger, connected to a personal computer.
Figure 1 : 300mm oedometer cell and its main components: 1) cell 2) loading transfer
system 3) Displacement measurement (LVDT)
8
Figure 2 : 300 mm oedometer cell
2.3.2 200 mm oedometer cell
Figure 3 shows the schematic of 200 mm oedometer cell. The cell consists of a stiff ring metal and a thick plate in the base. The metallic ring diameter is 200 mm with a thickness of 12.5 mm. The ring is quite thick to guarantee negligible radial movements of the sample. The ring length allows having a maximum sample height of 200 mm. The height of the shell allows having samples with a height to diameter ratio of 1. The base plate is a disc with the same diameter of the ring and has a thickness of 25 mm.
Figure 3 : 200mm oedometer cell and its main components: 1) cell 2) chamber 3)
loading transfer system 4) loading guide 5) Displacement measurement (LVDT)
9
Figure 4 : The 200 mm cell placed in the press machine during a compression test
The cell is fixed in the second cell called chamber. It (see Figure 3) is designed to make a rigid structure supporting the loading transfer system. The main parts of the chamber consist of the base plate, the top plate and a metallic ring. The cell is centered at the chamber’s base plate.
A special assembly is designed to transfer the load from press to the sample. The assembly contains the stiffened plate, the stainless steel rod and the guide. The rod transfers the load from the press to the platen (stiffened plate) throughout the guide which is parallel to the sample. The guide is cylindrical and is equipped with an interior ball bearing. The guide is installed in the center of the top plate's chamber. This system guarantees the alignment of the force relative to the sample and decreases the frictional force between the rod and the chamber.
The axial displacement is recorded using a LVDT, located outside the cell. The LVDT is installed on the loading transfer rod. It measures the displacement of the loading transfer rod and the upper side of the chamber top plate. The displacement of sample is directly related to the displacement of loading transfer system. The LVDT range is ±25 mm with nonlinearity about ±0.25% of total range.
2.3.3 Load transfer systems
In oedometer test, the platen is used to load the sample. The properties of platen especially that made of soft materials have a significant influence on the transferred load to the sample. In this study, the platens were all made of thick stainless steel to prevent the bending in platens which in turn decrease the influences of the platen material properties on loading. The degree of freedom of platen has also the significant influence on the transferred load to the sample. Three types of assembly were designed and fabricated in the laboratory to simulate specified degrees of freedom in platen by different connection between rod and platen. These assemblies represent the platen with the following motion condition:
10
Fixed (
degree of freedom=1)
Semi-fixed (
degree of freedom=2)
Rotational (
degree of freedom=3)
Figure 5 illustrates the different loading transfer system fabricated in the laboratory. The vertical displacements of the platen create the transfer of loading to the sample in all assemblies. In the fixed assembly, the horizontal displacement and the rotational movement of the platen are prevented by an internal bolt which connects the rod to the platen (see Figure 5-a).
In the semi-fixed assembly, the rod is just superposed on the platen without any mechanical connection. The configuration let the platen easily rotate or displace horizontally. The semi-fixed platen of 300 mm cell consists of two thick plates with different diameter size (see Figure 5-C). The upper plate is used to prevent the bend in the lower plate.
In the rotational assembly, the horizontal displacement of the platen is prevented, whilst the platen can easily rotate. The rotational assembly is fabricated using a ball-and-socket system between rod and platen (see the right hand side of Figure 5).
The used assemblies in the 200 and 300 mm cells are shown in Figure 5 at the top and bottom, respectively.
Figure 5 : a) Fixed platen in 200 mm cell; b) Rotational platen in 200 mm cell; c)
Semi-fixed platen in 300 mm cell; d) Rotational platen in 300 mm cell
11
2.4 Procedure of sample preparation
The samples were uniform coarse crushed granitic rock particles. The grain size distribution was determined before oedometric compression. Uniform samples were produced from particles retained on two subsequent sieves. The air-dry crushed particles put into the cell in one layer. The surface of samples is levelled prior to compaction to let the most uniform contact between particles and platen. Several methods can be used to level the sample surface. The sides of the mold may be struck a few times using a metal rod, rubber hammer, or similar tools to settle the particles so that the surcharge base plate can easily be placed into position. The used method in this study was the vibration of sample under a light surcharge plate to level the surface.
The compaction of each sample is achieved with a vibrating table. It is known that the compaction method by vibrating table make a moderate amount of particle breakdown (ASTM-D4253-00). The grain breakage is measured on about 15 samples of 200 heights on 200 mm cell. The results are shown a grain breakage of maximum 2% in samples. In a vibrating table three parameters are important; the amplitude of vibration, the duration of vibrating and the surcharge mass. The samples were compacted to achieve low and high density. The high density samples were obtained according to the recommended vibration value (ASTM-D4253-00) to achieve the maximum density in samples. The amplitude, surcharge force and duration of vibrating were ±0.33±0.05 mm, 14 kPa and 8 minutes, respectively. For low density simples, these values were ±0.33±0.05 mm, 4.6 kPa and 1 minute, respectively.
After the vibrating, the height of sample was measured and the cell installed on the press. The displacement transducer was installed and connected to the acquisition system. The oedometer test includes loading uniformly the sample to a predefined level of stress and completely unloaded. After each test, grain size analysis was performed on the oven-dried sample. Grain size analysis was used to determine grain breakage during the test.
2.4.1 Oedometric modulus
Figure 6 shows a typical example of strain-stress curve including an unloading path, in a large oedometer test on the uniform crushed granitic rock of Quebec. The vertical strain is plotted in percent, from the top to down of y-axis to show the settlement in the sample. The tested materials display a nonlinear relationship between stress and strain. The oedometric modulus which qualifies the materials softening was used to describe the behavior of materials. The oedometric modulus Mv defined as the ratio of the v versus v curve at any specified stress or strain equation (2.4.1). It is the slope of a line (dashed line in Figure 6) from origin to any point on a strain-stress curve.
v v v M
Equation Chapter 2 Section 4 (2.4.1)12
Figure 6 : Stress-strain curve in a large oedometer test on air-dry uniform crushed
granitic rock of Quebec
2.4.2 Grain breakage
One of the most conspicuous phenomena observed in rockfill masses when stressed is the fragmentation of the component grains. Particle breakage changes the grain size distribution and appreciably affects the deformation characteristic of the materials. The concepts and formulas presented in following were used by (Marsal 1973) as a fact for studying the factors controlling particle breakage and for deriving a procedure to evaluate the amount of grain breakage due to change in the state of stress.
The gradation of a granular material changes during the loading process due to breakage of particles. The degree of grain breakage depends mainly on the gradation, the crushing strength of the grains, and the stress level. The result of an oedometric test on the crushed granite from Quebec is used to illustrate the procedure and to obtain a quantitative measure of grain breakage. The initial and final grain size curves are shown in Figure 7a, where Wki and Wkf are the weights of kth fraction before and after testing respectively, expressed as a percent of total weight of sample. The differences Wk between the percentages of the total sample contained in each grain size fraction before end after the test is plotted versus the opening of the upper sieve corresponding to that fraction (Figure 7b). The algebraic sum of Wk must be zero. A parameter Bg equal to the sum of the positive Wk, expressed in percent is selected as a measure of grain breakage. Values of Bg are the percentage by weight of the solid phase that has undergone breakage.
13
Figure 7 : a) Initial and final grain size distribution b) Variation of the grain size distribution produced by particle breakage
2.5 Testing program
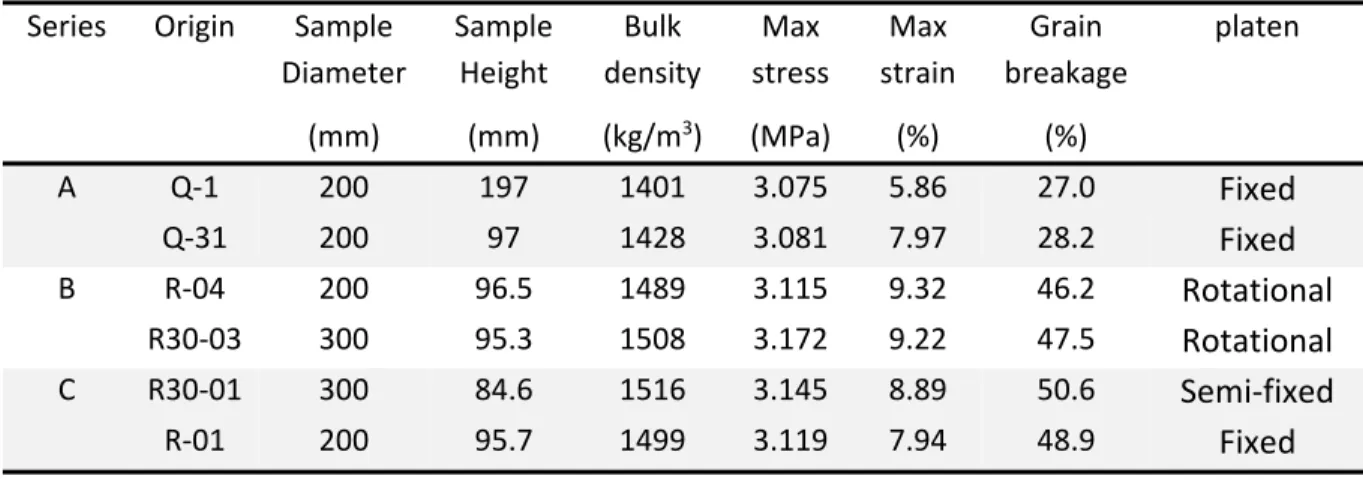
Three test series (A, B and C) were conducted to investigate the effects of oedometer height, oedometer diameter and the effect of loading transfer system on the behaviour of coarse crushed rock particles. Table 1 shows the material properties, maximum stress applied to the sample and the connection type between rod and top platen. The tests were carried out in the air-dry condition under atmospheric pressure. The Quebec and Romaine materials are distinguished in the table with the test's name that starts with 'Q' and 'R', respectively. The grain size presented in Table 1 refers to the average of the particle size.
14
Table 1 : Material properties and the data on the tests
2.5.1 Test series A: effect of the height of oedometer
Test series A consisted of two tests with uniform crushed granitic rock particles from Quebec. The samples were equal in diameter but different in heights. The ratio of the height (h1/h2) in the samples was equal to two. The tests were realized on the two samples with almost identical bulk density (less than 2% variation). The loading transfer system used in these tests was a fixed connection.
2.5.2 Test series B: effect of the diameter of oedometer
Test series B includes two tests on uniform crushed granitic rock particles from Romaine’s rockfill dam. The tests were realised using two different oedometer cells with an internal diameter 200 mm and 300 mm, respectively. The height of the tested samples and their bulk density were almost identical. The samples were compacted uniformly in the cell before the test to have the maximum density (ASTM-D4253-00 2006). The variation in bulk density and height of the samples was about 1%. The loading transfer system used in the two tests was a rotational connection.
2.5.3 Test series B and C: effect of the loading transfer system
The test series C consisted of two tests with the fixed, and the semi-fixed loading transfer systems presented previously in Figure 5. The tests were carried out on the uniform crushed rock particles from Romaine's site. The samples were compacted uniformly in the cell before the test to have the maximum density (ASTM-D4253-00 2006). As presented earlier, the test series of B is carried out using rotational loading transfer system. The series B and C were used to understand the effect of the loading transfer system on the oedometric test results. The average bulk density of the samples was 1503 with variation less than 1%.
Series No. Origin d50 Sample Diameter Sample Height Bulk density Vibration Method Max stress Platen motion (mm) (mm) (mm) (kg/m3) (MPa) A 1 Q‐1 24 200 197 1401 Low 3.075 Fixed 2 Q‐31 24 200 97 1428 Low 3.081 Fixed B 1 R‐04 24 200 96.5 1489 High 3.115 Rotational 2 R30‐03 24 300 95.3 1508 High 3.172 Rotational C 1 R30‐01 24 300 84.6 1516 high 3.145 Semi‐fixed 2 R‐01 24 200 95.7 1499 high 3.119 Fixed
15
2.6 Test results
2.6.1 Influence of sample’s height
The presence of friction between the sample and the sidewall of the cell can result in a significant reduction of the applied load to the sample. Egretli and Singh (1988) used load cells in the upper and lower parts of the sample to measure the extent of load loss. Friction effects can account for the loss of up to 40% the loading between the top and bottom of the sample.
Verveckaite et al. (2007) used a numerical modelling in order to analyse stress and strain distribution in a sample during the oedometer tests. The oedometer sample, 87.5 mm in diameter and 35 mm in height, was simulated by a linear model. The results of the analysis showed that shear stress and vertical stress (Figure 8) distribution in the sample was not uniform. They concluded that a part of vertical load was transfered into shear stress in the sample by ringwall.
Figure 8 : Distribution of vertical stress σ
yin the sample based on numerical
simulation of oedometric test after Verveckaite et al. (2007)
Height of sample has undoubtedly a great deal of effect in the final results of the test. The reason is that, both the shape of distribution and the amount of frictional force change as the sample height changes. Figure 9 shows the vertical strain versus vertical stress applied on the top of the samples. The vertical strain at the end of test in the taller sample is significantly lower than that observed for the shorter sample. The frictional force acting on the sidewall of the sample and cell is the origin of this difference. The frictional forces can be calculated by an analytical modeling of the oedometer compression test presented in the following section.
16
Figure 9 : Results of vertical strain versus vertical stress applied on the top of the
sample (Serie A)
2.6.2 Modeling
Figure 10 shows a schematic of the oedometer test and the conventional variable designations for the oedometer test modeling. The vertical stress which is applied on the top of the sample should be calculated using the equation (2.6.1) in which Q is the loading and R is the sample radius.
t
Q
2R
Equation Section 6 (2.6.1)Vertical strain is calculated by equation (2.6.2) in which h is the sample height and h represents the deformation of the tested sample.
0 v
h
h
(2.6.2)17
Figure 11: a) frictional force per unit area; b) equivalent vertical stress due to friction
As outlined before, in an oedometer test, there is the friction between the metallic ringwall and the grains. The frictional force can be represented by a uniform force per unit of surface ( ) applied uniformly on the vertical surface of sample (Figure 11a). The frictional force per unit of side wall surface ( ) can easily be converted to an equivalent vertical stress by equation (2.6.3).
2
R h
e
R
2 (2.6.3)This vertical stress (2 h R
) causes a non-equal vertical stress at the bottom and at the top of the sample. Reznik (2000) has shown that the stress in the bottom of the sample could be calculated using the equation(2.6.4).b t
2
h
R
(2.6.4)Equation (2.6.4) shows that the frictional force is directly related to the height of the sample and is inversely proportional to the radius of the sample. Reznik’s study was on the quasi-uniform soil materials. In this study, the equation (2.6.4) has also been used to describe the influence of the sample height on the oedometer test results and the transferred applied load in the sample. Table 2 summarize the nomenclature used in this study.
18
Table 2 : Nomenclature on oedometer modeling
Figure 12 shows the schematic linear behaviour of the sample during tests. The representation for samples 1 and 2 are shown with the lines OAF1 and OAF2, respectively. FL is the stress applied to the top of the samples (
1 2
t t FL
). 1 and 2 refer to the vertical strain in the samples. As it can be seen, the material behaviour is assumed to be linear. Assuming the same diameter in samples, the following equations give the stress at the bottom of each sample using equation(2.6.4).b1 t1
2
1h
R
(2.6.5) b2 t22
h
2R
(2.6.6)In Figure 13, it is supposed that the line OAFL indicates a linear modeling of a sample in a hypothetical frictionless oedometer test. In other words, FL is the stress on both top and the bottom of a frictionless oedometer test. The intersection of line OAFL and the lines parallel to V axis at 1 and 2 is the stress
h0 Initial sample height h Deformation value of sample
R Oedometer ring radius
t Stress applied at the top of the sample b Stress at the sample bottom
Frictional force per unit of surface (created between oedometer ring and lateral surface of sample)
e
Equivalent vertical stress due to friction created on the bottom of the sample Oedometer modules of the material in a frictionless oedometerD Grain size
Subscript 1 test number 1 Subscript 2 test number 2
Subscript F Normal oedometer with friction Subscript FL Frictionless oedometer
19
applied to a frictionless oedometer test to have these deformations. In other word, FL1 and FL2 are the stress at the top and bottom of a frictionless oedometer test that cause the deformation of 1 and 2 respectively. These stresses are equivalent to the stress found in the bottom of tested samples in a normal oedometer with friction and the top stress equal to FL equations (2.6.7) and (2.6.8). The slope of the frictionless line (M) should be the real oedometric modulus of the material without the friction influences.
b1
FL1
M
1 (2.6.7)
b2
FL2
M
2 (2.6.8)Figure 12: Schematic of samples behaviour (AF
1and AF
2are the stress-strain at the
20
Figure 13 : Modeling of sample behaviour (A
FLis the stress-strain in a frictionless
oedometer)
Equations (2.6.5), (2.6.6), (2.6.7) and (2.6.8) lead to equations (2.6.9) and (2.6.10). The friction force per unit of sidewall ( ) can be calculated by the equation(2.6.9). The oedometric modulus of materials can be calculated by equation(2.6.10). 2 1 2 1 2 2 1 1 2 t t R h h
(2.6.9) 2 1 2 1 2 2 1 1 t t h h M h h
(2.6.10)21
By solving these equations, the stress at the bottom of the samples (
FL1,
FL2), the
amount of frictional stress (
2
h
1R
) and the oedometric modulus (M) Can be defined
as presented in Table 3.
Table 3 : Results of modeling oedometer test
Figure 14 : Results of oedometer tests (solid line) and the result of model in a
frictionless oedometer (dashed line)
With the analytical method, described above, the stress at the bottom of each sample can be calculated. Figure 14 illustrates the result of the analytical method to find the stress at the bottom of samples as like as the result in a frictionless oedometer. The results show a lower vertical stress transferred to the higher sample which results in the lower strain. The results also show clearly that the oedometric modulus obtained from modeling is larger than experimental tests. The calculated oedometric modulus refers only to the one-dimensional behaviour of crushed rock particles without considering the wall frictional forces.
Materials characteristics Tests results Modeling
No. d50 Height Bulk density Max loading Max stress Max strain Max Oedometric modulus Max frictional stress Max vertical stress at bottom H Q FL M
2
h
1R
FLi(mm) (mm) (kg/m3) (kN) (MPa) (%) (MPa) (MPa) (MPa)
1 20-28 197 1401 100 3.075 5.86 30.847 1.269 1.805