WORKING
PAPERS
SES
N. 490
First Version XI.2017, This Version
X.2018
Faculté des sciences économiques et sociales Wirtschafts- und sozialwissenschaftliche Fakultät
Founding family ownership,
stock market returns, and
agency problems
Nicolas Eugster
and
Founding family ownership,
stock market returns, and agency problems
♣Nicolas Eugster
IÉSEG School of Management Rue de la Digue 3 59000 Lille France n.eugster@ieseg.fr Dušan Isakov♦ University of Fribourg Boulevard de Pérolles 90 1700 Fribourg Switzerland dusan.isakov@unifr.ch
First version: July 6, 2016 This version: October 22, 2018
♣ We thank an anonymous referee, Xavier Giroud, Annette Pajuste, Christophe Pérignon, Jean-Philippe Weisskopf and the seminar participants at the Ecole Hôtelière de Lausanne, CIG meetings in Lausanne and Dijon, French Finance Association Annual Meeting in Valence, World Finance and Banking Symposium in Singapore, Australasian Finance and Banking Conference in Sydney and Paris Financial Management Conference for their helpful comments and suggestions. We are responsible for all remaining errors.
1
Founding family ownership,
stock market returns, and agency problems
Abstract
This paper explores the relationship between founding family ownership and stock market returns. Using the entire population of non-financial firms listed on the Swiss stock market for 2003–2013, we find that the stock returns of family firms are significantly higher than those of non-family firms after adjusting the returns for different firm characteristics and risk factors. Family firms generate an annual abnormal return of 2.8% to 7.1%. Moreover, family firms potentially having more agency problems earn higher abnormal returns. Although they are more profitable, family firms have lower valuations and regularly surprise markets by announcing better-than-expected earnings. The evidence suggests that outside investors earn a premium for being exposed to the specific agency problems present in family firms.
JEL Classification: G32; G14
2
Founding family ownership,
stock market returns, and agency problems
1. Introduction
For over a decade, the impact of family ownership and control on the performance of publicly listed companies received extensive attention in the academic literature. This is important, since family firms represent a large fraction of listed firms worldwide (Carney and Child (2013); Faccio and Lang (2002); La Porta et al. (1998)). Most of this literature focuses on performance metrics related to profitability (return-on-assets, ROA) or valuation ratios (Tobin’s Q) (e.g., Anderson and Reeb (2003); Villalonga and Amit (2006)). However, the evidence on the stock market performance of these firms is more limited, although it is of prime importance for the minority shareholders of these firms and investors in general. Our paper fills this gap by proposing a detailed analysis of the stock returns of family-owned firms compared to the rest of the market. Using the entire population of non-financial firms listed on the Swiss market, we find that family ownership has a beneficial impact, and that these firms deliver higher stock market returns than non-family ones. The outperformance of the former ranges between 2.8% and 7.1% per annum, depending on the way risk is adjusted.
The stock returns of family-owned firms might have received little attention so far possibly due to the strong belief in market efficiency. Characteristics such as ownership structure, and particularly the identity of the controlling shareholder, if any, is public information that should be integrated into stock market prices, and there is no reason to believe that choosing stocks based on this information might lead to superior returns. However, recent literature shows that strategies using public information can offer superior returns on the stock market. For instance, Edmans (2011) shows that a strategy based on a publicly disclosed index of employee satisfaction (Forbes 100 best companies to work for) leads to positive abnormal returns. Eisfeldt and Papanikolaou (2013) find that an investment in firms that have more organization capital produces significant risk-adjusted returns. Lilienfeld-Toal and Ruenzi (2014) document that choosing stock of companies with high CEO ownership also leads to significant outperformance. The common explanation here is that the market does not fully value these features, as they are difficult to appraise quantitatively.
The positive impact of family ownership on stock returns could also be related to an improperly assessed effort of family members by market participants, since the concentration
3
of ownership in family hands may both have positive and negative effects on economic efficiency. Family ownership can thus have various implications on the agency problems in a corporation and, hence, on its profitability and perception by market participants. On one hand, family control reduces the conflicts of interest between managers and shareholders (agency problem I), as families tend to seek the long-term sustainability for their companies and, from their dominant position, can closely monitor management and challenge any decision not in their interest. This behavior can be value creating for the company and its shareholders. More generally, families have strong incentives to maximize firm value and take the best possible decisions to maximize their own wealth. On the other hand, the presence of a large shareholder generates conflicts of interest between minority and majority shareholders (agency problem II). The controlling shareholder can use its power to extract private benefits, which reduces company value. For family firms, these problems are not likely to materialize as pure wealth expropriation, since the own wealth of family members would be negatively impacted. However, agency problems may take the form of non-value maximizing decisions, because the family is pursuing objectives that increase its own utility (e.g., firm growth, reputation, or survival) and do not enhance shareholder value. Moreover, these firms can suffer from specific problems, such as family feuds or nepotism, which would also lead to firm value reduction. These two opposing effects of family control vary by company and depend on the different firm characteristics. For instance, and Anderson and Reeb (2003) have documented a nonlinear relationship between firm performance and the family stake. They show there is an incentive effect at lower levels of control, and that performance increases with family holdings. However, this relation changes to an entrenchment effect with negative consequences on performance at higher levels of control.
This paper investigates the stock market performance of Swiss family firms from January 2003 to December 2013 for a sample of 195 companies listed on the SIX Swiss Exchange. The Swiss market represents an ideal laboratory for studying the relationship between family ownership and stock returns for two reasons. First, La Porta et al. (1999) document that, in most markets worldwide, ownership is concentrated, frequently in the hands of families, with investors being relatively poorly protected by law. In this respect, Switzerland is a representative market, as it is characterized by the presence of numerous family firms and low investor protection. Compared to the US, the levels of ownership by the largest blockholders are higher. Anderson and Reeb (2003) document an average holding of 17.88% of the voting rights for families in the US, while Isakov and Weisskopf (2014) report an average stake of 55% for families in Switzerland. In addition to the high control levels, Switzerland
4
ranks relatively poorly in international comparisons of minority shareholder protection according to the studies of La Porta et al. (1998) and Djankov et al. (2008). These Swiss market features facilitate the potential extraction of private benefits by the controlling shareholder. Second, this market has a relatively small number of listed firms. As emphasized in the literature,1 most commercial databases on ownership contain inaccuracies or are unable to identify correctly the ultimate owner of a firm. Therefore, hand collecting data on ownership structures from different sources overcomes this problem and allows documenting accurately the different aspects of ownership. This process is easier to implement with a reasonable number of firms, as is the case of the Swiss market. Another advantage of the limited number of firms is that it allows us to work with the entire population of listed firms. This contrasts with other markets, where the large number of listed firms forces researchers to work on subsamples, exposing the reported results to potential sample selection bias.
The main results of this paper show that (1) family firms have higher stock returns than widely held firms and those with another blockholder; (2) considering a number of different risk factors, family firms outperform non-family firms in terms of risk-adjusted stock market returns; (3) the superior performance of family firms is associated with the level of control of the family; (4) although family firms are more profitable than other firms, their stocks trade at a discount on the market; (5) family firms have larger earnings surprises than other firms; (6) these earnings surprises translate into stronger market reactions to earnings announcements. Overall, our results show that family firms, which have more potential agency problems, have higher abnormal returns than other firms. This suggests that outside investors earn a premium for being exposed to the specific agency problems present in family firms.
This study contributes to the existing literature as follows. First, it adds to the literature on the link between ownership structure and stock market returns by proposing a detailed investigation of the impact of founding family ownership on stock market returns, an aspect that hitherto received limited attention.2 Besides documenting the difference in returns between firms with different types of controlling shareholders, this study attempts to identify the reasons
1 See, for instance, Anderson and Lee (1997), Dlugosz et al. (2006), or Holderness (2009).
2 Only few studies examined the stock market performance of family firms. For example, Corstjens et al. (2006) analyze large firms from the French, UK, German, and US markets, and find positive abnormal returns for family firms on the French market. Cella (2009) considers a sample of large firms from eight European countries, and documents that family firms from these countries earn significant positive abnormal returns. Fahlenbrach (2009) examines the performance of a subsample of family firms—those run by a founder-CEO in the US—finding that these firms generate significantly positive abnormal returns. Miralles-Marcelo et al. (2013) find that, for a sample of Portuguese companies, family firms outperform others. However, this body of literature does not find explanations for the stock market performance of family firms.
5
explaining the outperformance of family firms. We find that abnormal performance is associated with the level of family control, a measure indicating the degree of control contestability and therefore the magnitude of potential agency problems. Our results also show that market participants have concerns about the effects of family presence on firm performance, as the shares of these firms trade at a discount. In this context, the abnormal returns appear to be a reward for bearing the risk associated with family control. Second, this study contributes to the growing finance literature on family firms. To the best of our knowledge, it is one of the first to investigate the stock market returns of such firms and to show that the level of family control matters. Finally, our study contributes to the emerging literature at the intersection of corporate finance and asset pricing, showing the existence of firm features not properly assessed by the market, which generate abnormal returns for investors.
The remainder of this paper is organized as follows: Section 2 exposes the specific agency problems affecting family firms while section 3 describes the Swiss institutional setting. Section 4 presents the data and variables used in the analysis and provides descriptive statistics for the sample. Section 5 documents the stock market performances of family firms as well as their relationship to levels of family control, and checks the robustness of the results, discussing, notably, endogeneity issues. Section 6 provides additional analyses to identify the source of the superior returns of family firms. Section 7 summarizes the major findings and concludes the paper.
2. Founding family ownership and agency problems
The literature has long recognized that the presence of a large controlling shareholder alters the classical agency problem existing between shareholders and managers (agency problem I). Since large shareholders have strong incentives to credibly monitor managers, they are likely to reduce the impact of this type of agency problem and improve the situation for all shareholders. However, the presence of a large shareholder generates another type of conflicts of interests between majority and minority shareholders (agency problem II). A large shareholder has the power to impose his own objectives on the firm’s management and the related decisions might not always be in the best interest of other shareholders. Among the different types of controlling shareholders, families have specific characteristics that can reduce or amplify the impact of agency problems.
Families have a high degree of involvement with the firm that enhances the effective monitoring of management. This obviously reduces agency problem I and may also provide
6
more incentives for employed managers to improve firm performance by raising revenues and/or lowering expenses. Furthermore, families have a long-term perspective on generating value because their goal is to pass the firm to succeeding generations. This has implications for financial decisions of family firms. Casson (1999) claims, for instance, that families will refrain from consuming wealth during their lifetime and therefore will reduce private benefit extraction and agency problem II. In this context, James (1999) suggests that family firms invest more efficiently than other firms. Stein (1988, 1989) shows that firms that have shareholders with a longer investment horizon tend to perform better than firms with a short-term focus. The presence of owners who exercise long-term control over the firm is also associated with the general benefits of stable and long-term management. For instance, outside parties are more likely to deal with the same management and same corporate strategies for an extended period. This, in turn, facilitates a stronger business relationship, allowing trust to build over time. Typically, such improved implicit contracting is less costly than complete explicit contracting (Andres (2008)). Long-term relationships may allow suppliers to offer better terms while sustained relationships with lenders may also allow firms to enjoy a lower cost of debt financing (Anderson et al. (2003)), which will also boost earnings and long-term prospects. Finally, families also enjoy non-financial benefits of control, such as the prestige of running their own company or having a good reputation. These benefits have been shown to be stronger motivators to improve firm performance than financial rewards alone (e.g., Bennedsen et al. (2007)). Although the above-mentioned factors might vary from firm to firm, it appears that families have strong economic incentives to maximize firm performance and their presence should therefore be associated with less of agency problem I than in other firms.
The presence of a family as a large shareholder can also generate conflicts of interest between minority and majority shareholders (agency problem II). A family could use its power to extract private benefits and expropriate outside shareholders, which will reduce company value. However, since the family has a close link to the firm, these problems are not likely to materialize as pure wealth expropriation, which would negatively impact the wealth of family members. Agency problem II can arise in different ways in family firms. They can suffer from very specific problems such as family feuds. When family members are not all involved or interested in the management of the firm, or if they have diverging views, it might lead to disagreements and fights that will have a detrimental impact on firm value. Family organization and structure might therefore have a significant impact on firm value. However, this is usually not apparent to outside investors because these details are not disclosed and publicly available. It is therefore difficult to assess how they impact firm value. Nepotism is another
family-7
specific problem. It means that the family insists that some of the firm’s managers are chosen among family members and not from professional managers outside the family. These managers might not have the necessary skills to run the firm and this could lead to value destruction (e.g., Bennedsen et al. (2007)). A related problem occurs when family members remain active in management although they are no longer competent or qualified to run the company. Shleifer and Vishny (1997) estimate that this problem is the greatest cost associated with the presence of a controlling shareholder. More generally, as discussed by Fama and Jensen (1985), controlling shareholders can obtain greater benefits by pursuing their own objectives rather than shareholder value maximization. In the case of family firms, these objectives can be firm growth, reputation, or survival. Families frequently have the absolute control of their firm by holding a large fraction of voting rights. This implies that different classical corporate governance mechanisms are ineffective, since family power often cannot be challenged. Typically, a family has the last word for all the decisions taken during the annual general meeting. Family firms will also be insulated from the market for corporate control and market pressures in general. Outside investors are therefore exposed to family decisions, whether they are good or bad for firm value.
In summary, the presence of a family as a controlling shareholder can simultaneously reduce or magnify agency problems. It is, however, difficult for outside investors to properly assess the impact of family presence on firm value since family organization, structure, and internal relations are opaque and might change over time.
3. Swiss institutional setting
The Swiss stock market is one of the largest stock markets worldwide. At the end of 2015, it ranked 10th in terms of market capitalization (World Federation of Exchanges (2016)). Despite its size, the number of publicly listed firms is relatively small, as only 250 companies are traded on this market. The ownership structure of Swiss firms is typical for continental Europe as the majority have a concentrated ownership. For instance, Faccio and Lang (2002) report that, in 1995, 28% of companies were widely held, while 48% of firms are family-owned and 24% have a non-family blockholder. Moreover, they report that controlling shareholders essentially employ dual-class shares to increase their control over the company, as these are unrestricted by Swiss law. The authors report that 51% of firms use multiple share classes, while 10% resort to pyramidal structures and none to cross-holdings.
8
In terms of corporate governance characteristics, Switzerland belongs to the German-origin civil law countries according to La Porta et al. (1998), which tend to have poor investor protection. This is illustrated by Switzerland ranking poorly both in terms of anti-director rights index (La Porta et al. (1998)) and the anti-self-dealing index proposed by Djankov et al. (2008). It also has a nearly non-existent but slowly evolving market for corporate control (Lowinski et al. (2004)). These observations indicate that, on this market, controlling shareholders such as families have significant freedom. As such, agency problems between majority and minority shareholders can potentially be more severe, since controlling shareholders can extract private benefits more easily than in other countries. However, improvements in investor protection have been recently observed. In 2002, Switzerland adopted a code of best practices for corporate governance. This led to significant changes in corporate governance practices. An example is the fact that numerous firms abandoned their dual-class share structure since. Finally, in 2013, the Swiss citizens voted a very constraining law to limit abuses on executive compensation.
A recent example3 illustrates how agency problems related to family ownership can materialize for minority shareholders in this setting. Sika AG is a medium-sized company in the chemical specialties sector. The company was founded in 1910 by K. Winkler. He was then joined by his son-in-law, F. Schenker, and both developed the company over the years. The descendants of the two founders, the Schenker-Winkler family, then controlled the firm through the SWH holding company. With the use of dual-class shares, they held 16% of capital and 52% of voting rights. In December 2014, the SWH holding announced its intention to sell its complete stake to the French company Saint-Gobain, as the group of descendants had diverging interests and were not willing to keep the company anymore. The price Saint-Gobain agreed to pay to SWH holding for their shares included a premium of 80% over the current market price. Other minority shareholders could not benefit from this offer and were at risk with this change of control, as there were no guarantees for the future of Sika since Saint-Gobain is its direct competitor in many sectors. Following this announcement, the stock price dropped by more than 20%, directly affecting the wealth of minority shareholders. Sika’s example highlights the potential dangers for the shareholders of family firms in Switzerland, a country where investor protection is relatively weak. However, it must be noted that such events are relatively seldom.
9
4. Data and variables
The empirical analysis is performed on a dataset of 195 companies listed on the SIX Swiss Exchange from January 2003 to December 2013. The final sample contains 19,604 firm-month observations on the entire population of Swiss non-financial listed firms over the analyzed period. Different sources are used to build this database as follows.
Ownership data are collected by hand, and include information on all non-financial companies belonging to the Swiss Performance Index (SPI), that is, detailed information on the ownership structure of the firms.4 Particularly, we have information on the identity of all the large shareholders holding more than 3% of voting rights in every company (if any). When the shareholder is a company, we further search for the ultimate owner as to determine the exact type of shareholder (e.g., the Schenker-Winkler family behind the SWH holding company). We also identify the proportions of voting and cash-flow rights held by each large shareholder. Ownership data are observed on a yearly basis and recorded at the end of each year.
Data are collected from the annual reports of companies, as well as from Swiss stock guides, newspaper articles, firm homepages, or the commercial register when needed. We follow the standard practice in the literature, and when the largest shareholder has a stake of the voting rights larger than the 20% threshold, we consider the firm is controlled by a majority shareholder (Faccio and Lang (2002)). We classify the companies by type of owner as follows: family, widely held and firms controlled by another blockholder. The latter include firms controlled by the state, private investor,5 owned by another widely held corporation, owned by another widely held financial firms, and miscellaneous. For each largest shareholder of a firm, we compute the wedge between voting and cash-flow rights as the ratio between the proportions of voting and cash-flow rights held by this shareholder. In Switzerland, this difference is mainly due to the use of dual-class shares. When a company does not have a shareholder holding more than 20% of the voting rights, we classify it as a widely held firm. For these firms, we also compute the wedge for the largest shareholder even if he holds less than 20% of voting rights.
4 The database of ownership structure for 2003–2010 originates from the work of Isakov and Weisskopf (2014). We have extended their database for 2011–2013 and collected additional information.
5 We follow Andres (2008) and Isakov and Weisskopf (2014), establishing a specific category of controlling shareholder named private investor. A private investor is defined as one or more individuals that have neither founded the company nor shaped it in a substantial way over time. The motivations and values of a private investor strongly differ from those of a founding family. Typically, there are private investors who target making a quick profit and then leaving. Private investors also differ from other non-family blockholders in being more likely to reduce agency problems I (more incentives to control managers), but are more prone to agency problem II (more incentives to extract private benefits). Typically, firms with this type of controlling shareholder are considered family firms in a large proportion of the literature, which might lead to biased results.
10
Market data on the monthly stock returns of each company are obtained from Thomson Reuters’ Datastream. Returns are computed as total returns and include the dividend distribution. Besides returns, we also need a series of variables to quantify the different firm characteristics, as well as the earnings announcements, for the empirical analyses. These are obtained from Thomson Reuters’ Datastream, Worldscope, and FactSet. A detailed description of the different variables and their sources is found in the Appendix.
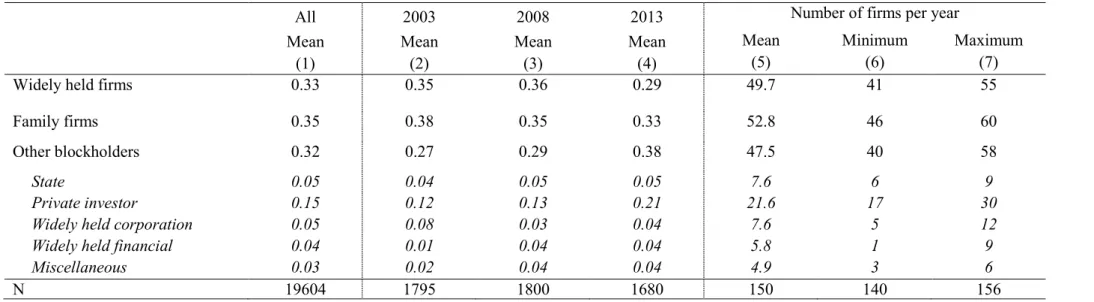
Table 1 presents the sample composition according to different types of controlling shareholders. These statistics are provided for the entire sample period (column 1). We also compute them for the first (column 2), middle (column 3), and last year (column 4) of our sample to document the evolution of ownership over time. We also present the mean, maximum, and minimum number of firms in each category and year.
[Insert Table 1 here]
Our sample appears well balanced regarding firm types. We have three main groups of roughly equal sizes. Each year, we have approximately 50 firms in each category (widely held, family, and firms with another blockholder). Widely held firms represent 33% of the sample. Family firms are the most common type, representing approximately 35% of the sample. Finally, 32% of our sample consists of firms with a controlling shareholder other than the founding family. In this group, 5% of firms are owned by the state, 15% by a private investor, 5% by another widely held corporation, 4% by another widely held financial firm, and 3% are miscellaneous. Proportions remain almost constant between the three decomposed periods. The ownership pattern is stable over time, as there are few changes in the controlling shareholders’ identity or the fraction of voting rights they hold.
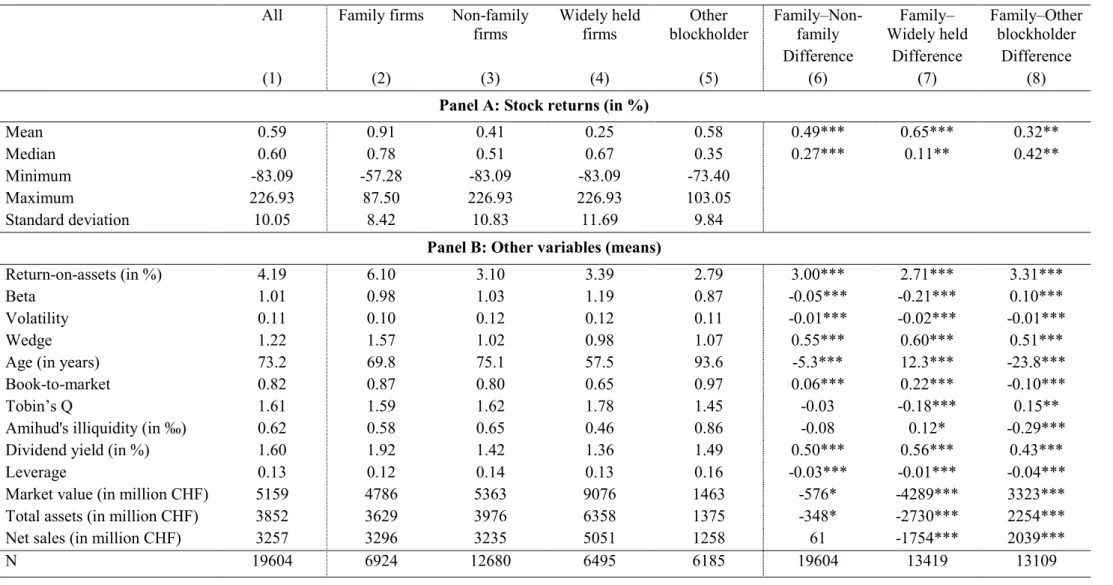
Table 2 presents the descriptive statistics for stock returns and the different variables that are used in the analysis. It contains information on the entire sample (column 1), as well as for the different categories of firms, grouped by the type of controlling shareholder, namely family firms (column 2), non-family firms (column 3), the latter being further subdivided in widely held firms (column 4) and firms held by another blockholder (column 5). Table 2 also presents (i) the means of the different variables used in the analysis and (ii) the results of the tests of difference in means between family firms and other controlling shareholder types. For stock returns, we also provide results and tests on median returns.6
6 Some variables are observed on a monthly frequency while some others only have annual observation (e.g., ownership or accounting variables). We merge the monthly data with the corresponding current yearly data by
11
[Insert Table 2 here]
The average monthly raw stock return for the entire sample is 0.59% per month. Family firms have significantly higher average raw returns (0.91%) than other firm categories. Widely held firms have the lowest average raw return over the analyzed period (0.25%). Qualitatively similar results are obtained for median returns. Moreover, family firms appear to be significantly more profitable than other firms according to their mean ROA (6.10%). In terms of risk, family firms are slightly less risky than other firms in the sample. They also have lower betas (except for the firms with another blockholder that have a slightly lower mean beta of 0.87) and lower volatility. In terms of control-enhancing mechanisms, family firms have an average wedge of 1.57, while this value is close to one for all other categories. This means that the largest shareholder in family firms has, on average, 1.5 more voting than cash-flow rights, while the other groups respect the one-vote-one-share principle. Despite the progressive reduction of dual-class shares structures in Switzerland, family firms still use this technique to reinforce the control they have over the firm. Interestingly, the mean wedge for widely held firms is slightly below one. This is due to some firms having limitations on voting rights and some large shareholders having less voting than cash-flow rights. Concerning the other firm characteristics, family firms and firms held by another blockholder have higher book-to-market ratios and less liquid stocks (higher Amihud’s illiquidity ratio) and are generally smaller than widely held firms (in terms of market value, total assets, or net sales). While firms held by another blockholder are the oldest, widely held firms are, on average, the youngest. We also observe that family firms are more generous with their shareholders, as they pay significantly more dividends than other firms (they have an average payout ratio of 1.92%, while other firms have 1.42%). This is consistent with the findings of Isakov and Weisskopf (2015), who document that family firms have higher payouts in Switzerland. Regarding leverage, family firms have slightly lower levels of leverage, on average, than non-family firms. These results are consistent with the previous literature.7
repeating the values of the annual variables for the 12 monthly observations of the same year. As ownership variables are relatively stable over time and changes are disclosed before the end of the year, we do not use lagged variables.
7 Schmid (2013) shows that leverage is lower for family firms in Germany, which has an institutional and economic environment similar to the Swiss one.
12
5. Stock market returns of founding family firms
This section analyzes the stock market performance of family firms. We use two complementary approaches: firm-characteristics and portfolio-based. We use the former as our primary analysis tool because it allows for a larger number of risk factors/firm characteristics that impact stock returns than the standard portfolio approach, which is based on size, book-to-market, and momentum factors. Moreover, since the portfolio-based approach has some drawbacks in the case of Switzerland, we use it as a secondary test to check if the initial results hold.
5.1 Firm-characteristics approach
Our main tool to study the impact of family ownership on stock performance is a firm-characteristics approach. We follow Lilienfeld-Toal and Ruenzi (2014) and use two methods to estimate the following multivariate regression:
= + + +
it i i it i it it
r a b X cZ e , (1) where rit is the total returns for firm i in month t, Xit the dummy variable indicating the presence
of one type of shareholder in the ownership structure, and Zit a vector of firm characteristics.
The first method is a pooled panel regression (POLS2C), where standard errors are two-dimensionally clustered along the firm and time dimensions. The second method is a Fama-MacBeth (Fama and Fama-MacBeth (1973)) approach (FMB), where cross-sectional regressions are run separately for each month of the sample period, and then the values of the final parameters are determined using the mean and statistical significance of the time-series statistics of these monthly estimates.8 In both cases, we also control for industry effects by including industry dummies in all regressions, based on the Industry Classification Benchmark (ICB) 10 industry classification. Following Brennan et al. (1998), Gompers et al. (2003), and Lilienfeld-Toal and Ruenzi (2014), our set of control variables includes the logs of book-to-market and of market value as proxies for the size and value effect, respectively. We also use the price of stocks and volatility of returns, as well as three variables for returns 3–2, 6–4, and 12–7 months before the month of analysis as proxies for the momentum factor. As suggested by Edmans (2011), we further control for stock liquidity by using the Amihud’s illiquidity ratio (Amihud (2002)). We also consider the dividend yield and leverage and, as proxies for firm’s efficiency, the operating
8 Two-dimensional clustering provides asymptotically unbiased standard errors, while the FMB estimates of standard errors can be biased in the presence of firm fixed effects. It is therefore recommended to use the two methods, since we cannot rule out the presence of firm fixed effects in our regressions.
13
margin and sales over total assets. Finally, we use asset and sales growth over the past year and over the past five years. All variables are detailed in the Appendix.
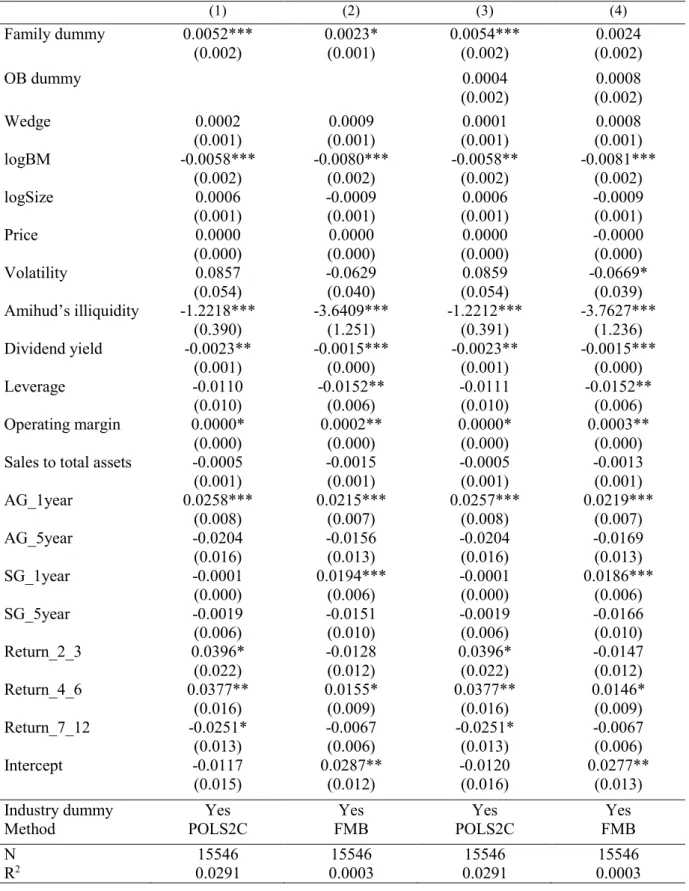
The results of the multivariate regressions with firm characteristics are shown in Table 3. Among the different control variables, we observe that some characteristics that are not included in traditional empirical asset pricing models are significantly related to individual stock returns. These variables are Amihud’s illiquidity ratio, dividend yield, leverage, operating margin, sales, and asset growth. This indicates that the firm-characteristics approach is relevant to analyzing stocks in Switzerland. We first estimate in columns (1) and (2) the model by using a family dummy which means that the control group is made of all non-family firms. The main results are the significant coefficients obtained in both approaches for the family dummy. These results reflect that family firms earn significantly higher returns compared to other firms in our sample, and that these differences cannot be explained by differences in firm characteristics.
[Insert Table 3 here]
Firms with a family holding at least 20% of the voting rights earn a significant additional monthly return of 0.52% (6.42% annually) compared to firms with no family holding in the POLS2C regression. The coefficients differ slightly between the regression approaches, but both are statistically significant. In a second stage, we also include another blockholder dummy to check if firms with another blockholder as controlling shareholder behave differently from widely held firms and should be considered separately in the analysis (columns (3) and (4)). We observe that the additional dummy is not significant and that other “blockholders” firms can be included in the control group with widely held firms. We also perform an F-test of equality of the coefficient between the family and other blockholders dummies for the POLS2C approach and reject the null. All these results also confirm the univariate results of Table 2 (i.e., family firms have the highest returns).
5.2 Portfolio-based approach
We also use the portfolio-based approach to analyze the impact of family ownership on stock returns. We follow the methodology of Gompers et al. (2003), which is based on grouping stocks with similar characteristics in portfolios. At the beginning of each year, we build equally
14
weighted portfolios,9 containing the stocks of all firms with the same type of controlling shareholder (family and non-family firms). Portfolio returns are subsequently calculated at the end of each month over the entire year. At the beginning of the next year, portfolios are reformed and returns calculated again. We then create a self-financing strategy that is long on the portfolio of family firms and short on the portfolio of non-family firms.
We then use a multi-factor model to analyze the performance of the different portfolios. Specifically, we use the four-factor model of Carhart (1997), which is an extension of the classical Fama-French three-factor model (Fama and French (1992, 1993)), with an additional factor reflecting the momentum effect of Jegadeesh and Titman (1993). We estimate the model as: 1 2 3 4 α β β β β = + + + + + pt p p t p t p t p t pt R RMRF SMB HML WML e , (2)
where Rpt is the return of portfolio p minus the risk-free rate in month t, RMRFt the expected
market return minus the risk-free rate in month t, SMBt the difference between the expected
return in month t of a portfolio of small-cap stocks and that of a portfolio of large cap stocks,
HMLt the difference between the expected return in month t of a portfolio of stocks with high
book-to-market and that of a portfolio of stocks with low book-to-market, and WMLt the
difference between the expected return in month t of a portfolio with stocks having outperformed the previous month and that of a portfolio with stocks having underperformed the previous month. Alpha measures the abnormal return an investor would have obtained monthly from 2003 to 2013. This model necessitates monthly estimates of the four relevant factors, as well as the risk-free rate for Switzerland. We use local factors, as Griffin (2002) concludes that domestic factors explain better time-series variations in returns than world factor models and generally have smaller pricing errors than their international counterparts. The returns of these factors have been computed by Ammann and Steiner (2008) for 1990–2014.10 However, evidence on the validity of the four-factor model for the Swiss stock market is weak (e.g., Fama and French (1998) and Ammann and Steiner (2008)). Moreover, the reliability of these factors is not guaranteed, as the number of stocks available for their construction is limited. We therefore also use a simple one-factor model as an alternative to measuring abnormal returns.
9 The use of equally weighted portfolios is more appropriate for the Swiss market, since some firms are very large and represent an important fraction of total market capitalization. The use of value-weighted portfolios is less informative, since these portfolios would essentially reflect the returns of these few large firms.
10 These factors are available on Amman’s website (www.manuel-ammann.com). We thank the authors for making these factors available to other researchers.
15
The results of the analysis are presented in Table 4. The first two columns report abnormal returns and the risk coefficients for the portfolios representing the two types of firms, while the last column report the coefficient of the self-financing strategy long in family firms and short in non-family firms.
[Insert Table 4 here]
Panel A shows the results for the four-factor model. The abnormal returns of the portfolio of family firms is positive and insignificant, while the abnormal returns of non-family firms is negative and insignificant. The returns on the self-financing strategy long on family firms and short on non-family firms yield significant and positive alphas of 0.25% (3.04% per annum). However, the results must be interpreted with caution, as explained above. We therefore use a single-factor model as well, whose results are shown in Panel B. We find the alphas of both long-only strategies are higher than in the four-factor model. This time, the portfolio of family firms displays a positive and significant alpha of 0.57% per month (7.05% per annum), while the portfolios of non-family firms is positive and insignificant. Regarding the self-financed strategy, it yields an insignificant abnormal return of 0.34% per month (2.30% per annum). As robustness check, we repeat the analysis with value-weighted portfolios to verify if the results are not driven by smaller firms, and find qualitatively similar results.11 Generally, this complementary analysis shows that an investment in a portfolio of family firms yields higher risk-adjusted returns than non-family firms. The results appear to be qualitatively similar but slightly weaker than those obtained in the firm-characteristics approach. This might be explained by the fact that some individual returns are diluted in the portfolio approach. 5.3 Longevity of outperformance
The results in Tables 3 and 4 might be due to market mispricing for the effect of family ownership. However, since ownership is stable over time, an efficient market should correct its error and abnormal returns should decline over time, as the market learns the true value of these firms. We therefore study the longevity of outperformance. We follow Edmans (2011) and assess it with a long-term event study approach, computing cumulative abnormal returns (CARs). The “event” is the end-of-year disclosure of firm ownership structure. Each year, we calculate for each firm and each month an abnormal monthly return by subtracting the market
16
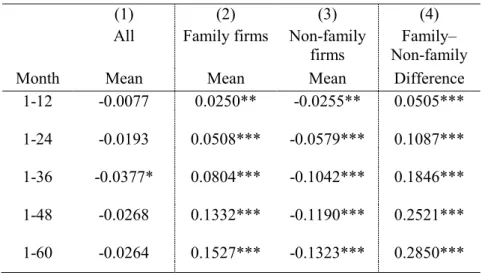
return from the raw stock return. Starting in January, we cumulate these benchmark-adjusted returns over horizons of x months (12, 24, 36, 48, or 60). We then create equally-weighted portfolios, containing stocks of firms with similar ownership. Table 5 presents the average CARs over different horizons for different portfolios, obtained by computing the portfolio average returns over different years in the sample. Table 5 shows the results for the portfolio constructed from the entire sample of firms, as well as subsamples of firms with similar types of controlling shareholders, and also the differences in mean returns between portfolios.
[Insert Table 5 here]
These results first show that the CARs for the entire population of non-financial Swiss firms are mostly not statistically different from zero for the five horizons in column (1). However, when distinguishing between family and non-family firms, we observe an important difference as, for each period, the CARs for the groups of family firms are positive and statistically different from zero, whereas those of non-family firms are negative and statistically different from zero. Second, the differences in means tests confirm the outperformance of family firms over time compared to non-family. Finally, CARs are continuously growing for all groups (positively for the family firms and negatively for non-family firms), suggesting the market is not eliminating mispricing over the long term. We thus conclude there is persistence in the outperformance of family firms and that mispricing is never fully corrected. This could be due to the presence of a premium for holding stocks of family firms.
5.4 Level of family control and stock returns
In this section, we investigate if there is a relationship between the level of family control, measured by the proportion of voting rights held by the family, and stock returns. However, as pointed out by Gompers et al. (2010), the analysis of the effect of the level of control is challenging as one variable is used to identify two separate forces: incentive and entrenchment. The impact of this variable can be interpreted in two opposite ways. A high stake in the firm by a large shareholder may be an indication of the possible presence of agency problems II that could be detrimental for small shareholders. On the other side a high stake held by the family might be a sign that family members will not undertake value-destroying actions since this would harm their own interests and wealth. In this case the higher stake would reflect an incentive effect that is beneficial to all shareholders. The literature has investigated the relationship between firm performance and the stake of the largest shareholder: Morck et al.
17
(1988), McConnell and Servaes (1990), Anderson and Reeb (2003), and Isakov and Weisskopf (2014) find a nonlinear (concave) relationship between ownership and accounting performance. They also find that performance first increases as family ownership increases (incentive effect) but, after a certain level of ownership, performance decreases (entrenchment effect). The explanation for this concave relationship is that agency problems (risk of expropriation of minority shareholders by the controlling shareholder) become high when the controlling shareholder has a high stake. This phenomenon has been documented for profitability and valuation ratios, but not for stock returns.
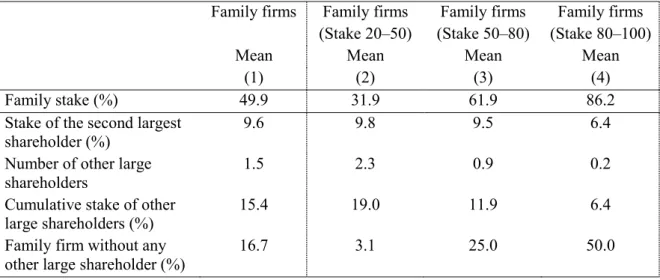
To investigate the relationship between returns and control levels, we first compute the different descriptive statistics of family firms by distinguishing three sub-groups according to the level of voting rights a family has in the firm. The first group contains firms where families have 20–50% voting rights, a moderate level of control that does not allow full control over the firm. If a family holds more than 50% of voting rights, it has the absolute majority, thus making most standard corporate governance mechanisms (e.g., annual meeting votes or takeover threat) ineffective. We split the firms with family stakes above 50% into two groups to determine whether firms with very high levels of control have a different impact on returns: 50–80% and 80–100% of voting rights.12 Pagano and Röell (1998) and La Porta et al. (1999) discuss the importance of having other large shareholders in a firm with a large controlling shareholder. They claim that these other large shareholders have the resources and incentives to monitor the largest shareholder, and that they can challenge the controlling shareholder and moderate the level of agency problem II even though the largest shareholder has more than 50% of voting rights. We therefore first investigate the presence of other large shareholders in family firms in Table 6. We consider the full ownership structure of family firms and report all other large shareholders that have at least 3% of voting rights.
[Insert Table 6 here]
We observe that families hold on average 49.9% of the voting rights and that the second largest shareholder has 9.6% of the voting rights. There are on average 1.48 other shareholders owning more than 3% of the voting rights per firm besides the family, and together these hold 15.4% of the voting rights. In 16.7% of cases, the families face atomistic shareholders, as there
12 Note that high levels of control do not automatically imply low stock liquidity, since these firms frequently use control enhancing mechanisms and families might have much lower cash-flow than voting rights.
18
is no shareholder with more than 3% of voting rights. Table 6 shows that the number and size of large shareholders is inversely related to the family control levels and that the number of firms without any other large shareholders is positively related to the stake of the family. We observe that there are more large shareholders with larger stakes in the range of 50-80% than in firms where the family has a stake of 80-100%. Those large shareholders may monitor the actions of the family and eventually challenge them, therefore potentially reducing the impact of agency problems in those firms although the family has total control of the firm. Since the family is almost always the only large shareholder of the firm when the family holds 80-100% of the voting rights, it is important to distinguish firms with a stake of 50-80% from those with a stake of 80-100%. In the latter case, families have virtually no counterpower and there is more room for agency problems to materialize.
[Insert Table 7 here]
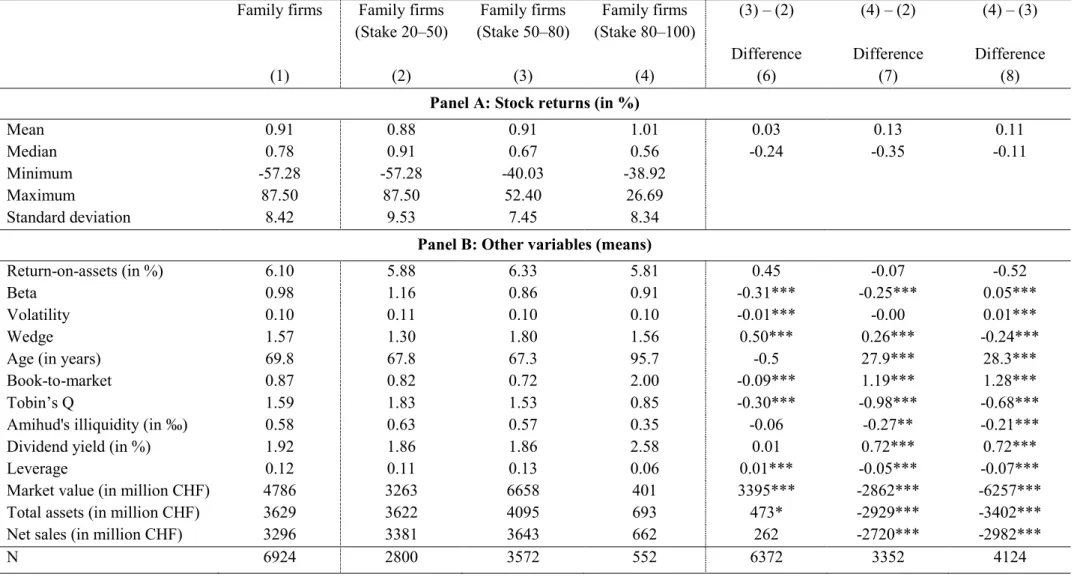
In Table 7, we provide descriptive statistics of the variables used in the analysis according to the different levels of family involvement. We first observe that the mean returns increase monotonically with the stake of the family. For families having a stake between 80 and 100%, the mean monthly return is 1.01%, while for those holding a stake of 20–50%, it is 0.88%. The median returns show a different picture since they decrease with the stake held by the family. However, as the differences between mean and median returns are not significant, there does not seem to be a relation between the stake of the family and returns at this stage. Table 7 shows important differences between the different groups of family firms. The group of firms with high family control tends to include older and smaller firms, and firms with higher liquidity, lower leverage, and higher book-to-market ratios. To further investigate if there is a difference in the returns of firms with different levels of family control, it is important to take into account the differences documented in Panel B of Table 7. We therefore investigate the relationship between family stakes and returns by estimating firm-characteristics regressions (equation (1)). The results are presented in Table 8.13
[Insert Table 8 here]
13 To save space, we do not present the control variables coefficients for the results of firm-characteristics regressions. These are available upon request.
19
We first regress the returns on the percentage of control rights of the family, and obtain a positive and significant coefficient that indicates a strong monotonic positive relationship between stock returns and the family stake. In column (3) and (4), we next analyze the role of other blockholders by adding the percentage of control rights held by other blockholders in order to check if other blockholder should be distinguished from widely held firms when considering the level of control. The results are similar to those obtained in Table 3 as we report insignificant coefficients for other blockholders. We also reject the null of equality between coefficients between family firms and firms controlled by another blockholder. We can therefore safely consider non-family firms as a homogeneous group. Since the literature shows a concave relationship between performance and control levels, we add the squared stake to the equation. The results are reported in columns (5) and (6) and we obtain insignificant coefficients for the squared term, which means that the relation is linear and not concave and that there is no negative impact of high level of control on returns. This is confirmed by the fourth group of results in columns (7) and (8), where we split the family dummy variable in three, according to the level of family ownership. We find the dummy is not significant for the 20–50% stake, but it is for the two other stake ranges. Moreover, the coefficients are the largest for the group of firms with high family stakes. The outperformance of this type of firms is 0.91% per month (or 11.48% per annum) for the pooled regression results. This means that, among the group of family firms, those with high family control earn the highest returns. This contrasts the results in the literature on valuation and profitability ratios, where performance decreases at high levels of control. This can be interpreted as a reward for holding stocks with a high level of family control. Since these high control levels imply the inefficiency of most standard shareholder protection mechanisms and the absence of other large shareholders, it is likely that agency problems are more likely to materialize in these firms and that investors want to be compensated for this risk.
5.5 Robustness tests
5.5.1. Endogeneity problems
The empirical results obtained in the previous section potentially suffer from two important problems: reverse causality and omitted variable bias. We discuss and try to assess the impact of these problems on our results in this section.
In the current analysis, we assume that family ownership causes higher stock market returns. It could, however, be argued that the causality is reversed and that families will tend to only keep control of firms that will produce higher stock returns in the future. This reverse
20
causality argument is based on the fact that families have a large fraction of their wealth invested in the firm and that they frequently have access to the executive management (sometimes family members belong to the executive management). For this reason, families have an information advantage over other shareholders. They might therefore be able to assess the future evolution of the firm’s performance with a certain confidence and would therefore only keep control of firms with good prospects (and higher returns) and sell (or reduce their holdings in) the stocks of firms with negative outlooks. While it might be true that families have some superior information about the firm’s future performance, different observations from our sample as well as several results obtained in the previous literature are inconsistent with the argument that stock market returns cause family control or the level of family holdings. In our sample, we observe very few changes in the holdings of families over the whole period. We have computed 514 year-to-year differences in family stakes and find 250 cases with no changes, while the mean (median) variation is -0.3% (0.0%) per year. Moreover, only nine firms switched from a founding family status to another type of ownership structure over our sample period. Seven firms became controlled by another type of large shareholder, which indicates that this new shareholder had positive expectations about the firm's future. The remaining firms became widely held firms because the family wanted to diversify its wealth but nevertheless remained invested in the firm. If family firms were adapting their holdings to future stock returns, we should observe more variation in family stakes and more firms switching their ownership structure, since our sample period is characterized by all kinds of market conditions and notably a sharp stock market decline of more than 45% over the period of the financial crisis in 2007-2009. Moreover, if family holdings are sensitive to variations in future stock returns, it is difficult to explain why the average age of family firms in our sample is 69.8 years. Over such a long period of time, there were certainly many periods of market downturns that should have induced families to leave the firm if the reverse causality argument were correct. This absence of apparent relationship between changes in family ownership and stock returns in our sample can be explained by different factors. First, the informational advantage of families is likely to be present for future firm profitability but not for stock returns (or abnormal returns). This is due to the fact that stock returns are more difficult to predict because they are not under the control of firm’s management and they are the outcome of stock market participants’ actions and expectations. Second, even if families were able to predict future stock returns, it is not certain that they would change their holdings with respect to this parameter, since their primary goal is not to maximize stock returns but to preserve the firm over the long-term and pass it to the next generation (see, for instance, Bertrand and Schoar (2006)).
21
Moreover, since families frequently use dual-class shares to control firms, they have less cash-flow rights than voting rights and are therefore less concerned by the evolution of the firm’s stock price. Third, the main reasons for families to exit the firm are related to family structure and not to the evolution of stock prices. Bennedsen and Fan (2014), for instance, claim that the most common reasons for exit by the family are the growth of the family and the increasing ratio of uninvolved to involved family members.
Some authors have also addressed the issue of reverse causality by using an instrumental variable technique to correct for the potential endogeneity bias. Anderson and Reeb (2003) have used this approach in their study of the relationship between family ownership and profitability/firm value. They find that endogeneity is not an issue, as their estimates with the instrumental variables approach are qualitatively similar to their original results. The same conclusion is reached by Fahlenbrach (2009) in his study of the impact on firm value and stock returns of having a founder-CEO. Although an instrumental variable approach is theoretically the best remedy against an endogeneity bias, it is also well-known that finding a good instrument is very difficult and that the use of a weak instrument is likely to bias the instrumental variable towards the OLS estimate (Angrist and Krueger (2001)). Since the literature has not identified a good instrument for family ownership so far, this approach cannot completely remove concerns about endogeneity.14 We nevertheless think that our series of
factual arguments combined with the results of the previous literature using instrumental variables are sufficient to rule out the fact that reverse causality is a concern for our analysis.
In addition to reverse causality, our results could suffer from an omitted variable bias as the relationship between stock returns and family firms could possibly be driven by other firm characteristics that have not been included in the model. However, since our main results are obtained from a firm-characteristics approach that includes a broad array of control variables, it reduces concerns that they are driven by an omitted variable bias (see Gompers et al. (2003) for a discussion). Nevertheless, since the observations of our sample are not the outcome of an experiment with a random assignment of firms, our results could be due to some unobservable factor. We therefore complement our analysis by re-estimating our model on different samples of matched firms to eliminate the impact of unobserved variables. We follow Anderson et al. (2017) and construct two matched samples using coarsened exact matching (CEM) (Iacus et al.
14 We have nevertheless estimated the model by using two different instruments previously used in the literature (see Jiraporn et al. (2014) and Eugster (2018)): (i) the level of the family stake the first year it appears in the sample and (ii) the industry level of family ownership. The coefficient of the instrumented family stake is positive and significant (in unreported results available from the authors upon request). This gives some more support to the argument of absence of reverse causality although the validity of these instruments can be challenged.
22
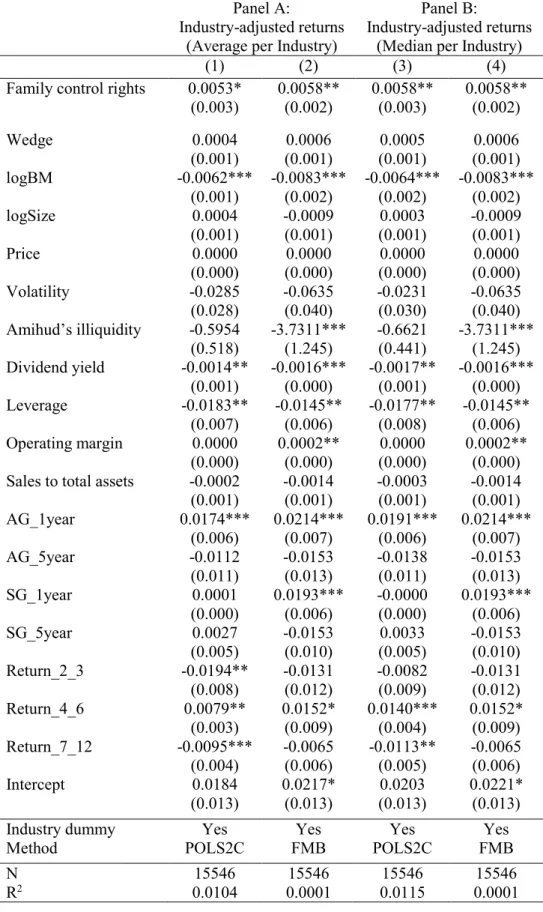
(2009)). We match family firms to non-family firms using the following criteria: the exact 1-digit ICB industry code, total assets, and firm age. The first sample allows the use of different numbers of treated and control firms in order to maximize information (m-to-n match). This technique computes weights that are used in the subsequent regressions. The second matching technique imposes the use of the same number of treated and control firms by randomly dropping observations (k-to-k match). The results are presented in Table 9. We observe that the coefficient of the family control rights variable is positive and significant in all regressions, which removes some additional concerns about a potential omitted variable bias.
[Insert Table 9 here]
Overall, the above results and discussions show that we can be reasonably confident in the causal interpretation of the impact of family ownership on stock returns.
5.5.2. Adjusting stock returns for industry effects
The literature on family firms has documented that these firms tend to congregate into specific industries and that this could have an impact on our results. Although our results include an industry dummy variable to account for this phenomenon, we repeat the analysis by adjusting for the return of the industry.
[Insert Table 10 here]
We re-estimate equation (1) by subtracting the returns to industry from raw stock returns. Industry returns are either computed as the mean returns of stocks belonging to the same industry (Panel A) or the median returns of the stocks from the same industry (Panel B). Firms are allocated to industries according to their 1-digit ICB codes. The results of industry-adjusted returns are unchanged as the family control rights variable is positive and significant in both types of industry adjustment.
5.5.3. Sample composition issues
As our sample contains a variable number of firms each year, our results might be affected by the fact that some poorly performing firms leave the sample because of merger or bankruptcy and that some well-performing firms enter the sample. If this happens, our results could display artificially positive results for family firms. We investigate this issue by
23
estimating equation (1) on a sample of firms that were continually listed since 2003 (the starting date of our sample).
[Insert Table 11 here]
The results are presented in Table 11. We observe that the results remain qualitatively similar and stronger than in our initial case. We can conclude that the performance bias is not driving our results.
6. Source of superior returns for family firms
Our results show that family firms generate positive abnormal returns and that these abnormal returns are larger for family firms with a high level of control. A longevity analysis concludes that these returns persist over time, which indicates that this result cannot be considered as an anomaly as it does not disappear over time once market participants have observed these high returns. These results are more in line with the idea that investors earn a premium for holding stock of family firms, but they raise the question of the origin of the premium. One explanation could lie in the fact that families have strong incentives to maximize firm performance beyond market expectations and that this outperformance is rewarded by the market. This kind of explanation has been recently put forward in the literature relating firm ownership to stock returns. Lilienfeld-Toal and Ruenzi (2014) find positive abnormal returns for firms with high managerial ownership while Fahlenbrach (2009) documents positive abnormal returns for founder-CEO firms. Both studies infer that these positive returns can be explained by the fact that managers with high ownership or founder-CEO have very strong incentives to deliver abnormal performance, which in turn produces higher stock returns. In order to investigate whether this explanation also holds in our case, we first analyze the impact of family ownership on the operational performance of the firm. In a second stage, we investigate how market participants assess the future performance of those firms and how investors react to their earnings announcement.
6.1 Profitability and valuation of family firms
In order to address explicitly the question of the impact of the presence of family firms on performance, we examine two standard performance measures: ROA and Tobin’s Q. We estimate a regression similar to equation (2) but we replace the dependent variable by a
24
performance measure (either ROA or Tobin’s Q) and use annual instead of monthly data. The set of control variables we use is similar to Isakov and Weisskopf (2014) and includes the wedge, firm size, firm age, leverage, sales growth, beta, and investment intensity. The results are presented in Table 12.
[Insert Table 12 here]
Columns (1)-(3) display regression results with profitability as a dependent variable (ROA). We observe that family firms are significantly more profitable than other firms and that this profitability is related to the level of family control. Profitability is the highest for firms with a family stake between 80% and 100%. This result confirms that family firms with economic control have high incentives to perform well and they are able to do it by producing high profitability. This tends to lend credence to the explanation that family control has positive effects on firm profitability. In columns (4)-(6), we examine the relationship to firm valuation (Tobin’s Q). This measure includes the market perception of the future evolution of the firm. Here we observe that family ownership is negatively related to valuation. More specifically we observe that valuation level is negatively related to the level of family control and particularly at high levels of control. In unreported regressions, we have also estimated the same relationship but assumed a quadratic relation between performance and family ownership. We find that the quadratic term is insignificant and that the relationship can be considered as linear. At first sight, these results seem to be inconsistent since a higher profitability should translate into higher valuation. However, when interpreting these results, it should be remembered that ROA is a backward-looking (historical) measure while Tobin’s Q is a forward-looking measure. These results mean that the market values family firms less despite their higher profitability. In order to reconcile the results of these two performance measures, we run another series of regressions with Tobin’s Q as a dependent variable and include ROA as a control variable. The results are presented in columns (7)-(9). ROA has a positive and significant coefficient, which indicates that higher profitability translates into a higher valuation as expected. However, family firms have a significant discount that is related to their level of control. This means that the superior performance of family firms is reflected into valuation (as for any other firms) but, at the same time, that the market discounts family ownership. Moreover, as this discount is positively associated with the family stake, it means that the market is less confident about the prospects of firms with higher levels of family control. Since these firms have less room for
25
other large shareholders to monitor family actions, we infer that this discount is related to the increased probability of having agency problems materializing in those firms.
6.2 Analysts’ surprises, earnings announcements, and abnormal returns
Since the market discounts the value of family firms despite their strong performance, a possible explanation for their stock market outperformance over our sample period could be that investors are overly pessimistic and overestimate the magnitude of agency problems in those firms. This could in turn lead to positive surprises when firms disclose their economic performance, which could then generate abnormal returns as investors readjust their expectations. To shed light on this explanation, we analyze whether market participants are surprised by the disclosure of the economic performance of family firms, and, in particular, at the time they announce their annual earnings. We also analyze how stock prices react around this specific date and if the surprises and market reactions are related to the level of family control to see if agency problems are part of the explanation
As suggested by Core et al. (2006) and Giroud and Mueller (2011), one way to verify if market participants are surprised is to use analysts’ forecasts of earnings per share (EPS) as a proxy for market expectations and compare them with the actual published EPS. Another more direct way to determine how investors integrate information into prices is to look at market reactions around earnings announcements. Here, we consider both measures and differentiate the surprises and market reactions observed around earnings announcements for family and non-family firms, as well as for firms with different levels of family control.
To measure analysts’ forecasts of earnings, we use the mean consensus EPS estimated nine months before the release date of annual results. This ensures analysts know the earnings from the previous year when making their forecasts. The published EPS is used as the true EPS. The estimates are obtained from FactSet. This one-year surprise is standard in the literature and has been used by Giroud and Mueller (2011), Edmans (2011), Lilienfeld-Toal and Ruenzi (2014), among others. We define earnings surprises in relative terms and normalize the difference between realized and expected EPS by the share price at the time of the forecast. For a particular firm i and year t, the surprise is:
Published EPS Consensus EPS Surprise Share Price − = it it it it . (3)
26
The market reaction around annual earnings announcements is measured by the cumulative abnormal return (CAR) for a specific firm and year, computed from an event study over the window [-1; +1]. We estimate normal returns with the market model and use the SPI as the market portfolio. The parameters of the market model are estimated for a window of 200 days, 20 days before the announcement date. Table 13 provides the mean values for the earnings surprises and market reactions for the entire market, family firms and non-family firms. We also compute the ratio of positive to negative earnings surprises and CARs.
[Insert Table 13 here]
Table 13 shows that, for the entire market, the earnings surprise is negative, which means that, nine-months ahead, the consensus is above the true EPS and the market is overly optimistic regarding future earnings. This is consistent with the literature (see Hovakimian and Saenyasiri (2014) for recent international evidence on the earnings forecasts bias). A comparison between the mean surprise of family firms and of non-family firms shows that the market is more positively surprised by family firms, with an average surprise of -1.31% for family firms and -2.34% for other firms. This is also confirmed by the results of the tests of differences in means between family firms earnings surprises and those of other firms, all being positive and significant. This means that, on average, analysts are less optimistic for family firms. For the number of positive and negative surprises for different firms, family firms have a larger proportion of positive surprises (0.76) than other firms (0.67). This also means that, despite analysts’ tendencies to produce forecasts on average above the realized EPS, realized EPS are above the forecasts more frequently for family firms than for other firms. These two results indicate the disclosures of annual earnings by family firms surprise the market more positively than for other firms. Regarding the way investors react to earnings announcements, we find a significant average CAR of 1.16% for family firms, while an insignificant 0.08% is obtained for non-family firms. These average CARs are significantly different from each other and indicate a strong positive price reaction after family firms announce their earnings. As for earnings surprises, the relative frequency of positive CARs is higher for family firms. However, the differences in surprises and market reactions might be due to different confounding factors. We thus use the approaches of Core et al. (2006) and Giroud and Mueller (2011) and estimate the following regression:
= + + +
it i i it i it it