Somnologie 2 2008
Mark Brink Peter Lercher
Alexander Eisenmann Christoph Schierz
Influence of slope of rise and event order of
aircraft noise events on high resolution
actimetry parameters
Einfluss der Pegelflankensteigung und der Ereignis-Reihenfolge von Fluglärmereignissen auf aktimet-rische Parameter
왘 Zusammenfassung Starts und
Landungen in der Nacht sind bei den meisten Verkehrsflughäfen durch eine Nachtflugsperre einge-schränkt. Die Empfindlichkeit der Bevölkerung, durch Fluglärm im Schlaf gestört zu werden, ist daher zu Randzeiten, also abends und morgens, besonders gross. In einer experimentellen Feldstudie bei An-wohnern in der Umgebung des Flughafens Zürich untersuchten wir die Wirkung von Fluglärmere-ignissen auf Körperreaktionen vor dem Aufwachen am Morgen. Dabei
wurden in den Schlafzimmern der Versuchspersonen zuvor auf-gezeichnete Fluglärm-Geräusche abgespielt. Mit einem nichtinva-siven Aufzeichnungsverfahren für schlafphysiologische Parameter (Hochauflösende Aktimetrie-, Herz- und Atemparameter) wurden Körperbewegungen ereigniskorre-liert registriert. Die Resultate erga-ben, dass vor allem die ersten paar Lärmereignisse am frühen Morgen die stärksten Reaktionen evozi-erten und diese mit zunehmender Anzahl erlebter Lärmereignisse ab-nehmen, was vermuten lässt, dass die zuvor erlebte Anzahl Überflüge eine systematische Wirkung hat, insbesondere wenn die Ereignisse innerhalb kurzer Zeitintervalle auftreten. Es zeigte sich auch, dass die Motilität von der Anstiegsge-schwindigkeit des Schallpegels ab-hängt, steilere Anstiegsflanken – wie sie typischerweise direkt unterhalb von Landeanflug-schneisen auftreten – erzeugen stärkere Bewegungsreaktionen. Dies ist im Einklang mit einer neueren Untersuchung über den Zusammenhang zwischen nächtli-chem Flug- und Eisenbahnlärm und Aufwachwahrscheinlichkeit.
왘 Schlüsselwörter Fluglärm –
Aktimetrie – Aktigraphie – Aufwachreaktionen
왘 Summary Takeoffs and landings
during the night are restricted in some form at most airports.
There-fore, commonly, evenings and mornings are especially prone for sleep disturbances through aircraft noise. We conducted an experimen-tal field study at residents’ homes in the vicinity of Zurich Airport that aimed at quantifying the ef-fects of aircraft noise events on bodily reactions before wakeup in the morning. Aircraft noise was ad-ministered using pre-recorded noise events and played back in the subjects’ bedrooms. A non-intru-sive and event-related recording system for sleep physiology param-eters (high resolution actimetry, cardiac and respiratory parame-ters) was developed and used to measure bodily reactions to noise events. Results show that motility reactions to the first aircraft noise events in the morning were stron-ger than to subsequent ones, sug-gesting that the number of previ-ously experienced overflights has a systematic effect, especially if the events occur in short intervals. Mo-tility reactions have also been found to be dependent on the slope of rise of events, with steeper rises – as they are typical for close fly-overs from landing aircraft – evok-ing stronger reactions. These find-ings are in accordance with recent laboratory investigations of aircraft and railway noise impact on awak-ening probability.
왘 Key words aircraft noise –
actimetry – actigraphy – awakening reactions
Received: 5 November 2007 Accepted: 8 May 2008 Published online: 3 June 2008
M. Brink · Ch. Schierz
MTEC-ZOA Public and Organizational Health
Ergonomics & Environment group ETH Zürich
Zürich, Switzerland P. Lercher · A. Eisenmann
Dept. of Hygiene, Microbiology and Social Medicine
Medical University Innsbruck Innsbruck, Austria M. Brink (
✉
) ETH Zürich LEO B9.1 8092 Zürich, Switzerland Tel.: +41-44/632-3971 Fax: +41-44/632-1318 E-Mail: brink@ethz.ch 118_128_Brink_Somno_345.indd 118Somnologie 2 2008
Introduction
Annoyance reactions to traffic noise are, to a large ex-tent, caused by noise-induced sleep disturbances. Among the different traffic noise sources, aircraft noise poses a specific problem to noise abatement since it can barely be deterred by acoustic barriers. Thus the primary goal is to lower noise emissions of single aircraft as far as possible. Furthermore, a reduction of unwanted effects of aircraft noise could be attained by carefully optimiz-ing the local and timely distribution of airplanes that arrive or depart at a particular airport. This necessitates the knowledge of how and when aircraft noise events act on the sleep of residents. Since at the majority of air-ports, some form of night-time flight curfew is in force, aircraft noise events predominantly affect sleep at the beginning or end of the night. Furthermore, as a conse-quence of the coordination of flight schedules at major hub airports, aircraft noise events mostly occur in bursts, that means, they are often “grouped” within particular time windows. This particular pattern of short intervals between single flights and larger pauses between group-ings of flights is often not taken into account in studies of aircraft noise effects. It is therefore important to look at the effects of aircraft noise events within shorter time periods, particularly during the morning shoulder hours after “noiseless” nights.
To elucidate the impact of aircraft noise events dur-ing shoulder hours on sleep, we conducted an experi-mental study in the bedrooms of residents in the greater area around Zurich Airport that encompassed objective as well as subjective measures of sleep. As has been re-ported earlier [9], in Zurich more people are still in bed when the curfew ends (at 06:00 h) than are already in bed, when the curfew begins (23:00 h). Morning noise events thus seem to have a larger potential to disturb sleep and in this article we will therefore focus on the (physiological) effects of aircraft noise events during the last 90 minutes of sleep.
Noise induces activations of the autonomic nervous system, like increased blood pressure and heart rate and can lead to arousals or awakening reactions which can be detected with the electroencephalogram (EEG) – mostly used in conjunction with other measurements which together make up polysomnography (PSG). The latter is generally regarded as the gold standard method for quantifying sleep disturbances [3]. Still, for many re-search protocols, the use of PSG is not feasible, mostly due to economical reasons. The number of EEG awaken-ings and the number of body movements are correlated, thus actigraphy/actimetry has traditionally been used instead of PSG in quite a few studies about aircraft noise effects on sleep (e. g. [18] or [23]). While both PSG and actigraphy do have their advantages and disadvantages, the validity of (wrist) actimetry methods in sleep distur-bance research has been questioned [24, 27]. Actimetry
is mostly used to estimate global variables like total sleep time (TST), sleep efficiency (SE), and wake after sleep onset (WASO), which it does reasonably well [6]. Its lim-ited value in event related research protocols pertains – depending on the specifications of a particular system – to its limitations concerning intensity quantisation and time discretisation. We therefore set out to develop a basically actimetric, but more detailed method of quantifying sleep quality parameters – especially for the sake of event related analyses for which wrist actimeters may not be accurate enough. In our field study on nightly aircraft noise events and sleep, the new method was ex-tensively tested for the first time. In this paper, we will only report about one aspect of the method, namely high
resolution actimetry. The method will be described in
more detail below.
Materials and procedures
In the Zurich field study, during a 30-night period, 60 subjects were exposed to different combinations of max-imum level, number of aircraft noise events, and play-back time of noise events (“evening” or “morning”) dur-ing the night. Although the study was not carried out in a laboratory – but in the subjects’ homes – the study de-sign was experimental by nature. Besides the bodily re-actions to noise events, indoor and outdoor sound pres-sure levels where recorded continuously as well as tem-perature, humidity and light intensity in the subjects’ bedrooms. Night-related as well as event-related out-come variables were being analyzed, such as self re-ported sleep quality, body movements (motility) as well as changes in heart and respiration rate. The study itself and all the procedures further described were approved by the ethics committee of ETH Zurich. A summary of the study has been published online [9].
■ Subjects
Subjects in the Zurich field study were recruited from a large pool of respondents from two surveys on aircraft noise annoyance that were carried out in the years 2001 and 2003 [9, 11, 29]. People interested in taking part in the study could fill in a reply form and were later con-tacted by us to arrange for an appointment at their homes. Subjects had to be at least 18 and at the most 65 years old to participate. People’s bedrooms and beds were inspected to make sure they met the requirements for the experiment. Once the subjects agreed to partici-pate, they were subjected to a health screening and a hearing test. Subjects were excluded if the average hear-ing loss in the 0.25, 0.5, 1, 2, 3, 4, 6, and 8 kHz range was higher than 15 dB. After obtaining written consent, data acquisition and noise simulation equipment was
in-118_128_Brink_Somno_345.indd 119
Somnologie 2 2008
stalled in the subjects’ bedrooms. Subjects were also in-structed on how to fill in a sleep diary every evening and morning. After the 30 night experimental period was over, subjects were debriefed and given a remuneration of 200 Swiss Francs.
■ Design
The factors of the basic study design were time (evening vs. morning), maximum sound pressure level (LAS,max (Ear)
of 50 vs. 60 dB)1 and number of noise events (8 flights vs.
16 flights). Either at the beginning or towards the end of the night, within a 90-minute period, either 8 or 16 air-craft noise events were played back from a loudspeaker in the bedroom of the subjects. The intervals between the events were steadily increasing in case of the evening noise simulations, and decreasing in case of the morning noise simulations. The average interval between noise events in the 90 minute simulation period was 6 minutes and 40 seconds. Beside the “noisy” nights, two consecu-tive quiet nights (without noise) and two nights with road traffic noise were administered in each block of ei-ther morning or evening noise. This amounted to a total of 1800 nights and 16,320 noise events. Each factor com-bination was administered twice consecutively within a block whereas one half of the sample started with noise being played back in the evening (Block 1) and the other half started with noise being played back in the morning (Block 2). Between the two blocks, a quiet night was in-troduced to avoid carry-over effects. All experiments started with two habituation nights with noise simula-tions which were excluded from the analysis. The last night was not analyzed as well. All subjects were blind to 1 A noise event can be characterized by different acoustic descriptors
which are measured in decibels (dB). One of these descriptors is the maximum sound pressure level (Lmax). This is the highest level
meas-ured within a particular measurement period. One can simply think of the Lmax as a measure of “maximum loudness” of each aircraft noise
event. Here, the denomination as “LAS,max” specifies the given figure as
accounting for the “A” frequency weighting and the “S” (for “slow”) time constant. Furthermore, the figure expresses the level that was measured at the ear of the sleeper, in contrast to e. g. a level that would have been measured outside the house.
any of these experimental conditions. Experiments ran for 30 consecutive nights in total (Fig. 1). In this paper, we report only about the effects of the morning aircraft noise simulations.
■ Aircraft noise recording and playback
Noises from aircraft flyovers were digitally recorded in the vicinity of the runway system at Zurich Airport at different locations so that the sound from departing as well as landing aircraft could be captured. Indoor re-cordings of aircraft noise events were not feasible due to technical (high recording levels needed) and organiza-tional reasons, thus the outdoor recordings have been filtered to match the indoor-frequency spectrum typi-cally found with a half open window. A total of 8 record-ings (4 departures and 4 landrecord-ings) were used for the experiment and were played back through a powered studio loudspeaker in the bedrooms of the subjects. The loudspeaker was connected to the control device’s inter-nal audio module. For each 30 night experimental ses-sion the control device was programmed to play back the noise events according to the experimental plan. An exact calibration of the playback volumes as part of the experimental setup in each bedroom was performed to make sure that each subject was administered the same levels at the ear.
■ Data acquisition
When it comes to physiology, investigations of the ef-fects of aircraft noise on sleep usually employ either rather complex (PSG) or quite simple (actimetry) mea-surement methods. While PSG provides a rich data set for the diagnosis of sleep disorders, it is rather laborious and measurements are mostly confined to only a few nights. Wrist actimetry at the other end of the spectrum is the easiest to handle method, but the least powerful. For many research applications an intermediate ap-proach without the constraints associated with either of the two methods would be optimal. Such methods have been developed since the early 1970s, particularly for # Subject
1 2 3 4 5 6 7 8 9 10 11 12 13 14 15 16 17 18 19 20 21 22 23 24 25 26 27 28 29 30 #1 ... #30
#31 ... #60
# Night
= Block of morning simulations = Block of evening simulations = No noise
= Habituation simulations
= Experimental nights with either aircraft or road traffic noise simulations, including 2 nights control condition (without noise)
Fig. 1 Study design scheme
118_128_Brink_Somno_345.indd 120
Somnologie 2 2008
recording of body movements, such as photographic and video monitoring, actigraphy watches and motility beds [13, 21]. About a decade later, attempts have been made to develop ambulant monitoring methods that omit using ECG electrodes to record parameters of heart activity. Of these, the static charge sensitive bed intro-duced by Alihanka and collaborators [1, 2] and later the polyvinylidenefluoride (PVDF) mattress [26] seemed to be the most successful of the non-invasive or more pre-cisely, non-contact techniques. Within the last decade, a few more developments for unobtrusive monitoring of vital signs during sleep have emerged such as multi-sen-sor mattresses [28], or smart textile systems [25], but none of these (if available at all) seem to really succeed on the market or have the potential to define a new de facto standard of unobtrusive measurement methodol-ogy. Facing the lack of off-the-shelf available solutions to easily measure movements, heart rate and breathing activity over longer durations, in the late 1990s, we set out to develop a monitoring system on our own. It re-cords the behavior of a sleeper by sensing the tiny vi-brancies of the body caused by the heartbeat, breathing and movement activity and uses just one kind of me-chanical transducer to derive heart rate, respiration rate, and motility. We termed this system
seismosomnogra-phy (SSG). The principle of SSG is based on the fact that
the human body, even if motionless, exerts vibration en-ergy on an underlying surface (such as a mattress), by movements of the body itself, but also by the activity of the heart (causing a small displacement of the body due to its rebound at each contraction, called the
cardiobal-listic effect), and the lifting and lowering of the thorax
and abdomen while breathing. The periodically altering mass distribution of the body of a sleeper changes the center of gravity of the bed which is reflected in an un-even distribution of the forces that act upon each bed post. By deriving these forces with force sensors placed beneath the bed posts, all shifts of the center of gravity can be recorded continuously. After filtering out un-wanted frequency components such as high frequency noise or eigenfrequency oscillations of the bed, high resolution actimetry data can be obtained. Whereas the respiratory activity can be traced with very good accu-racy as well, the determination of heart activity (the weakest of all traceable signals) is in a pilot stage, al-though we could show that at least in the laboratory con-text, SSG is also able to measure the heart rate with an accuracy of about +/– 2 beats per minute. An in-depth technical description of the method has previously been published [7].
■ Experimental control
The experiment was carried out in an unattended fash-ion, not requiring any intervention by either the subject
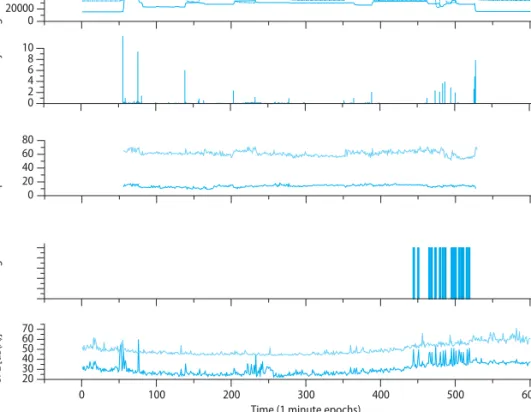
or the experimenters during the 30 night experimental period. For this purpose, a control device was con-structed consisting of a small single board computer confined in a sound proof metal box that also contained the SSG circuit, an audio module, and a 2.5” harddisk to store data and to provide the audio module with the pre-recorded WAV-Files used for the playback of aircraft noise events. For each individual installation, the most frequently occurring “switching off the lights” and wakeup-time was determined. According to this infor-mation obtained from the subjects, the control device was programmed when to start the noise simulations during the night. Noise simulations at times when a sub-ject was not in bed, were excluded from the analysis. Along with the physiological parameters, the in- and outside sound pressure levels were recorded also. Fig. 2 shows the course of all the recorded parameters from one randomly selected experimental night.
Quantifying motility levels and motility reactions
As described in [7], high resolution actimetry of a sub-ject can be sampled using either the AC or the DC chain of the SSG circuit. For the measurement of motility, we used the DC chain and will further refer to it as MotDC.MotDC is a value between 0 and 50 that is calculated by
the SSG system software and reflects the intensity of movements of the body of the sleeper. As the system samples the DC values from the sensors at 4 Hz and cal-culates and extracts the motility level MotDC with a fre-quency of 1 Hz (by calculating the average force differ-ence on all bed posts between the first and the fourth sample point within one second), the development of a motility reaction during an event can be captured with quite high detail (see also Fig. 3).
Changes in body movements as a consequence of au-tonomous activation through noise events can basically be quantified by calculating the difference of the (aver-age) motility level before and during the occurrence of an event. If a big enough difference between average MotDC values before the onset of the event and around
the point in time, when the event reaches its maximum level is present, a motility reaction can be assigned to the event. We will first look at the reaction level and then discuss (binary) reaction probabilities.
■ Motility reaction level
There are no generally accepted standards of interpret-ing actimetry data in a physiological context, now less than ever with a completely new method such as SSG. For the first-time use of our system in a larger study, we favored a quite straightforward approach: To determine the intensity of a motility reaction during an event, we
118_128_Brink_Somno_345.indd 121
Somnologie 2 2008
sampled 40 seconds of motility (MotDC) just before the
onset of the event and determined the average motility within this reference timeframe as a baseline. During the events, the beginning of the reaction timeframe was set at the point in time, when the sound pressure level of the event rose above the level 20 dB below the maximum level and lasted 30 more seconds after the maximum level was reached (the duration was thus variable for each type of aircraft noise event). The difference of the average MotDC in both timeframes was then calculated
as indicator of the level of the reaction. A positive num-ber would indicate that motility increased during the event, a negative number would indicate that the motil-ity decreased during the event. Due to the fact that the mechanical properties of beds as well as the people sleeping on them produce amplitudes of different size, the difference had to be normalized by dividing it by the mean of both average motility levels, resulting in the
re-action intensity level MotReactLevel as follows:
n m
∑MotDCi ∑MotDCj
i j
–––––––––– – ––––––––––
nm
MotReactLevel = ––––––––––––––––––––– n (1)
∑MotDCi ∑Motm DCj
i j
–––––––––– + ––––––––––
nm 2
where:
i Counter for MotDC within the reaction timeframe (during the
event)
j Counter for MotDC within the reference timeframe (before the
event)
■ Determining binary reactions
In night time noise effects research, a binary measure of reactions to events is oftentimes desired because it al-lows for a quick determination whether a particular noise event had any significant effect on a sleeper. In studies involving awakening reactions (measured with PSG), this reaction parameter is binary by nature (al-though that classification is also debatable) – an advan-tage that motility reactions do not have. The decision whether a significant reaction to an event has taken place cannot be made on theoretical grounds, but must be made arbitrarily. We decided to define any normal-ized difference above the mean of the differences in mo-tility plus their standard deviation to be the threshold value for assigning a reaction. The normalized differ-ence of the SSG system (the MotReactLevel-values) can be
in a theoretical range from – 2 to + 22. For undisturbed
sleep (or during “virtual” noise events) any difference between two time frames would on average be 0. The mean of MotReactLevel during the morning flight
simula-tions across all subjects and all events was 0.2, with a standard deviation of 0.8; thus all values of MotReact-2 This is because the maximum detectable level of Mot
DC is 50. The
strongest reaction is therefore the difference between 0 and 50, di-vided by the mean, 25, giving 2 and –2 respectively.
0 20 30 40 50 60 70
Time (1 minute epochs)
inside outside longitudinal transversal Ce n te r of g ra vi ty of be d Sim u lated Ov er fli g h ts He ar t ra te Respi ration r ate SP L [dB(A )] Actimetry 0 2 4 6 8 10 0 20 40 60 80 0 20000 40000 60000 80000 100 200 300 400 500 600
Fig. 2 Graphical representation of the SSG data stream (example night)
118_128_Brink_Somno_345.indd 122
Somnologie 2 2008
Level equal to or greater than 1 (0.2 + 0.8) were termed a “reaction” and assigned the binary value 1 (Equation 2).
1, if MotReactLevel ≥ 1
MotReactBin =
{
0, if MotReactLevel < 1}
(2)where:
MotReactBin Binary expression of the occurrence of a motility reaction
According to the above definition, from a total of 4870 aircraft noise events in the morning, 836 were marked as having evoked a motility reaction.
Changes (e. g. a rise) in the level of motility during sleep not only occur as a consequence of a noise event, but also happen for other reasons – regardless of whether noise events are present or not. This means that for any observation of a “reaction” (as defined above) during a noise event, the true cause remains unknown. However, the probability of spontaneous reactions in night time noise effects research can be determined quite easily and must normally be subtracted from the observed probability during noise events to get the so called
ad-ditional probability which is usually regarded as the
im-portant indicator3. Spontaneous motility reactions were
observed during so called “virtual noise events”. Such events were administered during the two consecutive quiet nights in the morning block according to the iden-tical playback protocol as the real noise events with the only difference that no sound was played back. A total of 1192 virtual noise events in the morning block were available for analysis, of which 98 led to a reaction ac-cording to Equations 1 and 2. The probability for spon-taneous motility reactions (Pmot,spontaneous) was first
de-termined for each subject, and then averaged, resulting in a value of 0.085. This probability value must be sub-tracted from the observed probability of a motility reac-tion to reflect the activareac-tion effect caused by the noise event alone (see also Equation 3).
Results
■ High resolution actimetry characteristics during aircraft noise events
During the morning noise simulations, a total of 4870 aircraft noise events from 8 different aircraft noise re-cordings (noise event types) could be analyzed. The chronological sequence of motility over subsequent 5-second epochs during the events shows a characteris-tic relationship with the course of the level of each noise event type, most likely due to different slopes of rise be-fore the maximum level is reached. Fig. 3 shows the 3 For an in-depth discussion of the calculation of reaction
probabili-ties in night time noise effects research see [8]
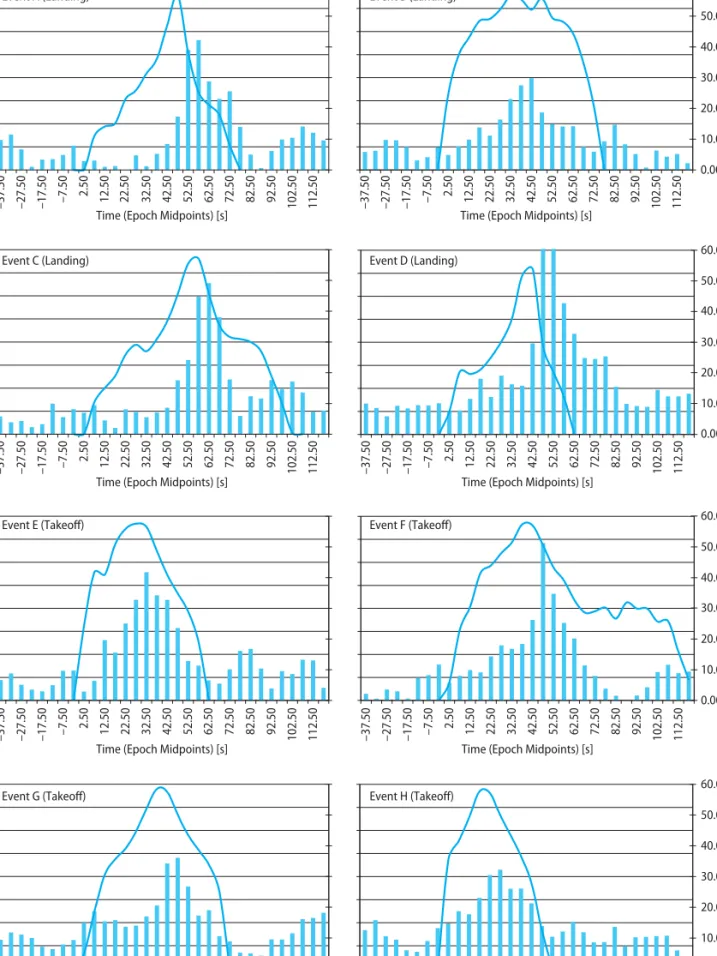
course of the sound pressure level of aircraft noise events (with LAS,max = 60 dB) and concurrent average MotDC
lev-els over subsequent epochs of 5 s duration.
As is apparent from Fig. 3, the steeper the slope of rise of the sound pressure level of an aircraft noise event prior to the point of reaching its maximum level was, the more pronounced the development of motility turned out. Especially landing aircraft in close proximity to the recipient (the recording microphone in this case; Events A,C,D) evoke stronger motility reactions than departing aircraft. The average motility during these events – after a delay of about 10 seconds – steadily rises and almost exactly mimics the course of the sound pressure levels.
■ Influence of the event order position of noise events on motility
Fig. 4 shows the motility reactions from up to 16 subse-quent aircraft noise events during the 90-minute period at the end of the night. The columns represent the aver-age motility reaction level (MotReactLevel as computed
ac-cording to [7]) over each class of event order position. According to the position on the sequence that the noise events have been experienced by the sleeper, events have been pooled and values averaged. There are more “first experienced” than “16th experienced” events, because
only events were analyzed, where the subject was de-monstrably (still) in bed and because in only half of the nights were 16 flights simulated.
The analysis of the course of the motility reactions shows a more or less steady decrease within the 90 min-ute observation period. This decrease is evident both during evening noise simulations (not shown in Fig. 4) and morning noise simulations although less accentu-ated during the evenings. The decreasing trend of the motility reactions was significant according to Page’s Trend Test [L = 70479, N = 58, Chi-Square = 7.27, p = 0.007]. The earlier in the morning aircraft noise events occur, the stronger the average bodily reaction is. Although the exact reason for the observed trend is un-known yet (maybe the more noise events have been ex-perienced, the greater is the chance that a subject is al-ready awake and does not move anymore), the data illustrate that a bodily reaction to an aircraft noise event depends either on the position on the time scale (such as e. g. expressed in the time after sleep onset) or on the existence of previous noise events, or both. A recent study [4] showed, that cardiac arousals seem to habitu-ate within a single night, the percentage of subjects with cardiac arousals was markedly higher in nights with 4 or 8 aircraft noise events compared to nights with 16 or more events. Accordingly, the decreasing trend we ob-served might just be a consequence of habituation.
118_128_Brink_Somno_345.indd 123
Somnologie 2 2008 0.4 0.6 0.8 1 1.2 1.4 1.6 1.8 2 –37.50 –27.50 –17.50 –7.50 2.50 12.50 22.50 32.50 42.50 52.50 62.50 72.50 82.50 92.50 102.50 112.50 Time (Epoch Midpoints) [s]
Event A (Landing) Event B (Landing)
Event C (Landing) Event D (Landing)
Event E (Takeoff) Event F (Takeoff)
Event G (Takeoff) Event H (Takeoff)
–37.50 –27.50 –17.50 –7.50 2.50 12.50 22.50 32.50 42.50 52.50 62.50 72.50 82.50 92.50 102.50 112.50 0.00 10.00 20.00 30.00 40.00 50.00 60.00
Sound Pressure Level
[dB(A)]
Time (Epoch Midpoints) [s]
0.4 0.6 0.8 1 1.2 1.4 1.6 1.8 2 –37.50 –27.50 –17.50 –7.50 2.50 12.50 22.50 32.50 42.50 52.50 62.50 72.50 82.50 92.50 102.50 112.50
Time (Epoch Midpoints) [s] –37.50 –27.50 –17.50
–7.50 2.50 12.50 22.50 32.50 42.50 52.50 62.50 72.50 82.50 92.50 102.50 112.50 0.00 10.00 20.00 30.00 40.00 50.00 60.00
Sound Pressure Level
[dB(A)]
Time (Epoch Midpoints) [s]
0.4 0.6 0.8 1 1.2 1.4 1.6 1.8 2 –37.50 –27.50 –17.50 –7.50 2.50 12.50 22.50 32.50 42.50 52.50 62.50 72.50 82.50 92.50 102.50 112.50 Mot DC Mot DC Mot DC Mot DC
Time (Epoch Midpoints) [s] –37.50 –27.50 –17.50
–7.50 2.50 12.50 22.50 32.50 42.50 52.50 62.50 72.50 82.50 92.50 102.50 112.50 0.00 10.00 20.00 30.00 40.00 50.00 60.00
Sound Pressure Level
[dB(A)]
Time (Epoch Midpoints) [s]
0.4 0.6 0.8 1 1.2 1.4 1.6 1.8 2 –37.50 –27.50 –17.50 –7.50 2.50 12.50 22.50 32.50 42.50 52.50 62.50 72.50 82.50 92.50 102.50 112.50
Time (Epoch Midpoints) [s] –37.50 –27.50 –17.50
–7.50 2.50 12.50 22.50 32.50 42.50 52.50 62.50 72.50 82.50 92.50 102.50 112.50 0.00 10.00 20.00 30.00 40.00 50.00 60.00
Sound Pressure Level
[dB(A)]
Time (Epoch Midpoints) [s]
Fig. 3 Average MotDC values (columns, left axis) over subsequent 5-s epochs along with the average sound pressure level in the respective epoch (smoothed curve, right
axis) for 8 different aircraft noise event types that have been played back at a LAS,max of 60 dB (A–D: Landings; E–H: Takeoffs)
118_128_Brink_Somno_345.indd 124
Somnologie 2 2008
■ Logistic regression model
A quick glance at both Figs. 3 and 4 suggests that both the slope of rise and the order of occurrence of an air-craft noise event are obvious determinants of motility reactions. Binary logistic regression analysis with ran-dom effects was further used to model the influence of these predictors on the probability of motility reactions. This form of analysis estimates the parameters of the following equation:
1 Pmot,observed =
1 + exp(–[β0 + β1 · B1 + β2 · B2 … βn · Bn]) (3)
Pmot,additional = Pmot,observed – Pmot,spontaneous
where:
Pmot, observed Probability of observing a motility reaction
(MotReactBin) during a noise event
Pmot, additional Probability of observing a motility reaction during a
noise event, that is solely attributable to the noise event itself
Pmot, spontaneous Probability of a spontaneous motility reaction
du-ring a noise event or a virtual noise event [in our case Pmot,spontaneous amounts to 0.085]
β0 Intercept
β1,2...n Parameter estimate for the 1st, 2nd … nth predictor
B1,2...n Value of the 1st, 2nd … nth predictor
In order to be used as a predictor in a statistical model, a measure of slope of rise must be defined and calcu-lated for each aircraft noise event type. The slope of rise depends on the characteristic of the sound pressure level over time and is expressible in decibels per second [dB/ s]. In the case at hand, the slope of rise was defined as a certain difference of decibels divided by the time needed to rise from that difference below the maximum level to the maximum level. How large such a difference should be can only be set arbitrarily, yet any arbitrarily set dB difference will influence the result. When defining the slope of rise related to a longer duration of noise event,
the quite flat course of the sound pressure level for the most part of the beginning of the event (e. g. with Events A and B in Fig. 3) may obscure the effect of the quick rise a few seconds before the maximum level is reached. Therefore we calculated two alternatives of slope of rise, one based on a 10 dB difference, the other based on a 20 dB difference (before reaching the maximum level). Ac-cording to the 10 dB measure, the slopes of the 8 noise event types were between 0.7 and 2.5 dB/s, according to the 20 dB measure the values range between 0.8 and 3.3 dB/s.
The statistical calculations were made using SAS (SAS version 9, SAS Institute, Cary, NC, USA). With the NLMIXED procedure, two regression models on Pmot,observed were computed incorporating the maximum
sound pressure level, the event order position (with 1 being the first event), the subject identifier (as random effect) and the slope of rise in dB/s (the first model using a 10 dB, the second using a 20 dB difference criterion). Both models yielded almost identical parameter esti-mates. For the final model, the variable slope of rise based
on the 10 dB level difference was retained. Table 1 shows
the results of the analysis.
Fig. 5 demonstrates the relationship between differ-ent predictors resulting from the logistic regression analysis and the probability of an additional motility reaction. 0.00 0.05 0.10 0.15 0.20 0.25 0.30 0.35 0.40 0.45
1st event 2nd event 3rd event 4th event 5th event 6th event 7th event 8th event 9th event 10th event 11th event 12th event 13th event 14th event 15th event 16th event
Mot
ReactLevel
Event order position Fig. 4 Average motility reaction levels (including
the standard error and linear trend) during up to 16 subsequent aircraft noise events (LAS,max of 50 dB and
60 dB accumulated) within the 90 minute period at the end of the night (“Morning noise”)
Table 1 Results of the logistic regression analysis of the probability of a motility reaction (Pmot, observed) due to aircraft noise events
Parameter Estimate SE p 95 %
Lower CI 95 % Upper CI
Intercept –3.39 0.49 < 0.00001 –4.37 –2.41 Event order position –0.05 0.01 < 0.00001 –0.07 –0.04 Slope of rise [dB/s] 0.20 0.06 0.00097 0.08 0.31
LAS,max 0.03 0.01 0.00017 0.02 0.05
118_128_Brink_Somno_345.indd 125
Somnologie 2 2008
Discussion
The results of the reported field study confirmed the predictive value of the maximum sound pressure level of noise events, but also point to other acoustical and op-erational factors that play a role in estimating noise ef-fects on sleep. This study – although we are well aware that there are many other predictors and maybe better models of overall effect – may help in raising the aware-ness of the importance of event order position and slope of rise of noise events in general. Statistical model build-ing in the above analyses was quite straightforward. We were primarily interested, whether the event order posi-tion and the slope of rise could be reasonably modeled. The most important findings are briefly discussed in the next paragraphs.
■ Effect of event order position
During early morning simulations, a declining trend of the intensity of motility reactions has been observed, indicating that reactions to subsequent noise events are partly depending on the number of previous events and/ or the reactions thereupon. Generally, the noise induced probability of awakening out of a stage of sleep increases with the time after sleep onset. However, if a subject is (already) awake, it cannot be awoken by an aircraft, therefore, the decreasing sleep pressure and naturally increasing proportion of wakefulness towards the rise time counteract the probability of observable awaken-ing (which can by definition only take place when asleep). In contrast to awakening, motility reactions can also oc-cur when a subject is awake. We found that the earlier a noise event took place, the stronger the motility reaction was. Whether this can be regarded as an indicator of a
higher probability of awakening from sleep at the begin-ning of the daily flight operations in the early morbegin-ning (after a “quiet” night) or is simply a consequence of the fact that for, e. g. the first flight in the morning, the noise-free preceding interval (another relevant predictor in most studies) before that first flight is virtually infinite, cannot be decided on solid grounds. But our observation points to the problem of timing of the end of night-time flight curfews. Even if the number of aircraft overflights during early morning would be halved at a particular immission location, our findings render obvious that the net impact would also be depending on the time the first few planes arrive (or depart). Assuming more peo-ple prematurely awake from the first plane in the morn-ing (and stay awake until rismorn-ing) than from the subse-quent ones, a simple energy-based noise rating for the time period in question (e. g. a 1h-Leq4 for the time
pe-riod between 6 und 7 h) would explain far less effect, than the time the first plane(s) arrive.
PSG parameters have not been recorded in this study, hence the occurrence of awakening reactions can not be determined. Previous research suggests that the inten-sity of motility reactions can be related to the probabil-ity of awakening reactions [22]. In this light, the current data might indicate a higher probability of awakening within the first few noise events in the morning com-pared to the later ones. This to some degree contradicts the usual finding that the awakening probability actually
increases with the time since retiring [5]. However, it has
so far not been analyzed whether this holds true also for noise events that solely occur within a relatively short time period towards the end of the night while the rest of the night remains quiet (most if not all recent studies on awakening due to transportation noise comprise noise events that are scattered across the whole night). To overcome this lack of knowledge, a study might be conceived that aims at quantifying awakening probabil-ity within e. g. the last fourth of the night while keeping the rest of the night quiet. For many airports this is much more realistic a scenario than evenly distribution of noise events across the whole night.
■ Effect of slope of rise
We found evidence that the steeper the slope of rise of the sound pressure level of events is, the higher is the probability of motility reactions. This is in line with findings in the literature [17, 19] where higher rates of 4 The term L
eq stands for “energy equivalent continuous sound
pres-sure level”. This is the most commonly used form of expressing the average sound pressure level of multiple events within a particular period of time. The Leq is the imaginary continuous sound pressure
level that would produce the same energy as the effectively fluctuating level in the same period of time. A 1h-Leq is the average level during one (particular) hour. The Leq is expressed in dB.
0.00 0.05 0.10 0.15 0.20 0.25 0.30 0.35 0.40 0.45 0.50 1 2 3 4 5 6 7 8 9 10 11 12 13 14 15 16 Event order position
Pmot, additi ona l LA,S,max=50 dB @ 1 dB/s LA,S,max=50 dB @ 4 dB/s LA,S,max=60 dB @ 1 dB/s LA,S,max=60 dB @ 4 dB/s
Fig. 5 Exposure-effect curves of the probability a motility reaction depending on the event order position for different slopes of rise (due to lack of space, confidence boundaries are not plotted)
118_128_Brink_Somno_345.indd 126
Somnologie 2 2008
autonomous activation were found with steeper slopes of rise from transportation noise events. At the same time, steep slopes of rise only occurred with landing air-craft experienced directly beneath the glide path (Fig. 3, Events A,C,D). However, the recordings from airplanes during landing approach produce less acoustic energy (approximately expressed as area under the curve in Fig. 3) per event than departing aircraft. That observa-tion may demand for a reconsideraobserva-tion of the noise rat-ing methods for residents that particularly live right below approach flight paths. The reason for this is the following: Any aircraft movement at a particular point on the ground can be described in terms of LAE5 and Lmax
(maximum sound pressure level). Today’s common noise regulation in most countries solely relies on the LAE (which is directly convertible to an Leq and vice
versa), that means, it only pertains to the energy of a noise source/event. Given the same maximum sound pressure level, landing approaches at any point on the ground typically have a smaller LAE than takeoffs. While
for the most part of immission locations off flight paths, the ratio of Lmax over LAE is irrelevant regarding effect
rating, immission locations just below a landing ap-proach flight path have a rather high ratio. Thus a rela-tively low LAE (and therefore low Leq) at such locations
under-rates the detrimental effect of a fast rise of level on a sleeper as it’s produced from landing aircraft flying at low altitudes. Consequently, any event based noise rat-ing must not only consider Lmax or LAE, but also their
ratio. In light of our results, we suspect that the higher that ratio is, the stronger the effects on sleep are.
Aircraft noise is generally regarded as being the most annoying kind of transportation noise, coming first be-fore road and rail [20]. However, a recent study by Marks and collaborators has confirmed the long standing sus-picion that this rank order does not apply for noise-in-duced sleep disturbances in terms of awakenings and alterations of sleep structure [19]. They found that rail-way noise from trains quite often elicits awakenings due to the fact that approaching trains usually display a very steep slope of rise shortly before the Lmax is reached. In
view of the results with landing aircraft, there is ample reason to suspect that the closer a dwelling is to a railway track, the more important the slope of rise of the train noise becomes in causing awakening reactions.
To elucidate the impact of railway noise on actimetry parameters as measured with the SSG system, we con-ducted a small pilot study in the Unterinntal valley in Tyrol, Austria, an acoustic environment more or less free of aircraft noise, but with considerable traffic noise from
5 L
AE is the descriptor of total sound energy of a noise event and used
to be referred to as “SEL”. The LAE is the notional sound pressure level
which, if maintained constant over one second, delivers the same total amount of acoustic energy at some point as the time-varying sound pressure level would deliver at the same point over the entire noise event duration.
railways and roads. Whereas in the Zurich field study, aircraft noise events were played back in an experimen-tally controlled fashion through loudspeakers, in the pi-lot study, the sound pressure level of naturally occurring (traffic) noises was recorded each second at the half-open windows in the bedrooms of volunteering subjects. The slope of rise of recorded events (mostly from trains) proved to be almost as important a predictor for motility reactions as was the maximum sound pressure level – an observation which confirms the findings with aircraft noise events in our field study, but also confirms an older laboratory experiment [15] as well as the most current literature on the issue [19].
■ Heart rate data
The reagibility of cardiovascular parameters under noise exposure is well documented, for laboratory con-ditions [12, 14] as well as in the field [16, 17]. A sound recording of the heart activity and the proper assign-ment of cardiac arousals at noise events has, within lim-its, been shown to be useful for indicating awakening reactions without needing a PSG setup [4]. We therefore also analyzed heart rate data in the field study, but for reasons of space, have not reported about them in the results section of this article. Heart rate data are rela-tively complex to attain from an actimetry system such as SSG. However, the heart rate measurements as carried out with SSG basically support the findings with actim-etry, with pronounced heart rate accelerations that were dependent on both maximum sound pressure level and slope of rise. Further details about the heart rate mea-surements in the Zurich field study can be found in [10].
■ Practical conclusions
Beside gaining more insights into the relationship be-tween noise events and bodily effects, the Zurich field study also served for gaining experience with the SSG methodology. Our experiences show that the SSG system is suitable for experimental noise effects studies in the field and that the system is able to provide a rough pic-ture about what sort of acoustical and/or situational pa-rameters do have an effect on bodily reactions. The proper installation of the SSG system and placement of sensors took up to 30 minutes, but once the sensors were firmly installed and the recording set up, no more effort was needed by either the subjects themselves or by the experimenters for the whole period of study. This makes SSG a very economical method, especially for long-term measurements. However, it can of course not replace PSG as it is used in sleep laboratories or more sophisti-cated field studies. In this view, we think that a further
118_128_Brink_Somno_345.indd 127
Somnologie 2 2008
evaluation/validation of the SSG method and a compar-ative study with conventional actimetry besides PSG might clarify some of the issues with the system that could not be resolved yet.
■Acknowledgements This study has been funded by the Swiss Fe-deral Office for the Environment (BAFU) to whom we are very
grate-ful. We further wish to express our gratitude to Michael Rüegg, Ari Stucki, and Johannes Rüdisser, who assisted us in the field experi-ments and the pilot study. We are also very grateful to Beat Hohmann, Helmut Krueger, Hans-Rudolf Roth and Werner A. Stahel for their advice with study design and data analysis.
■Conflict of Interest None.
References
1. Alihanka J, Vaahtoranta K (1979) A sta-tic charge sensitive bed. A new method for recording body movements during sleep. Electroencephalography and Cli-nical Neurophysiology 46(6):731–734 2. Alihanka J, Vaahtoranta K, Saarikivi I
(1981) A new method for long-term monitoring of the ballistocardiogram, heart rate, and respiration. American Journal of Physiology 240(5):R384– R392
3. Basner M, Buess H, Linke-Hommes A, Luks H, Maass H, Mawet L, et al. (2000) Wirkung von Nachtfluglärm auf den Schlaf- ein neuer Forschungsansatz. Zeitschrift für Lärmbekämpfung 47(6): 201–205
4. Basner M, Griefahn B, Muller U, Plath G, Samel A (2007) An ECG-based algo-rithm for the automatic identification of autonomic activations associated with cortical arousal. Sleep 30(10): 1349–1361
5. Basner M, Siebert U (2006) Markov Pro-zesse zur Vorhersage fluglärmbedingter Schlafstörungen [in German]. Somno-logie 10(4):176–191
6. Blackwell T, Redline S, Ancoli-Israel S, Schneider JL, Surovec S, Johnson NL, et al. (2008) Comparison of sleep para-meters from actigraphy and polysom-nography in older women: The SOF study. Sleep 31(2):283–291
7. Brink M, Müller CH, Schierz C (2006) Contact-free measurement of heart rate, respiration rate, and body move-ments during sleep. Behavior Research Methods 38(3):511–521
8. Brink M, Schierz C, Basner M, Samel A, Spreng M, Scheuch K, et al. (2006) Bericht zum Workshop “Aufwachwahr-scheinlichkeit”: Bestimmung lärmin-duzierter Aufwachwahrscheinlichkeiten in der Nachtlärmwirkungsforschung und Anwendung entsprechender Wir-kungsmodelle für Prognosezwecke [in German]. Retrieved 6 January 2008, from http://e-collection.ethbib.ethz.ch/ show?type=bericht&nr=485
9. Brink M, Wirth K, Rometsch R, Schierz C (2005) Lärmstudie 2000 Zusammen-fassung, from http://e-collection.eth-bib.ethz.ch/show?type=bericht&nr= 444
10. Brink M, Wirth K, Rometsch R, Schierz C (2007) Lärmstudie 2000 – Der Ein-fluss von abendlichem und morgend-lichem Fluglärm auf Belästigung, Be-findlichkeit und Schlafqualität von Flughafenanwohnern (Schlussbericht zur Feldstudie), from http://www.la- erm2000.ethz.ch/files/LS2000_Feldstu-die_Schlussbericht_1.0.pdf
11. Brink M, Wirth K, Schierz C (2007) Swiss Noise Study 2000: Exposure-Ef-fect-Curves of Annoyance 2001 and 2003 (electronic data), from http://www. laerm2000.ethz.ch/files/SNS2000_E-E-Curves.zip
12. Carter N, Henderson R, Lal S, Hart M, Booth S, Hunyor S (2002) Cardiovascu-lar and autonomic response to environ-mental noise during sleep in night shift workers. Sleep 25(4):457–464
13. Crisp AH, Stonehill E, Eversden ID (1970) The design of a motility bed in-cluding its calibration for the subject‘s weight. Medical & Biological Enginee-ring 8(5):455–463
14. Di Nisi J, Muzet A, Ehrhart J, Libert JP (1990) Comparison of cardiovascular responses to noise during waking and sleeping in humans. Sleep 13(2): 108–120
15. Hofman W, Kumar A, Eberhardt J (1993) Comparative evaluation of sleep distur-bance due to noises from airplanes, trains and trucks. Paper presented at the Noise & Man, Bron, 1993
16. Hofman WF, Kumar A, Eberhardt J (2004) Effects of transport noise on arousals during sleep. Paper presented at the 33rd International Congress and Exposition on Noise Control Enginee-ring InterNoise 2004, Prague, Cech Re-public, 2004
17. Hofman WF, Kumar A, Tulen HM (1995) Cardiac Reactivity to Traffic Noise du-ring Sleep in Man. Journal of Sound and Vibration 179(4):577–589
18. Horne JA, Pankhurst FL, Reyner LA, Hume K, Diamond ID (1994) A field study of sleep disturbance: effects of aircraft noise and other factors on 5,742 nights of actimetrically monito-red sleep in a large subject sample. Sleep 17(2):146–159
19. Marks A, Griefahn B, Basner M (2008) Event-related awakenings caused by nocturnal transportation noise. Noise Control Engineering Journal 56(1): 52–62
20. Miedema H, Vos H (1998) Exposure-re-sponse relationships for transportation noise. Journal of the Acoustical Society of America 104(6):3432–3445
21. Muzet A, Becht J, Jacquot P, Koenig P (1972) A technique for recording hu-man body posture during sleep. Psy-chophysiology 9(6):660–662
22. Passchier-Vermeer W (2003) Night-time noise events and awakening (TNO Inro report 2003.32). Delft: TNO Inro 23. Passchier-Vermeer W, Vos H,
Seenbek-kers J, van der Ploeg F, Groothuis-Ouds-hoorn K (2002) Sleep disturbance and aircraft noise exposure – exposure ef-fect relationships (TNO Inro report 2002.027). Delft: TNO Inro
24. Pollak CP, Tryon WW, Nagaraja H, Dzwonczyk R (2001) How accurately does wrist actigraphy identify the states of sleep and wakefulness? Sleep 24(8): 957–965
25. Sensatex: Smartshirt System. Retrieved 10 March 2008, from http://sensatex. com/smartshirt.html
26. Siivola J (1989) New noninvasive piezo-electric transducer for recording of re-spiration, heart rate and body move-ments. Medical & Biological Engineering & Computing 27(4):423–424
27. Tryon WW (2004) Issues of validity in actigraphic sleep assessment. Sleep 27 (1):158–165
28. Van der Loos HFM, Ullrich N, Kobaya-shi H (2003) Development of sensate and robotic bed technologies for vital signs monitoring and sleep quality im-provement. Autonomous Robots 15(1): 67–79
29. Wirth K (2004) Lärmstudie 2000. Die Belästigungssituation im Umfeld des Flughafens Zürich, Shaker Verlag, Aachen
118_128_Brink_Somno_345.indd 128