Supplementary information to “Assessment of lung cell toxicity of various
gasoline engine exhausts using a versatile in vitro exposure system”
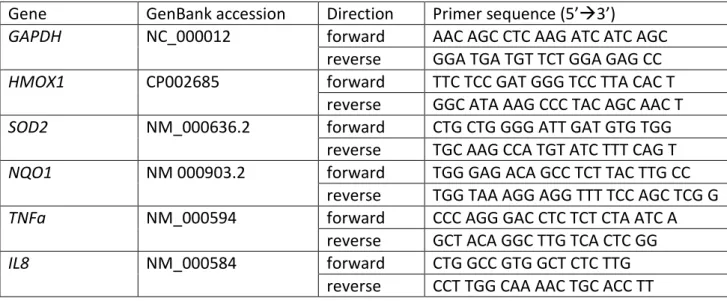
Table 1 List of genes and primer sequences used for qPCR.
Gene
GenBank accession
Direction
Primer sequence (5’3’)
GAPDH
NC_000012
forward
AAC AGC CTC AAG ATC ATC AGC
reverse
GGA TGA TGT TCT GGA GAG CC
HMOX1
CP002685
forward
TTC TCC GAT GGG TCC TTA CAC T
reverse
GGC ATA AAG CCC TAC AGC AAC T
SOD2
NM_000636.2
forward
CTG CTG GGG ATT GAT GTG TGG
reverse
TGC AAG CCA TGT ATC TTT CAG T
NQO1
NM 000903.2
forward
TGG GAG ACA GCC TCT TAC TTG CC
reverse
TGG TAA AGG AGG TTT TCC AGC TCG G
TNFa
NM_000594
forward
CCC AGG GAC CTC TCT CTA ATC A
reverse
GCT ACA GGC TTG TCA CTC GG
IL8
NM_000584
forward
CTG GCC GTG GCT CTC TTG
reverse
CCT TGG CAA AAC TGC ACC TT
Sup. Figure 1 Particle size distribution of GDI2 exhaust emissions. Both lube-oils showed increased PN in the range of 10-80 nm, while the filter efficiently removed particles larger than 40 nm.
Sup. Figure 2 cLSM images of the multi-cellular lung model after exposures to gasoline direct injection (GDI) exhaust emissions. The monolayer of cells was visible in all samples, and no abnormalities were observed in the samples. Both XY and XZ projections are shown, the scale bar on the bottom right is 20 µm and applies for all images.
Sup. Figure 3 cLSM images of the primary epithelial airway cells (MucilAirTM) after exposures to gasoline
direct injection (GDI) exhaust emissions. The primary cells from healthy donors show a confluent pseudostratified epithelium. In the bottom right box of every XY projection is a view of the top of the cell layer (same scale bar). Both XY and XZ projections are shown, the scale bar on the bottom right is 50 µm and applies for all images.
Sup. Figure 4 Quantification of lactate dehydrogenase (LDH) release, an indication for cytotoxicity, in supernatants of two lung models. High ash filtered GDI2 shows the highest variation. Data for the GDI1 car with the two filters are displayed in black to gray, while the effects of the GDI2 car are shown in green shapes. Positive controls are shown in red circles. LDH is a ubiquitous protein and can easily be measured in the supernatant when membrane damage occurred with the LDH detection kit (Cytotoxicity Detection Kit (LDH), Roche Applied Science). The kit was used according to the manufacturer’s protocol; the positive assay control was done with 0.25% Triton X-100.
Sup. Figure 5 Pro-inflammatory cytokines measured in the supernatant by enzyme-linked immunosorbent assay (ELISA). No increase in in either CXCL8 (A) or TNFa (B) is measured in any of the seven exhausts. Data for the GDI1 car with the two filters are displayed in black to gray, while the effects of the GDI2 car are shown in green shapes. Positive controls are shown in red circles. Cytokines in the cell culture medium were quantified by ELISA using the human TNFa DuoSet and the human CXCL8/IL8 DuoSet (R&D Systems DY210 and DY208) according to the manufacturers’ guidelines. CXCL8 samples in the multi-cellular lung model were diluted tenfold for measurement with the required reagent diluent, the other samples were not diluted.
Sup. Figure 6 cLSM images of the multi-cellular lung model after a three-day exposure to GDI1 reference. The monolayer of cells was visible in all samples, and no abnormalities were observed in the samples. Both XY and XZ projections are shown, the scale bar on the bottom right is 20 µm and applies for all images.