Comparison with molecular dynamics results
M. Caro, A. Ardelea, and A. Caroa)
Paul Scherrer Institute, 5232 Villigen, Switzerland
(Received 2 January 1990; accepted 19 July 1990)
Based on the profile of the energy deposition obtained using the binary collision model, we follow the diffusion of energy by solving a simplified version of the heat equation. An estimation of the molten zone compares very well with the molecular dynamics prediction for the same event. We discuss the reasons for this agreement and the relevance of such simplified procedure in terms of present-day computer limitations to simulate high energy cascades using molecular dynamics.
I. INTRODUCTION
One of the problems involved in the design of a fusion reactor and in predicting the lifetime of con-ventional fission reactors is the degradation of the engineering properties of structural components un-der irradiation.1 The understanding of the microscopic
mechanisms of damage is also relevant in the field of ion implantation.2 The starting point of the damage, the
displacement cascade, cannot be treated analytically because it drives the material into a highly nonequi-librium state, where many-body interactions, electron-phonon coupling, thermodynamic and kinetics effects simultaneously contribute and compete. Thus, a com-plete theoretical model is not yet available; computer simulations are the main method for the analysis of the initial stages of radiation damage, over a time scale that is inaccessible to experimentation.
Some of the most relevant parameters for the pre-diction of the material's behavior under irradiation are the number of freely migrating defects (FMD); their tendency to cluster, forming voids, dislocation loops, or stacking faults; the rate of atomic mixing; and the interaction with the impurities created by nuclear transmutations. All of them depend on the interaction between ions within the crystalline lattice, and there-fore a full many-body ion-ion interaction calculation in the computer simulation is strictly necessary.
This is satisfactorily achieved in the molecular dy-namics simulations (MD),3 where the space-time
trajec-tories of a large ensemble of atoms is constructed by solving the classical equations of motion generated by a model interaction potential. However, present-day com-putational restrictions impose severe limitations in the number of ions that can be followed, typically a hun-dred thousand, and therefore only low-energy cascades, up to 5 KeV, can be simulated.4"7
a)Fellow of Consejo Nacional de Investigaciones Cientificas y Tec-nicas, Argentina.
MD simulations have been very successful in giv-ing a clear representation of the different stages occur-ring in a cascade: the collisional phase, the thermal spike, the cascade quenching, and collapse. Quanti-tative information related to the above-mentioned parameters has also been obtained.
One of the most important results of MD simula-tions is the prediction of the cascade core melting in Cu and Ni.4"7 This result is obtained by comparison
be-tween (a) pair correlation functions calculated in the liquid and in the cascade, (b) the diffusion coefficient calculated in the core of the cascade and experimental values for the liquid, and (c) atomic densities in the cas-cade core and experimental value for the liquid.
This result came from MD simulations on Cu and Ni; therefore it cannot be concluded that cascade cores melt in all materials, and also that there is not direct experimental verification of melting. In this work we assume that the melting picture for Cu and Ni is cor-rect and apply simple thermodynamics to predict the behavior of cascades.
Interpretation of the damage mechanisms in terms of the cascade core melting gives a satisfactory expla-nation to the experimental behavior observed in Cu and Ni under irradiation.8 In fact, the differences in the
melting temperature between these two metals would explain the smaller and shorter core melt in Ni com-pared to Cu, with implications regarding the extent of mixing and cascade collapse.
This picture of cascades still lacks an ingredient whose importance is difficult to assess, namely, the contributions of the electronic thermal conductivity and heat capacity. In fact, the electron-phonon coupling could quench the thermal spike by heating the elec-trons and by transporting this energy away from the cascade zone. Qualitative arguments910 show that these
effects are not important in the low energy cascades simulated by molecular dynamics because the time scale, i.e., a few picoseconds, is short compared to the
phonon-electron relaxation time, However, cascades in the energy range relevant to the fusion environment certainly will last longer, and the electronic coupling determines the duration of the thermal spike.
Previous attempts to solve the cascade evolution using continuum heat equations gave only qualitative information because both the energy deposition profile and the thermodynamic factors entering the equation are, in fact, unknown.1112
The aim of this paper is to show that by coupling the binary collision approximation, which gives the profile of the energy deposition, to a simplified heat equation, a description of the melt in complete agree-ment with the results of molecular dynamics in the range of 5 KeV can be obtained. Although this descrip-tion does not provide the time scale of the processes, it could be very useful in the evaluation of subcascade interactions, in an energy range inaccessible to MD with present-day computational performances.
The reasons for this agreement are not evident
a priori. In fact, the MD simulations have shown that
several effects that could have been considered as im-portant, should not be considered as such. In particu-lar, the amount of energy transported by the pressure wave and focusons, the variation of the melting tem-perature with pressure, and finally the variations of the latent heat of melting with pressure, are some of these effects which proved to be unimportant. Almost all of the energy deposited into the lattice is trans-formed into heat, and so the heat equation correctly gives the cooling. The contribution of replacement col-lision sequences to the energy transport is included in both the MD and the lattice version of the binary colli-sion model we have used.
The paper is organized as follows: Sec. II describes the output of the binary collision model, used as an ini-tial energy density profile; Sec. Ill shows the simplifica-tions of the heat equation that allow us to obtain solutions regardless of the values of the thermodynamic input; Sec. IV compares our results to those of MD; finally, Sec. V justifies the reasons for the good agree-ment between the binary collision model and MD and stresses the relevance of this type of simplified ap-proach for high energy events.
II. BINARY COLLISIONS
In this approximation, the cascade develops inside the crystalline solid as a sequence of two-body colli-sions.13 The crystalline structure is given by the
loca-tions of the target atoms. An atom is set into motion if, as a consequence of a collision, it receives an energy larger than some cut-off, Ec. Similarly, an atom no longer moves if its energy falls below Ec. A cascade ends when all atoms have an energy lower than Ec. Ad-ditional parameters are a binding energy, Eb, which is
lost every time an atom is displaced from its perfect lattice position, and the parameters controlling the in-elastic electronic losses. For the energies considered here, up to 5 KeV, inelastic electronic losses are negli-gible. We have only two parameters, namely, Eb and Ec. The first one determines the threshold energy for the formation of Frenkel pairs. Although there is some freedom in the choice of Ec, which essentially deter-mines the total number of atoms set into motion, it will be shown in Sec. IV that this has a negligible influence on the energy density profile.
The energy balance in this type of approach is as follows: The total initial energy, i.e., the kinetic energy of the primary knock-on atom, EPKA, is distributed be-tween the inelastic collisions with electrons, Eh the ki-netic energy, Ek, mentioned above, and the binding energy lost at each collision, Eb (which represents the potential energy of the distorted lattice and the excita-tions of vibraexcita-tions), plus the energy transferred to those atoms below the cut-off. This last contribution is called damage energy, Ed. Therefore,
EPKA = Et + Ed (1)
The dependence of these values with EPKA is such that
Et increases, Ed decreases, and Ek remains constant as
EPKA increases.14 Ek is between 20% and 30% of EPKA,
regardless oiEPKA.
To perform these calculations we have used the Marlowe-12 code.13 The output configuration contains
the position and the kinetic energy of all atoms that have been set into motion. It represents the end of the collisional phase of the cascade.
For the cases we have studied, with EPKA = 5 KeV in Cu, we obtain Ek in the neighborhood of 1.8 KeV. The key problem now is how to relate the spatial distri-bution of this amount of energy to the real location of the total energy deposited. The volume of the melt strongly depends on this profile of energy deposition. Since the only available information in the binary colli-sion code is the last location of the atoms, a simple way to solve this problem is to apply a multiplicative factor,
EPKA/Ek, to the energy of each of these atoms. In this way the correct total amount of energy is deposited in the crystal but at the last location of the moving atoms, instead of being along their trajectories. As we show in Sec. IV, this assumption does not significantly affect the energy density profile.
We start with the energy density at the end of the collisional phase. This energy will be transformed into heat by thermal equilibration. MD results show that this is achieved after 0.25 psec for 5 KeV cascades5;
from this time on, a temperature can be defined. How-ever, the concept of temperature has to be used with care, at least at the earliest times of the heat spike, since the number of degrees of freedom with a given
energy is too small, due to a very large energy gradient. One of the basic assumptions of thermodynamics of the nonequilibrium process is thus violated. Temperature profiles for several times also show5 that the maximum
volume of the molten zone is attained at the earliest time, i.e., 0.25 psec. It is important to stress that it should not necessarily be so; it depends on the starting energy density profile.
Since we shall apply the heat equation at the end of the collisional phase, before equipartition is reached, a justification is needed. Considering the energy flow as diffusive does not imply equipartition but the absence of net crystalline momentum. This was shown to be so in Fig. 3 in Ref. 5, where the dilatation portion of the shock wave carries only a negligible portion of the total energy. As evaluated in Sec. V below, it can therefore be neglected. We proceed then to propagate this energy as heat.
III. HEAT PROPAGATION
The equation of heat conduction in an isotropic, uniform medium with thermal conductivity K and den-sity p is,
Discretization on a cubic lattice of lattice constant a gives,
Q(r,t + At) = (KAt/pa2){Q(x + a,y,z,t)
+ Q(x - a,y,z,i) + Q(x,y + a,z,t) + Q(x,y - a,z,t) + Q(x,y,z + a,t) + (Q(x,y,z - a,t) + [(Pa2/KAt) - 6]Q(r,t)} (3) In this expression p and K are functions of T, and there-fore of r and t. Taking spatial averages of these quanti-ties, (}, and choosing At such that,
At = (pa2 /7K), (4)
Eq. (3) then takes the form of a simple average over nearest neighbor cells, namely,
Q(r,t +At) = (1/7) {Q(x +a, y,z,t) + Q(x - a,y,z,t) + Q(*,y + a,z,t) + Q(x,y - a,z,t) + Q(x,y,z + a,t) + Q(x,y,z - a,t) + Q(r,t)}; (5)
where t is now measured in unknown units that we call hereafter steps. It should be noted, in addition, that these units are not linearly related to time. This ap-proximation is reasonable provided the temperature variation of the parameters in Eq. (4) is small in order to justify the average. Also, the number of steps to be integrated must be small, as this At is the largest pos-sible and the integrated function may accumulate errors due to the linearization of the differential opera-tors. Finally, the adequacy of the approximation will be evaluated by the nature of its predictions, as com-pared to MD results. If we let K be the metallic ther-mal conductivity of Cu and a its lattice parameter, then
At = 1.7 • 10~4 psec. On the other hand, conductivities
corresponding to insulators give At in the range of 0.1-0.01 psec. These figures clearly show why the effec-tive thermal conductivity cannot be the metallic one: the time scale becomes too short, compared with the electron-phonon relaxation time, for the electrons to equilibrate with ions.
In order to determine the volume of the melt we follow two procedures. First, we evaluate the energy necessary to heat the unit of volume up to the melting temperature, plus the latent heat of melting. In the sec-ond procedure, we just estimate the energy necessary to heat a classical degree of freedom up to a temperature
Tm, namely, 3 kB Tm. The differences between these two methods are, once again, the unknown contribu-tion of electrons and the differences in the potential energy on going from the solid to the liquid. Both strongly depend on the material. We interpret these two values as giving the lower and upper limits of the true molten region.
For Cu, the specific heat, Cp, at 300 K is 2.53 • KT4 eV/(K atom); the classical value is 3 kB = 2.58 •
10"4 eV/(K atom). At 2000 K it becomes 3.2 • 1(T4 eV/
(K atom). The melting temperature is 1357 K and the latent heat of melting, L, is 0.135 eV/atom. In this case, a reasonable approximation for the energy necessary to heat an atom from 0 K up to the melting point, Qi, is given by the classical law,
Gi(Cu) = 3 kB Tm = 0.35 eV/atom, (6a) and the energy to go from 0 K to the liquid phase,
Qi, is,
g2(Cu) = g i + L = 0.485 eV/atom. (6b)
Quantum effects at low temperature do not signifi-cantly change these values, and we neglect them. In Ni the specific heat at 300 K is also close to the classical value, 2.65 • 10"4 eV/(K atom), but at 2000 K it becomes
4.75 • 10"4 eV/(K atom), 85% larger due to electronic
contributions. The melting temperature being 1746 K, a reasonable approximation is to assume a linear
depen-dence of Cp between 300 K and 2000 K, giving, Gi(Ni) ~0.6eV/atom. (7a) The latent heat of melting is L = 0.191 eV/atom; there-fore,
<22(Ni) = g i + L ~ 0.79 eV/atom. (7b)
The electronic contributions to the specific heat and to the heat of melting are not included in the MD simula-tions; to compare with them, the following values of <2i and Q2 are also used,
Qi(Ni)* = 3 kb Tm = 0.450 eV/atom, (8a) Q2(Ni)* = Qx* + L* ~ 0.64 eV/atom, (8b) L* being the lattice contribution to the latent heat of melting.
From the output of Marlowe, the matrix Q(r, t = 0) is filled, with a lattice spacing equal to the lattice parameter of the corresponding metal. Heat propaga-tion is applied, Eq. (5), and profiles of spherically aver-aged energy densities at several times are calculated. The number of cells with energy above Q\ and above
Qi is evaluated.
IV. RESULTS
We present results of 5 KeV cascades in Cu and Ni, with PKA directions close to (110) and (111). The crys-tal temperature is zero in all cases. The input parame-ters in Marlowe are as follows: no electronic losses,
Eb = 0.5 eV and Ec = 4.5 eV. This value of Ec gives a thousand moving atoms.
Table I shows the relevant parameters characteriz-ing the output of Marlowe. The kinetic energy is re-markably constant in all cases, as is the number of displaced atoms, cr, are the eigenvalues of the inertial tensor of the energy distribution, indicating an asym-metry between the largest and the shortest principal axis of a factor of 0.3 to 0.4 for all events.
Figures 1 and 2 show the energy profiles for Cu(110) and Ni(110) cascades, respectively, at four different times. At step 0, both profiles are very similar since the masses and lattice parameters are similar. The impli-cation is that the time evolution in terms of steps is
TABLE I. Description of the 5 KeV cascades analyzed in this work. In all cases, input parameters for Marlowe are Eb = 0.5 eV and Ec = 0.5 eV. Ed and Ek are damage and kinetic energies, re-spectively, Np is the number of atoms set into motion, and a-, is the principal axis of inertia of the energy tensor.
PKA Ed (eV) Ek (eV) JV, CTl ( A ) CT-2 ( A ) O-3 ( A )
Cu (110} Cu (111) Ni (110) Ni (111) 3661 3721 3670 3730 1339 783 1279 762 1330 754 1270 721 17.3 16.8 18.0 16.4 15.9 15.1 17.1 14.7 11.3 12.6 12.3 12.7 2 . 0 - 1.5-°> 1.00 . 5 -0.0 " • • • • • - . . " \ — — c X Step 0 Step 8 Step 20 Step 40 Ref. [6] 10 20 R (A) 30 40
FIG. 1. Spherical averaged energy density for Cu(110)5 KeV cascade at different time steps. Step 0 corresponds to the ini-tial configuration as obtained from Marlowe. Step 8 corresponds to the maximum volume of the melt. Horizontal line at E = 0.485 eV/atom indicates the criterion for melting, Eq. (6a). Also shown is the profile at t = 0.26 psec obtained by MD simulations.6
similar too. Figure 1 also shows the data of an MD simulation using the Embedded Atom Model, EAM, for a similar event, at t = 0.26 psec.6 The similarity in
the radial distribution of the energy is striking, and it constitutes one of the main results of this work. In ad-dition, it provides us with a first estimation of a time scale, since our step 8 corresponds to 0.26 psec, or
At = 0.03 psec. It is important to point out that we
found that this similarity in the radial distribution is quite general, being independent of the cascade direc-tion, (110) or (111), and also of the MD reference used to compare with, EAM,6 or pair-potentials.5
After eight steps in Cu, the melt reaches its maxi-mum volume. This volume is 4.16 • 104 A3; it
corre-sponds to a sphere of radius 21.5 A, which compares perfectly well with the MD result.
An interesting conclusion from this point is that in MD simulations, the earliest time when a temperature
2.5 2.0-"E o jo 1.5-P 1.0-LU 0.5 0 . 0 -0 V — • — Step 0 - - < - - Step 4 • - • * — StepiO — o — Step 25 10 20 R (A) 30 40
FIG. 2. Same as Fig. 1, for Ni(110) 5 KeV cascade. Horizontal lines, at E = 0.64 and 0.791 eV/atom, correspond to both melting criteria discussed in the text, Eqs. (7b) and (8b).
evaluation is meaningful is after equipartition. In 5 KeV it occurs at about 0.25 psec; from there on, the volume of the melt decreases. In our simulations, we observe that the maximum volume of the melt occurs at step 8, where the distributions coincide. It is therefore justified to consider this volume as in a liquid phase.
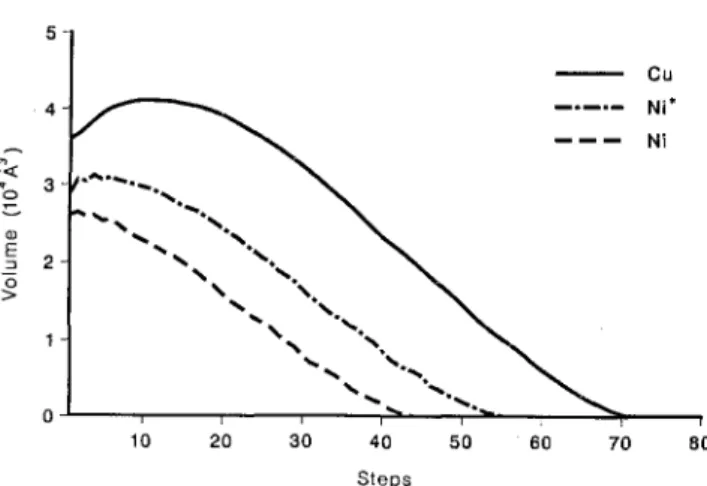
Complete resolidification is achieved after step 75, as shown in Fig. 3. Using the corresponding MD re-sults,4"7 this time is around 3.5 psec, thus providing us
with a second and more precise estimation of our time scale, namely, At = 0.046 psec.
Comparison between our results and MD for Ni is also in very good agreement when the lattice value f22(Ni)* Eq. (8b), is used for the melting
crite-rion. The corresponding time evolution is shown in Fig. 3. Estimation of the time scale in this case gives
A.t = 0.05 psec, which is, of course, compatible with
the estimation in Cu because in MD simulations only lattice thermal conductivity is included and those of both metals should be very similar. If electrons achieve thermal equilibrium with the lattice, and Eq. (7b) is used for Q2(Ni), the volume of the melt is significantly
reduced, as shown in Fig. 3, and the time scale cannot be estimated. The real situation is located between these two extreme limits. The important differences in volume and lifetime of the melt in Cu and Ni were con-sidered in Refs. 4-7 as the reason for the different ex-perimental behavior observed under irradiation.
In order to analyze whether the results reported here are due to a fortuitous coincidence, we have stud-ied the influence of the only free parameter in this ap-proach, namely, the energy cut-off in Marlowe. Table II shows the results of four 5 KeV (111) cascades in Cu at different values of Ec, between 2.25 and 18 eV. The
3
2
-10 20 30 40 50 60 70 80
Steps
FIG. 3. Time evolution of the molten volume for 5 KeV cascades in Cu and Ni. The two curves for Ni, labeled Ni and Ni* correspond to different melting criteria, Eqs. (7b) and (8b), respectively. The lowest curve corresponds to the case where electrons give their maximum contribution to the heat capacity. Time scale is un-known and is different for each one of the three curves. See text.
TABLE II. Influence of the cut-off energy, Ec, on the maximum volume of the melt. Four values of Ec are analyzed. Number of atoms set into motion, Np, maximum volume of the melt, Vm, and corresponding time step are reported.
Ec (eV) vm (A3) Step
2.25 4.5 9.0 18.0 1068 783 537 340 4.17 • 10" 4.16 • 10" 4.11 • 10" 4.12 • 10" 8 8 8 8
number of atoms set into motion is strongly dependent on Ec but the energy deposition is insensitive to it, as shown by the maximum volume of the melt reported in the table. This gives strong support to our analysis. V. DISCUSSION
The results presented in this paper are very simple and qualitative. Similar approaches were proposed sev-eral years ago.1112 However, the present interest resides
in the fact that it is only at present that this type of formalism can be compared with MD simulations. Let us discuss two points that show why the MD simula-tions are essential to support this simplified picture.
First, a cascade can be viewed as an explosion generating a radial compression wave. In that case, part of the energy is transported in the elastic field of this wave, traveling at the speed of sound (typically 40 A/psec), and leaving the cascade core in less than half a psec. The energy available to be transformed into heat is then reduced. The formation of this wave de-pends on the dynamics of the collisional phase, re-quiring a high degree of coherence in the motion in order to create a net radial momentum. As far as we know, there is no attempt in the literature to analyze this type of behavior except, naturally, the MD simula-tions where the presence of this wave is demonstrated through the radial density fluctuations reported in Ref. 5. These fluctuations decrease the density inside a sphere of 20 A and increase it outside, reaching values as high as 10% at t = 0.26 psec. However, assuming a linear response to evaluate the elastic energy stored in this strain field, we obtain a value of 0.006 eV/atom and a total energy of 100 eV, indicating that the energy leav-ing the system as a shock wave is negligible compared to the amount transformed into heat.
The second point to be made is that under a den-sity fluctuation of 10%, the pressure is, once again as-suming linear response, extremely high, ~105 bars. This
pressure may have a large influence on the melting temperature of the material.15 However, MD
simula-tions show that the melting occurs at temperatures comparable to those under normal conditions. At this point it seems important to point out that the melting
appears inside the sphere of radius 20 A, where the pressure is extremely high and negative, and melting is never seen in the region where the pressure is high and positive. If the limit where the pressure changes sign is what determines the boundary of the melt, then all the thermodynamic arguments presented in this paper could be wrong and the agreements found to be the result of an unfortunate coincidence.
To conclude, we should say that this type of analy-sis would become important when applied to high en-ergy cascades, which are inaccessible to MD at the present time and where nonlinear effects appear due to subcascade formation. An analysis in terms of the vol-ume of the melt could give a qualitative interpretation for the subcascades interactions. In addition, coupling of this type of energy profiles to rate equations could be useful to estimate the amount of ion mixing.
ACKNOWLEDGMENTS
The authors gratefully acknowledge R. S. Aver-back, T. Diaz de la Rubia, M. Victoria, and W. Green for fruitful discussions and S. Proenecke for helpful as-sistance in using Marlowe. One of us (A. A.) acknowl-edges hospitality and financial support from Paul Scherrer Institute. This work has been partially sup-ported by National Energie-Forschungs-Fonds, under contract No. 332 and the Fonds National Suisse de la Recherche Scientifique, grant No. 2.866-0.88.
REFERENCES
'Proceedings of the Workshop, Effects of Recoil Energy Spectrum and Nuclear Transmutations on the Evolution of Microstructure,
March 1988, Lugano, Switzerland, edited by W.V. Green, M. Victoria, T. Leffers, and B. N. Singh, Radiat. Eff. 113, Nos. 1-3 (1990).
2M. O. Thompson, S.T. Picraux, and J. S. Williams, in Beam-Solid Interactions and Phase Transformations, edited by H. Kurz, G. L. Olson, and J. M. Poate (Mater. Res. Soc. Symp. Proc. 51, Pitts-burgh, PA, 1986).
3J. B. Gibson, A. N. Goland, M. Milgram, and G. H. Vineyard, Phys. Rev. 120, 1229 (1960); C. Erginsoy, G. H. Vineyard, and A. Englert, Phys. Rev. 133, A595 (1964); see also D. Heermann, in Computer Simulation Methods in Theoretical Physics (Springer-Verlag, Berlin, 1986).
4T. Diaz de la Rubia, R. S. Averback, R. Benedek, and W. E. King, Phys. Rev. Lett. 59, 1930 (1987).
5T. Diaz de la Rubia, R. S. Averback, H. Hsieh, and R. Benedek, J. Mater. Res. 4, 579 (1989).
6T. Diaz de la Rubia, The Structure and Dynamics of Energetic Displacement Cascades in Cu and Ni. A Molecular Dynamics Computer Simulation Study, Ph.D. Thesis, State University of New York at Albany, (1989).
7H. Hsieh, T. Diaz de la Rubia, R. S. Averback, and R. Benedek, Phys. Rev. B 40, 9986 (1989).
8C. A. English and M.L. Jenkins, Materials Science Forum 15-18, 1003 (1987).
9C. P. Flynn and R. S. Averback, Phys. Rev. B 38, 7118 (1989). 10A. Caro and M. Victoria, Phys. Rev. A 40, 2287 (1989). "G. H. Vineyard, Radiat. Eff. 29, 245 (1976).
12R. Kelly, Radiat. Eff. 32, 91 (1977).
13M.T. Robinson and I. M. Torrens, Phys. Rev. B 9, 5008 (1974). 14M.T. Robinson, in Sputtering by Particle Bombardment, edited by
R. Behrisch (Springer-Verlag, Berlin, 1981), p. 73.
15H. Schlosser, P. Vinet, and J. Ferrante, Phys. Rev. B 40, 5929 (1989).