HAL Id: hal-01615590
https://hal.archives-ouvertes.fr/hal-01615590
Submitted on 13 Oct 2017
HAL is a multi-disciplinary open access
archive for the deposit and dissemination of
sci-entific research documents, whether they are
pub-lished or not. The documents may come from
teaching and research institutions in France or
abroad, or from public or private research centers.
L’archive ouverte pluridisciplinaire HAL, est
destinée au dépôt et à la diffusion de documents
scientifiques de niveau recherche, publiés ou non,
émanant des établissements d’enseignement et de
recherche français ou étrangers, des laboratoires
publics ou privés.
Permeable fracture zones in the hard rocks of the
geothermal reservoir at Rittershoffen, France
Jeanne Vidal, Albert Genter, Francis Chopin
To cite this version:
Jeanne Vidal, Albert Genter, Francis Chopin. Permeable fracture zones in the hard rocks of the
geothermal reservoir at Rittershoffen, France. Journal of Geophysical Research : Solid Earth,
Ameri-can Geophysical Union, 2017, 122 (7), pp.4864 - 4887. �10.1002/2017JB014331�. �hal-01615590�
Permeable fracture zones in the hard rocks
of the geothermal reservoir
at Rittershoffen, France
J. Vidal1 , A. Genter2, and F. Chopin1 1IPGS, University of Strasbourg/CNRS, Strasbourg, France,2ES-Géothermie, Schiltigheim, France
Abstract
Fluid circulation in zones of fractures are a key challenge to exploit deep geothermal heat from natural reservoir. At Rittershoffen (Upper Rhine Graben, France), two geothermal boreholes, GRT-1 and GRT-2, were drilled in 2012 and 2014, respectively. They targeted the local Rittershoffen normal fault, which strikes N-S and dips westward. In this study, major natural fractures were observed in the open holes of both wells from acoustic image logs correlated with other standard geophysical logs (gamma ray, neutron porosity, and caliper). Their permeability was evaluated at the borehole scale from temperature logs, mud losses, and gas surveys. One originally permeable (OP) fracture zone was observed in the granite of GRT-1. In GRT-2, four OP fracture zones were observed in the granite and two in sandstones. In GRT-2, fracture zones are composed by severalfluid pathways that could explain the higher natural permeability than in GRT-1. All OP fractures are associated with positive temperature anomaly, interpreted as circulation of hot geothermal water through the permeable fracture, or negative one, interpreted as the cooling of a porous, altered and fractured zone around the permeable fracture after drilling operations. Permeability of natural fracture oriented N170° seems to be intimately linked to the secondary mineral deposits resulting from paleocirculations. The geometrical fracture model along the wellbore suggests that the inclined trajectory of GRT-2 increases the connection between the borehole and the nearly vertical fracture network associated to the local fault. A good characterization of zones of fractures in a targeted natural reservoir allows an optimal exploitation of geothermal resource.1. Introduction
The European Cenozoic Rift System hosts major thermal anomalies in central Europe [Ziegler, 1992]. Its central segment, the Upper Rhine Graben (URG), extends over 300 km from Basel (Switzerland) to Mainz (Germany) in a NNE-SSW direction and is over 40 km wide [Illies, 1965]. The URG is characterized by several thermal anomalies associated with natural brine circulation through a nearly vertical multiscale fracture system cross-cutting both deep seated Triassic sediments and Paleozoic crystalline basement [Benderitter and Elsass, 1995; Pribnow and Clauser, 2000; Pribnow and Schellschmidt, 2000]. Over more than 30 years, 15 deep wells were drilled in the URG to exploit geothermal anomalies [Baumgärtner et al., 2005; Hettkamp et al., 2013; Genter et al., 2016]. In the 1980s, the enhanced geothermal system (EGS) pilot project located at Soultz-sous-Forêts was initiated to develop a deep fractured granite reservoir (Figures 1a and 1b) [Gérard and Kappelmeyer, 1987]. In crystalline rocks characterized by low matrix porosity, the mainflow channeling occurs in permeable and connected fractures [Evans et al., 2005]. Thus, projects based on EGS technology require good knowledge of the fracture network to understandflow distribution at depth and to design borehole trajectories according to the geometrical properties of the fracture network [Schulte et al., 2010]. In France, thefirst industrial geothermal project aiming to produce overheated water from a geothermal resource in a fracture network at the sediment-basement interface was initiated in 2004 at Rittershoffen (Figure 1b) [Baujard et al., 2017]. The project was designed to produce geothermal energy with a capacity of 24 MWth and deliver it to the biorefinery Roquette Frères located 15 km to the east. The geothermal doublet was drilled between 2012 and 2014, and after well-testing operations, circulation tests, and construction of the heat delivery loop, the geothermal plant was operational by mid-2016. The geothermal target was the local fault of Rittershoffen, which is oriented N-S and dips moderately westward (Figure 1b). Geological investiga-tions based on borehole images collected in the GRT-1 and GRT-2 wells provide an exhaustive characteriza-tion of natural fractures in sedimentary formacharacteriza-tions and granitic basement along boreholes [Vidal et al., 2016b].
Journal of Geophysical Research: Solid Earth
RESEARCH ARTICLE
10.1002/2017JB014331
Key Points:
• Structural characterization of normal faults and fracture zones from acoustic image logs in two recently drilled geothermal wells • Better understanding of natural
permeability in a deep hidden granitic basement from thermal profiles • Improvement of a conceptual model
of fracture zones andfluid circulations at the borehole scale in the Upper Rhine Graben Supporting Information: • Supporting Information S1 • Figure S1 • Figure S2 Correspondence to: J. Vidal, j.vidal@unistra.fr Citation:
Vidal, J., A. Genter, and F. Chopin (2017), Permeable fracture zones in the hard rocks of the geothermal reservoir at Rittershoffen, France, J. Geophys. Res. Solid Earth, 122, 4864–4887, doi:10.1002/2017JB014331. Received 14 NOV 2016 Accepted 12 JUN 2017
Accepted article online 13 JUN 2017 Published online 3 JUL 2017
©2017. The Authors.
This is an open access article under the terms of the Creative Commons Attribution-NonCommercial-NoDerivs License, which permits use and distri-bution in any medium, provided the original work is properly cited, the use is non-commercial and no modifications or adaptations are made.
The structural study was correlated with temperature log and permeability indications in order to identify and characterize preferentialfluid pathways for the geothermal fluid into the two boreholes GRT-1 and GRT-2. First, the main permeable fractures or zones of fractures at the borehole scale are located via the correlation of acoustic borehole images, standard geophysical well-log data (temperature log, caliper, neutron porosity, and spectral gamma ray), and mud-log data (cuttings, mud losses, and gas surveys) avail-able from the two deep wells. The internal organization of permeavail-able fracture zones is described in terms of strike, dip, primary mineral leaching, secondary mineral deposits, porosity, and permeability indications observed during drilling operations and associated temperature anomalies. Then, the spatial organization
Figure 1. Location of the Rittershoffen geothermal site and geological cross section through the Upper Rhine Graben at the latitude of Rittershoffen. The cross section was modified after Kappelmeyer et al. [1992], and the interpretation below 4 km depth is done by analogy to the cross section of Brun et al. [1992] and is highly speculative.
of the main permeable fracture zones is assessed using a geometric model of the discrete permeable fracture network. The results provide the locations of permeable fractures and their organization along the borehole trajectories.
The goals of the present paper are to identify the factors that characterize natural permeability at the bore-hole scale, the organization of permeable zones with respect to nonpermeable zones, the relationships between natural fracture networks at the borehole scale, and the manner in which the geothermal boreholes penetrate the permeable fracture network. One of the main challenges will be to explain how the vertical well, GRT-1, intersecting a nearly vertical local fault is rather poorly permeable, whereas the second deviated well, GRT-2, which was drilled parallel to the same local fault, evidenced larger natural permeable conditions of a the same hydrothermal system.
2. Background
2.1. Rittershoffen Geothermal Site
The Rittershoffen site is located in the URG, approximately 15 km east of the Western Rhenian fault, which strikes N45°E in this part of the graben (Figure 1a). A geothermal doublet was drilled in the southeastern end of a horst to intersect the so-called Rittershoffen normal fault at the top of the basement (Figure 1) [Baujard et al., 2017]. Based on seismic reflection interpretation of the sedimentary cover, this fault strikes N-S, dips 45° westward and displays an apparent vertical offset of approximately 200 m (Figure 1) [Baujard et al., 2017]. The wells penetrate the Cenozoic, Mesozoic, and Permian sediments overlying the Paleozoic basement. They target the geothermal resource trapped in the fracture network at the sediment-basement interface. Based on cuttings observation from GRT-1 and GRT-2, Aichholzer et al. [2015] proposed afirst detailed lithology of the sedimentary cover. The bottom of the sedimentary cover is composed of sandstones deposited during the early Triassic and Permian. They are 400 m thick in Northern Alsace. The Lower Triassic sandstones are called Vosgian sandstones and are typically medium grained to conglomeratic continental sandstones with clay formations. The Permian sandstones are argillaceous red sandstones. Their thickness is variable but estimated to 10 m at Rittershoffen. The Paleozoic granitic basement, encountered at a depth of approximately 2200 m, is divided into three units: paleoweathered oxidized granite, hydrothermally altered granite, and granitic protolith. Based on gravity data, it is assumed that the granitic basement pene-trated at Rittershoffen is the same batholith as at the neighboring geothermal site of Soultz-sous-Forêts (Figure 1) [Edel and Schulmann, 2009] and is affected by the same alteration stages [Genter, 1989; Traineau et al., 1992]. As was observed at Soultz, the pervasive alteration affects the rock mass on a large scale without visible modification of the granite texture. Then, a second type of hydrothermal alteration called vein altera-tion, due to several successive tectonic events, developed within the fracture zones and strongly affected the texture, mechanical properties, and chemical composition of the granite. The upper part of the batholith shows a pronounced reddish color due to hematization related to weathering alteration and subhorizontal joints after postorogenic exhumation.
Thefirst well, GRT-1, is nearly vertical, and the open-hole section is composed of 300 m of sandstones and 350 m of granite. Due to a lower initial productivity index of 0.50 L/s/bar, the well was successively thermally, chemically, and hydraulically (TCH) stimulated. It was considered as the future injection well and its injectivity index was enhanced to 2.5 L/s/b [Vidal et al., 2016c; Baujard et al., 2017]. The main permeable fracture zone that controlled the hydraulic behavior of the well is located in the granitic basement. At 2368 m measured depth (MD) is located a main open permeable fracture, striking N170°E and dipping 55°W with a thickness of 24 cm (Figure 2) [Vidal et al., 2016c]. This fracture is associated with a large amount of secondary quartz observed in cutting samples (Figure 2) [Vidal et al., 2016c]. It marks an interface between a highly altered granitic basement above and the granitic protolith below. This fracture presented natural permeability with-out stimulations and, thus, is qualified as originally permeable (OP). After TCH stimulation, a newly permeable (NP) fracture cluster is associated to a temperature anomaly in Triassic sandstones not observed after drilling operations. The second well, GRT-2, is deviated to the north, and the open-hole section is composed of 350 m of sandstones and 700 m of granite [Baujard et al., 2017]. The second well was not stimulated due to its good productivity index higher than 3 L/s/bar [Baujard et al., 2017]. A previous study of the acoustic image logs in the open-hole sections identified the main fracture orientation in GRT-1 and GRT-2 [Vidal et al., 2016b]. In GRT-1, the main fracture set in sandstones strikes N20°E and dips 70°W, and in the granite, the main
fracture set strikes N-S and dips 65°W. In GRT-2, the main fracture set strikes N170°E and dips 80°E in sandstones and granite. As in Soultz wells, the major fracture network is oriented N-S on average, i.e., the predominant orientation of the URG [Genter and Traineau, 1996; Genter et al., 1997; Valley, 2007].
For Soultz, Rittershoffen, and most of geothermal reservoirs in the URG, the permeability is supported by nat-ural fractures and fault zones. As geothermalfluids are channelized into this network, the study of permeable fractures and fault zone structure is a key challenge for Rittershoffen geothermal project.
2.2. Hydrothermal Circulations and Fractured System
At Rittershoffen, the high-temperature anomaly is concentrated around the Rittershoffen fault, which prob-ably hosts the main hydrothermal circulation [Baillieux et al., 2014]. The Cenozoic and Mesozoic (Lower Jurassic and Upper Triassic) sediments are also associated with a high thermal gradient of 85–90°C/km, whereas the Triassic and Permian sediments and the granitic basement are associated with a thermal gradi-ent of 3°C/km in GRT-1 and 18°C/km in GRT-2 [Baujard et al., 2017]. These low thermal gradigradi-ents are quite low compared to a normal geothermal gradient observed in stable continental basin and interpreted as the result of circulation of convective cells in a permeable fracture network [Baujard et al., 2017]. The temperature
Figure 2. Major OP fracture zone affecting the hydrothermally altered granite in GRT-1. Typology used for the structural interpretation is indicated on the acoustic image (light blue = minor fracture, dark blue = major fracture, and yellow = quartz veins). The permeable fracture at 2368 m MD characterizes the limit between the hydrothermally altered granite and the fresh granite.
profiles show either negative or positive anomalies at the bottom of the sedimentary cover and in the granitic basement.
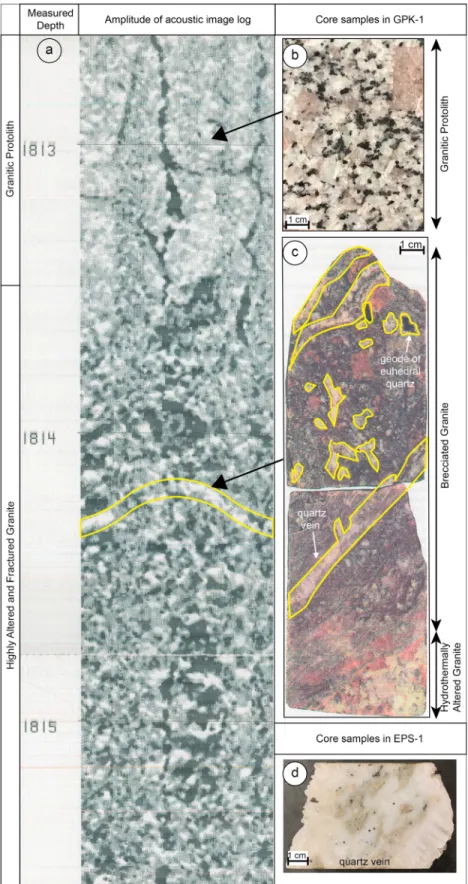
In comparison, the so-called Soultz anomaly is also concentrated around the local faults of Kutzenhausen and Soultz whichfits with the western rim of the local horst structure (Figure 1). This well known is interpreted as circulation through the permeable fracture network connected to the fault zone [Benderitter and Elsass, 1995; Pribnow and Clauser, 2000; Pribnow and Schellschmidt, 2000; Geiermann and Schill, 2010]. The Cenozoic and Mesozoic (Lower Jurassic and Upper Triassic) sediments are associated with a geothermal gradient higher than 100°C/km such as at Rittershoffen. Pribnow and Schellschmidt [2000] and Pribnow and Clauser [2000] sug-gest that they act as a cap rock formation that insulates the hydrothermal system active below. Convective cells circulate through permeable fracture zones in the Triassic and Permian sediments and the granitic base-ment and overheat the sedibase-mentary cover above. In contrast to the overlying sedibase-ments, the Triassic and Permian sediments and the granitic basement are associated with a thermal gradient lower than 5°C/km. Permeable fracture zones in Soultz reservoirs present a typical thermal signature. They are associated to local negative anomaly on thermal profiles interpreted as cooling of hydrothermally altered and porous granite after drilling operations [Genter et al., 2010]. Indeed, fracture zones observed from continuous coring are organized in clusters with a brecciated granite in the core of the zone resulting from successive stages of brit-tle deformation and surrounded by a hydrothermally altered and porous granite (Figure 3) [Genter, 1989; Genter et al., 1995, 2000]. In the core, fractures several centimeters thick are mainlyfilled by geodic quartz that we associate with high reflectivity in amplitude data of acoustic images (Figure 3) [Genter et al., 1992]. Surrounding the core, the width of damage zone ranges from centimeters to tens of meters. This altered and porous zone corresponds with the highest-porosity value (reflecting mainly the leaching of plagioclase) and with a fracture density that is less intense than in the core. It is associated to a lower amplitude reflectivity than the granitic protolith and a darker mottled pattern in acoustic images (Figure 3). Primary minerals are partly dissolved and illite precipitation dominates the granite matrix [Ledésert et al., 1999]. Despite the high-porosity values in the alteration zone, well tests reveal that 95% of theflow entered the rock mass at only 10 discreteflow points that correspond to the cores of fracture zones where the high fracture density promotedfluid circulation [Evans et al., 2005]. At Soultz, natural fractures contributed to fluid flow, and the natural permeability of the reservoir probably produces channeling inside the partial fracture sealing with a rather complex 3-D organization [Genter et al., 2000, 2010; Méheust and Schmittbuhl, 2001; Evans et al., 2005; Sausse et al., 2006, 2008, 2010; Dezayes et al., 2010].
This conceptual model of hydrothermally altered fractured zones (HAFZs) [Genter, 1989] is observed in other reservoirs and onfield in the URG. It presents similarities with the conceptual model proposed by Caine et al. [1996]. The fault core that may consist of a single slip surface and a cataclastic zone is surrounded by a fracture-dominated, altered, porous damage zone [Caine et al., 1996; Davatzes and Hickman, 2005b; Wibberley et al., 2008; Caine et al., 2010]. In high-porosity rocks as sandstones, the damage zone may be asso-ciated with cataclastic deformation bands [Chambon et al., 2006; Fossen et al., 2007] and a transition zone composed of deformed and mixed sediments [Rawling and Goodwin, 2006].
3. Materials and Methods
3.1. Fracture Zones Based On Well-Logging Data
Fracture geometry can be evaluated using acoustic image logs. In this present study, acoustic image logs were produced by Schlumberger and are referred to as ultrasonic borehole images. This logging was per-formed using a transducer that emits an ultrasonic pulse toward the borehole wall and records thefirst echo [Zemaneck et al., 1970]. The amplitude and transit time of the reflected signal generate two unwrapped but oriented borehole images (Figure 2).
Natural fractures are planes intersecting the cylindrical well. On unwrapped amplitude images, they appear as darker sinusoidal traces because the signal reflectivity is lower for the altered structure than the surround-ing rock. Images are oriented to magnetic north ussurround-ing the orientation tool attached to the probe. Thus, the amplitude and phase of these sine waves provide quantitative estimates of their orientations [Davatzes and Hickman, 2005a]. The fracture has an orientation, a dip, and a thickness. To calculate the thickness, the depth of the hanging wall and the footwall of a given fracture are measured. The thickness is the elevation differ-ence between the two depths and corresponds to the space which is partly or totally filled by
Figure 3. Top of a hydrothermally altered fractured zone at 1814 m MD in the geothermal Soultz well GPK-1. (a) Amplitude track of the acoustic image logs, (b) core sample of the granitic protolith, (c) core sample of a silicified zone affected by geodic quartz and transition to the hydrothermally altered granite, and (d) example of quartz vein in a deep permeable fracture zone in EPS-1 Soultz well.
hydrothermal minerals. In case of partial fracturefilling, a free aperture could take place. Otherwise, the frac-ture is totally sealed by a mineral assemblage of hydrothermal depos-its which has a physical contrast com-pletely different that the surrounding rock mass (Figure 4). Fractures are generally completely or partly filled with secondary deposits. In the Soultz cores, all the fractures are sealed with hydrothermalfill (quartz, carbonates, barite, clays, hematite, etc.), but only 20% of them are visible on the acoustic borehole images [Genter et al., 1997]. When a fracture has a higher transit time than the host rock on the transit time track, it is interpreted as a “free” aperture fracture (Figure 2). Fractures with a low amplitude and a high transit time are qualified as opened at least at the borehole scale (Figure 2). For example, in the GRT-1 well, only the fracture located at 2368 m MD is visi-ble on the transit time track. It has a severe negative impact on the temperature log and is characterized by an exceptional free aperture of 24 cm. In contrast, a fracture with a different amplitude but no transit time delay by comparison with the host rock is qualified as sealed. The fracture may also be partly sealed, and thus, the fracture trace is not continuous on the amplitude and the transit time track. The free aperture observed on transit time track is often exacerbated by the mechanical erosion of fractures intersected by boreholes because of tools trips andfluid circulation. Thus, the free aperture measured on transit time track is a relative geometrical aperture that is often higher than the true hydraulic aperture. Fractures sealed with geodic quartz are associated to a high-amplitude reflectivity (Figures 2 and 3) [Genter et al., 1992].
The acoustic image logs of wells GRT-1 and GRT-2 were acquired at a vertical resolution of 1 cm and an azimuthal resolution of 2°. The structural dips identifiedinthe images werecorrected for theinclination and azimuthof the GRT-1 and GRT-2 borehole trajectories. These corrections provide the true azimuth and dip of the fractures. For this study, only continuous or nearly continuous sinusoidal traces were considered. Thus, we measured the most dominating fracture network visible at borehole scale. Minor fractures, having a trace below the half of the borehole diameter, i.e., 10 cm, were not considered. A fracture is considered major when its thickness is greater than 1 cm, and more than 50% of its trace on the borehole wall is visible (Figure 2).
Some acoustic image data within fractures may be contaminated by bright spots within fractures of apparent low travel time values and associated low-amplitude values. This spurious travel time is an artifact that occurs when there is no returned reflection from the borehole wall within the data acquisition sampling window (Figure 2). Due to the inclination of the well GRT-2, the image log acquisition was affected by stick-slip and eccentering effects, especially in the granite when the tool encountered fracture zone cavities (Figure 5). The stick-slip effect is due to the considerable inclination of the well. The sonde is slowed by the roughness of the borehole and then moves rapidly. The sonde is supposed to be centered in the wellbore; thus, its distance to the well-bore should be identical for 360°. However, when the well is highly inclined, the sonde is not centered, and the transit time data are noisy because they are affected by the eccentering effect. Stick-slip and eccentering effects affect the data quality and approximately 120 m of the open-hole section were not imaged properly. The bottom of the hole was not imaged because the well was too hot, and the internal temperature of the tool was too high. In addition to borehole images, fracture zones can be characterized by standard geophy-sical logs, such as caliper, spectral gamma ray, and neutron porosity [Traineau et al., 1992; Dezayes et al., 2010]. The caliper measures the borehole diameter. At a fracture zone, the wellbore is not circular because it is affected by fracture branches. Caliper data show several peaks associated with fracture branches and pre-senting a cave-like shape. A six-arm caliper was acquired with an orientation tool that indicates the position
Figure 4. Sketch of partly sealed fracture at borehole scale (Qtz = quartz, Cb = carbonates, and Brt = barite).
of thefirst arm to the north. Thus, it was possible to derive the orientation of fractures having a significant thermal anomaly from the six-arm caliper log. It was especially useful in the borehole sections where the borehole image acoustic log was missing or with a poor quality. Spectral gamma ray data involve measuring the potassium, thorium, and uranium contents to detect the leaching of radioactive primary minerals (negative anomaly) or concentration of secondary radioactive elements in clay minerals (illite) due to the hydrothermal alteration of fracture zones (positive anomaly). The neutron porosity log is based on the effects of the formation of fast neutrons emitted by a source. In granite, the neutron porosity log is strongly affected by the presence of fractures, clays, and hydrated minerals, The decrease of the gamma ray, the increase of the neutron porosity, and a cave shape observed on the caliper which could be associated with thermal anomalies are indicators of a permeable fracture zones [Traineau et al., 1992; Dezayes et al., 2010].
3.2. Present-Day Permeability Indicators
In the neighboring geothermal site, Soultz-sous-Forêts, which was extensively investigated based on 810 m length of core section in granite, the natural permeable indicators such as drilling mud losses or brine outflow are intimately linked to the HAFZs [Genter et al., 2000, 2010; Evans et al., 2005; Mas et al., 2006; Sausse et al., 2006, 2008, 2010; Dezayes et al., 2010]. To investigate the permeable structures, mud-logging data (mud losses, gas occurrences, and cuttings) and geophysical logs (spectral gamma ray, neutron porosity, and tem-perature logs) are used. Mud losses or geothermalfluid inflows observed during drilling operations indicate a permeable fracture zone [Davatzes and Hickman, 2005b; Dezayes et al., 2010]. Alkanes occurrences, as well as other gases, such as helium, CO2, and radon, are associated with permeable fracture zones, as evidenced in
the Soultz granite [Vuataz et al., 1990; Aquilina et al., 1993]. Mineralogical investigation of the rock cuttings was also an efficient method for identifying hydrothermally altered zones in the granite [Dezayes et al., 2014; Meller et al., 2014]. Brine circulation through a permeable fracture zone leads to partial sealing by
Figure 5. Example of stick-slip and eccentering effects affecting acoustic images in geothermal well GRT-2.
secondary geodic quartz and clay mineral deposits, which are easily detectable in cuttings by visual inspec-tion combined with X-ray diffracinspec-tion.
However, the temperature anomalies observed in a temperature profile are considered the most reliable per-meability indicator [Evans et al., 2005; Bradford et al., 2013]. In the Soultz boreholes, the depths of anomalies observed in the temperature logs spatially match the depths of fracture zones observed in the image logs or on the core samples and are thus interpreted as the thermal expression of permeable fracture zones [Evans, 2005; Dezayes et al., 2010]. Negative anomalies in the temperature logs indicate remnant cooling of the alteration zone of the fracture zone due to mud losses during drilling operations and/or water injections dur-ing stimulation [Genter et al., 2010]. Because the HAFZs show a secondary connected porosity which could locally exceed several percent, drillingfluids tend to cool preferentially those complex interconnected struc-tures than the massive granite which is poorly fractured, tight, and depleted in secondary porosity [Sardini et al., 1997; Ledésert et al., 1999; Genter et al., 2000].
3.3. Geometrical Modeling of Permeable Fractures
The geometrical modeling of the permeable fracture network along the well trajectories was performed with the MOVE™software package from Midland Valley Exploration Ltd. The main goal of this model is to ana-lyze the geometrical organization of fracture networks intersected by the well trajectories and correlate the fracture directions and dips between the two geothermal wells. All permeable fractures observed from the well-logging and mud-logging data are incorporated into the model. They are represented as disks centered on the well at the measured depth. The acoustic borehole images provide information on fracture geometry at the borehole scale but not on their extents. The evaluation of the fracture extent, shape, and orientation in the farfield requires the correlation of geophysical data such as vertical seismic profile (VSP), seismic reflection interpretation, and microseismicity [Michelet and Toksöz, 2007; Soma et al., 2007; Sausse et al., 2010]. This is beyond the scope of this article, which focuses on the fracture network along the well trajectories. Even though there is an extensive literature that links fracture properties (thickness, length, offset, horizontal trace, and aperture) and fracture size (shape, height, length, and diameter), we considered as afirst approach that the fracture extent was defined according to the magnitude of mud losses observed during drilling opera-tions. Permeable fractures associated with mud losses of≥10 m3/h are geometrically modeled with a 100 m diameter. Permeable zones associated with mud losses of<10 m3/h are modeled with a 70 m diameter. Permeable zones without mud losses but associated with a temperature anomaly are modeled with a 50 m diameter. With these three classes of fracture size, connections between fracture zones and wells that are not directly observed are geometrically constrained.
4. Results
4.1. Internal Organization of Permeable Fracture Zones in the Well GRT-1
All well-logging data and mud-logging data are correlated in Figure 6 with a single depth reference that is the depth of the casing shoe at 1924.5 m measured depth (MD). The well GRT-1 presents two permeable fracture zones affecting the open-hole section. One fracture zone is considered newly permeable (NP) and one is con-sidered originally permeable (OP). These have already been discussed by Vidal et al. [2016c].
A NP fracture zone affects the Triassic sandstones between 1988 and 2008 m MD. The cluster is composed of 16 individual natural fractures, 7 of which are major fractures with an average orientation of N20°E and a mean dip of 70°W (Figure 6a). However, this cluster does not present mud losses during drilling operations or temperature anomaly in thermal profile in postdrilling temperature profile. After stimulation operations, this cluster is associated with a temperature anomaly on the poststimulation temperature profile and thus is qualified as NP. As it is not an OP fracture zone, it will not be discussed further in this study.
An OP fracture zone affects the hydrothermally altered granite between 2325 and 2368 m MD. The frac-ture zone is composed of 51 individual fracfrac-tures, including 9 major fracfrac-tures and 12 filled with geodic quartz (Figure 6b). The dominant set of fractures is oriented N-S with a dip of 48°W, and the second set is oriented N-S with an average dip of 66°E. In detail the top of the fracture zone is characterized by nine minor fractures dipping eastward and westward and one major fracture (N20°E, 50°W) at 2326 m MD (Figure 7). Below this major fracture, a thick partly sealed fracture is observed. Over 1 m thick, the ampli-tude track is affected by a mottled dark pattern with a partial opening observed on the transit time track.
This sinusoidal trace is underlain byfive fractures filled with quartz and a major fracture zone (N13°E, 56°W) at 2328 m MD. This major fracture is 23 cm wide and presents a large free aperture in the transit time data. It is spatially associated with a strong positive neutron porosity anomaly (41%) and a large gamma ray anomaly (269 giga american petroleum industry (gAPI)) between 2328 and 2338 m MD (Figure 6). Mud losses started at 2325 m MD with aflow rate of 8 m3/h; thus, the fracture is considered to be OP. Surprisingly, there is no temperature anomaly at 2328 m MD. Below this permeable fracture, the neutron porosity and the spectral gamma ray data are very disturbed (Figure 6) and cutting sample observations indicate a highly altered granite (Figure 2). The acoustic image at the same depth indicates a lower amplitude reflectivity than in the granitic protolith associated with several fractures and quartz veins (Figure 2). The bottom of the fracture zone is characterized by a major OP structure associated with an increase in mud losses (10 m3/h) and a large negative temperature anomaly (Figure 6). The temperature decreases from 152°C at 2352 m MD to 134°C at 2380 m MD. This local-scale structure is composed of three major fractures (Figure 2). Thefirst two strike N20°E, dip 30°W, and present a thickness of 3 cm. At 2368 m MD, the third one strikes N170°E and dips 55°W. This fracture is 24 cm thick and presents a large free aperture in the transit time data. It is associated with a positive neutron porosity anomaly (16%) and a negative gamma ray anomaly ( 50 gAPI). This fracture is considered a major permeable drain controlling the hydraulic behavior of the well [Vidal et al., 2016c; Baujard et al., 2017]. It also marks sharply the limit between the hydrothermally altered granite acting
Figure 6. Composite log in the open-hole section of GRT-1. Well-logging and mud-logging data are indicated (mud losses, spectral gamma ray, neutron porosity, and postsimulation temperature profile at equilibrium). The cumulative number of fractures and the cumulative width of fractures from acoustic image logs along the open-hole section are represented. Schmidt diagrams (lower hemisphere) associated to major permeable fracture zones from acoustic image logs are also repre-sented. (a) The 1988 to 2008 m MD and (b) 2326 to 2369 m MD. Depth is measured depth, NP = newly permeable, and OP = originally permeable.
as the hanging wall and the fresh granite acting as the footwall located at 2369 MD (Figure 2). It is quite surprising that a major permeable fracture limits the hydrothermally altered granite and the nonaltered granite.
At local scale, the Rittershoffen fault is oriented N-S that is slightly different from major permeable drains observed in GRT-1. The fault is also dipping westward.
4.2. Internal Organization of Permeable Fracture Zones in the GRT-2 Well
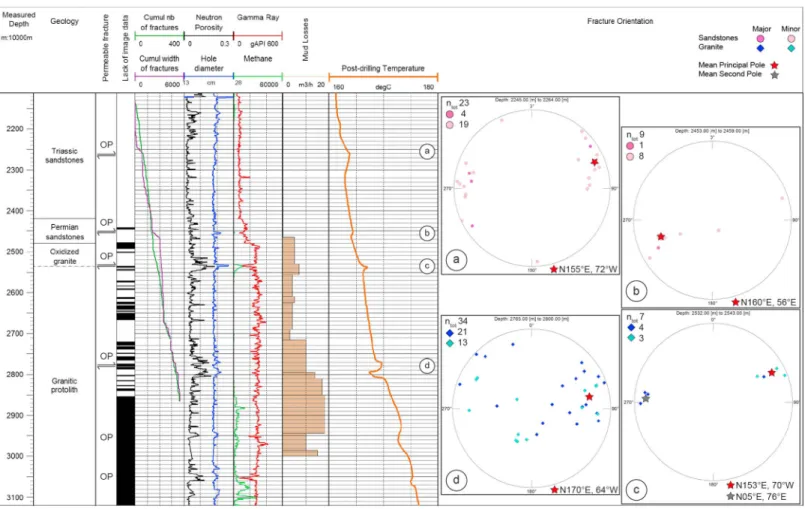
All well-logging data and mud-logging data are correlated in Figure 8 with a single depth reference that is the depth of the casing shoe at 2120 m MD. The well GRT-2 presents two permeable fracture zones in the sand-stones and four in the granite. The three deepest fracture zones in the granite were not imaged properly dur-ing acoustic image log acquisition.
A fracture cluster affects the Triassic sandstones from 2245 to 2264 m MD (Figure 8). It is composed of 23 frac-tures, 4 of which are interpreted as major fractures. Afirst set of fractures is oriented N155°E with an average dip of 72°W dip (Figure 8a). A second set of fractures is oriented N05°E with an average dip of 75°E dip. This fracture cluster is precisely described in supporting information Text S1 and Figure S1. At the top of the clus-ter, two major fractures intersect each other at 2248 m MD (Figure S1a). Thefirst one strikes N10°E, dips 72°E, and has a thickness of 3.2 cm. The second one strikes N147°E and dips 80°E with a thickness of 3 cm. The bot-tom of the cluster is also marked by two major fractures intersecting each other at 2263 m MD (Figure S1b). Thefirst one strikes N05°W, dips 67°E, and has a thickness of 2 cm. The second one strikes N145°E, dips 81°W, and has a thickness of 1.8 cm. These major fractures are associated with large positive temperature anomaly (+2°C at 2263 m MD) and thus are considered OP (Figure 8).
The Permian sandstones are affected by a fracture cluster from 2453 to 2459 m MD (Figure 8). The main fracture set strikes N160°E and dips 56°E on average (Figure 8b). It is composed of eight minor fractures and one major permeable fracture. The major fracture is located at 2455 m MD, strikes N152°E, dips 66°E, and has a thickness of 1.1 cm (Figure 9). In the transit time data, the fracture presents an almost total free aperture. It is considered OP
Figure 7. Top of the major OP fracture zone affecting the hydrothermally altered granite in GRT-1. Colors used for structural interpretation are similar to the legend of Figure 6.
because mud losses started at 2465 m MD (5 m3/h) and a negative temperature anomaly was observed at 2464 m MD ( 0.05°C). At the top of the major fracture, four tiny minor fractures intersect each other. At the lowest part of the fracture trace on the borehole wall, two minor fractures present large thickness (5.4 cm for the shallowest one and 18.8 cm for the deepest one). They are associated with a higher amplitude than the major permeable fracture but a lower one than the host rock and a high transit time. They are interpreted as thick partly sealed fractures, and cutting observations at this depth indicate presence of geodic quartz, calcite, and barite. They strike N160°E and dip 60°E.
The detailed petrographic log from cutting observations in the granitic basement is not yet available even though hydrothermal mineralogical investigations in terms of clay minerals have been analyzed with X-ray dif-fraction characterization of 40 samples [Vidal et al., 2017]. However, the top of the granite presents the gamma ray signature of the oxidized granite between 2480 and 2535 m MD (Figure 8). The gamma ray curve shifts from 144 to 300 gAPI at the sediment-basement interface and does not present major variations in the uppermost oxidized granite section (average gamma ray = 259 gAPI ± 40). This gamma ray signature is already observed in Soultz wells and GRT-1 well [Vidal et al., 2016a]. At 2535 m MD, the gamma ray signal decreases to 130 gAPI and the neutron porosity increases to 16%, which indicates the presence of a permeable fracture zone at the base of the oxidized granite. These variations are correlated with a methane concentration of 13,141 ppm at 2536 m MD (Figure 8). At 2537 m MD, the temperature profile presents a positive anomaly of +2°C in conjunction with mud losses of 7 m3/h (Figure 8). Acoustic data are rather difficult to interpret at this depth but are described in supporting information Text S2 and Figure S2. Thefirst fracture set of the cluster is oriented N153°E with a 70°W dip on average. The second fracture set of the cluster is oriented N05°E with a 76°E dip on average (Figure 8c).
Figure 8. Composite log in the open-hole section of GRT-2. Well-logging and mud-logging data are indicated (mud losses, neutron porosity, and postdrilling temperature profile at equilibrium). The cumulative number of fractures and the cumulative width of fractures from acoustic image logs along the open-hole section are represented. Schmidt diagrams (lower hemisphere) associated to major permeable fracture zones from acoustic image logs are also represented (2245 to 2264 m MD, 2453 to 2459 m MD, 2610 to 2612 m MD, and 2766 to 2800 m MD). Black sections indicate depths where acoustic image logs were not acquired. Depth is measured depth and OP = originally permeable.
Two major fractures present a free aperture and are qualified as OP. At 2534 m MD, the first OP fracture strikes N-S, dips 80°E, and presents a thickness of 6.2 m (Figures S2a and S2b). At 2540 m MD, the second OP fracture strikes N10°E and dips 72°E with a thickness of 1.5 cm (Figure S2c).
The main permeable fracture cluster is located between 2766 and 2800 m MD in the granitic protolith (Figure 8). At these depths, occurrences of secondary clay minerals are associated with hydrothermal altera-tion [Ledésert et al., 1999; Vidal et al., 2017]. Thirty-four individual natural fractures affect the granitic batholith, and 21 are considered major. The orientations of the fractures are very scattered. The main set strikes N170°E and dips 64°W on average (Figure 8d). Thefirst major fracture is present at 2767 m MD (Figure 10a). It strikes N154°E and dips 83°W with a thickness of 6.6 cm. At 2766 m MD, a positive neutron porosity peak of 15% is observed. At 2770.5 m MD, another fracture is observed with a thickness of 3.6 cm. It strikes N160°E and dips 87°W. It is associated with a positive neutron porosity peak of 15% at 2771 m MD and also with an increase in mud losses to 10 m3/h (Figure 8). At 2774 m MD, a 17 cm thick fracture strikes N170°E and dips 64°W (Figure 10b). Although the acoustic image is noisy at this depth, the fracture does not present a total free aperture in transit time scale and geodic quartz associated to high reflectivity is suspected from the amplitude track and con-firmed from cuttings observations. At 2787 m MD, a major fracture strikes N45°E and dips 87°E, with a thickness of 4 cm (Figure 11). This section is also affected by a fracture parallel to the borehole trajectory. Its trace is arch shaped or oval shaped and is observed at 2786.7 m MD and from 2788.2 m MD to 2789.5 m MD. This fracture strikes approximately N-S with a dip of approximately 55°W. These fractures are considered OP because they are associated with a positive temperature anomaly (+2°C) that extends from 2770 to 2790 m MD (Figure 8). From 2790 m MD to 2800 m MD, the neutron porosity and the spectral gamma ray are very disturbed (Figure 8). The granitic batholith is affected by natural fractures and presents a lower amplitude reflectivity with a mottled dark pattern in acoustic image logs. This section is associated with a negative temperature anomaly ( 3°C) that extends from 2795 to 2805 m MD, and mud losses increase to 17 m3/h (Figure 8).
In the deep granitic basement, methane occurrences are observed below 2800 m MD. Two permeable zones are observed in the deep granite but are not imaged by the acoustic image data (Figure 8). The
six-arm-oriented caliper data were not acquired at this depth, but the simple caliper data present many individual peaks associated with the presence of fracture clusters and reach 23.5 cm at 2950 m MD. At 2950 m MD, the gamma ray signal decreases to 173 gAPI, and the neutron porosity increases to 10%. These variations indicate the presence of a fracture zone. It is associated with a negative temperature anomaly ( 0.5°C) over approximately 50 m. From 3000 m MD, hot geothermal water inflows are observed locally. At 3050 m MD, a negative gamma ray anomaly ( 220 gAPI) is associated with neutron porosity variations (12% at 3050 m and 3060 m MD). The caliper values reach 23.5 cm at 3050 m MD. A negative temperature anomaly ( 1°C) extends from 3050 to 3070 m MD, with a minimum of 175°C at 3060 m MD. Methane concentrations increase below 3050 m MD, with a maximum of 11,500 ppm at 3100 m MD. There is no evidence of additional permeable fractures between 3100 m and the bottom of the hole at 3196 m MD.
4.3. Spatial Organization of Permeable Fracture Zones
1 is nearly vertical and intersects one OP fracture zone in the granite protolith (Figure 6 and Table 1). GRT-2 is inclined and intersects four OP fracture zones in the granite and two in the overlying clastic sediments
Figure 10. Major OP fracture zone affecting the granitic protolith in GRT-2. (a) Major fractures at 2767 and 2770.5 m MD and (b) fracture core at 2774 m MD that characterizes the top of the alteration zone. Colors used for structural interpreta-tion are similar to the legend of Figure 8.
(Figure 8 and Table 1). The permeable fractures are roughly oriented N170°E–N175°E and dip 85°E and 65°W in both wells (Figure 12) and mimic the main fracture set observed in the open-hole sections [Vidal et al., 2016b]. The orientation and dip of permeable fractures are not linked to the polarity of the temperature anomaly. In the granitic basement, two main major permeable fractures intersect the boreholes: one along GRT-1 at 2368 m MD (GRT1FZ2368), i.e., 2352 m true vertical depth (TVD), and one GRT-2 at 2774 m MD (GRT2-FZ2774), i.e., at 2393 m TVD (Table 1 and Figure 13a). They both strike N170°E and dip moderately westward. On Figure 13c, they appear as two parallel planar structures in the granitic formation with roughly the same dip direction. In GRT-1, the main major permeable fracture GRT1-FZ2368 is a thermohydraulic interface located below a highly altered, porous, and fractured granite with an apparent thickness of 40 m. At the top of the alteration zone, there is a second but less pronounced major permeable fracture GRT1-FZ2328 (Table 1 and Figure 13). These two fractures present a similar orientation and dip. GRT1-FZ2328 does not match in depth with the temperature anomaly, but it is probably associated to the large negative anomaly below.
In GRT-2, the main major permeable fracture GRT2-FZ2774 is surrounded by a porous and highly fractured granite with an apparent thickness of 45 m. Several other majors fractures are affecting this granitic section whose four are permeable (Table 1 and Figure 13d): GRT2-FZ2770.5 and GRT2-FZ2788 which are collinear to
Figure 11. Major OP fracture zone from 2786.6 to 2789.5 m MD affecting the granitic protolith in GRT-2. Colors used for structural interpretation are similar to the legend of Figure 8.
the mean of the fracture set (N170°E, Figure 8d) with a primarily westward dip; and FZ2767 and GRT2-FZ2787 which are roughly perpendicular to the mean fracture set (Figure 8d) with a primarily westward dip. At the top of the granitic basement, two eastward dipping major permeable fractures (GRT2-FZ2534 and GRT2-FZ2540) are nearly conjugated to the main fracture set striking N170°E. They delimit a porous and highly fractured granitic section. Also, the geometrical model suggests that they probably intersect the GRT2-FZ2774 fracture (Figure 13b). However, their spatial extents could be overestimated. In the sandstones, two intersecting striking directions (N10°E and N150°E) are observed. In the Permian sandstones, one isolated major permeable fracture GRT2-FZ2455 located at 2141 m TVD dips eastward (Figure 13d). Above it, in the Triassic sandstones, the fracture zone is composed of two closely spaced major permeable fracture couples located at the base of highly fractured section of sandstones (GRT2-FZ1.2263 and GRT2-FZ2.2263) and at its top FZ2248 and GRT2-FZ2248.5). In both couples, one major permeable fracture strikes N10°E (GRT2-FZ1.2263 and GRT2-FZ2248) and the other strikes N150°E (GRT2-FZ2.2263 and GRT2-FZ2248.5). In the bottom couple, they are antithetic fractures that intersect each other. The highly fractured section of sandstones is also composed of thick sealed fracture.
5. Discussion
5.1. Permeable Fracture Zones in the Rittershoffen Wells
The geothermal target was the Rittershoffen normal fault known at seismic scale from geophysical data that host the main hydrothermal circulation system (Figure 14a) [Baillieux et al., 2014; Baujard et al., 2017]. The local Rittershoffen fault is oriented N-S and dips westward. The granitic basement is highly fractured at all scales, from large faults to small-scale fractures to microcracks at the grain scale. Hydrothermal circulations occur at several fracture scales. Both geothermal wells intersect permeable fracture zones in the sandstones and granitic basement (Table 1 and Figure 13a). The maximum horizontal stress SHmaxis oriented N170°E
(Figure 12) [Hehn et al., 2016].
GRT-1 is nearly vertical and the natural permeability is localized in a single permeable fracture zone between 2326 and 2369 m MD in the granitic basement (Figure 6). First-order permeability indicators indicate that the mainfluid pathway is located at 2368 m MD. It correspond to an open thick fracture (GRT1-FZ2368) at the inter-face between a highly hydrothermally altered granitic section above and a poorly altered and fractured granite below (Figure 2). This petrographic contrast suggests that the mainfluid pathway could be a slip surface with a significant displacement, and thus, the highly hydrothermally altered granitic section could be the hanging wall of the fracture zone. Observations of quartz veins associated tofirst-order permeability in the core zone coincide with conceptual models [Caine et al., 1996; Genter et al., 2000]. This fracture zone presents an asymme-trical structure with a 40 m thick of highly hydrothermally altered granite located above the mainfluid pathway. This asymmetric structure slightly differed from fracture zones observed on core samples at
Table 1. Major OP Fractures Observed From Borehole Data in GRT-1 and GRT-2 Geology Name
Measured Depth (m)
True Vertical Depth (m) Strike (deg) Dip (deg) Thickness (cm) Temperature Anomaly GRT-1
Highly altered and fractured granite GRT1-FZ2328 2328 2312.5 N20°E 50°W 23 Negative Highly Altered and fractured Granite GRT1-FZ2368 2368 2352 N170°E 55°W 24
GRT-2
Triassic sandstones GRT2-FZ2248 2248 1974.5 N10°E 72°E 3.2 Positive Triassic sandstones GRT2-FZ2248.5 2248.5 1974.5 N147°E 80°E 3
Triassic sandstones GRT2-FZ1.2263 2263 1986 N05°E 67°E 2 Triassic sandstones GRT2-FZ2.2263 2263 1986 N145°E 81°W 1.8
Permian sandstones GRT2-FZ2455 2455 2141 N152°E 66°E 1.1 Negative Highly altered and fractured granite GRT2-FZ2534 2534 2207 N0°E 80°E 6.2 Positive Highly altered and fractured granite GRT2-FZ2540 2540 2209.5 N10°E 72°E 1.5
Highly altered and fractured granite GRT2-FZ2767 2767 2387.5 N154°E 83°W 6.6 Positive Highly altered and fractured granite GRT2-FZ2770.5 2770.5 2390 N160°E 87°W 3.6
Highly altered and fractured granite GRT2-FZ2774 2774 2393 N170°E 64°W 17 Highly altered and fractured granite GRT2-FZ2787 2787 2404 N45°E 87°E 4 Highly altered and fractured granite GRT2-FZ2788 2788 2404.5 N0°E 55°W 3
Soultz. This highly hydrothermally altered granitic section is characterized by high porosity and occurrences of clay minerals. The presence of clay minerals tends to reduce the permeability of the fracture zone [Caine et al., 1996]. First-order permeability is not observed at the borehole scale. Another fluid pathway (GRT1-FZ2328) is located at the top of the permeable fracture zone (Figure 7), but its permeability is prob-ably reduced by secondary hydrother-mal sealing.
GRT-2 is highly inclined to the north, and the natural permeability is localized in several permeable fracture zones in both the sandstones and the granite. The major permeable fracture zone is located between 2766 and 2800 m MD in the granite. First-order permeability indicators indicate that the mainfluid pathway is located at 2774 m MD. It cor-responds to an open thick fracture (GRT2-FZ2774). This mainfluid pathway is surrounded by 35 m thick of highly fractured and porous granite as sug-gested by geophysical logs (neutron porosity, gamma ray, and acoustic images). In contrast with GRT-1, this fracture zone is composed of four otherfluid pathways (GRT2-FZ2767, 2770.5, 2787, and 2788) (Figure 14c). As described by Faulkner et al. [2010], the presence of large-scale fractures with secant orientations favors the formation of intersections and is associated with higher perme-ability values. The illitization of the major permeable fracture zone is less intense than in GRT-1 [Vidal et al., 2017]. Thefirst-order permeability is supported by a more complex hydraulic network of channels than observed at Soultz. Other fracture zones contribute to the natural permeability of the well. A permeable frac-ture zone is located between 2532 and 2543 m MD. This zone is located 55 m below the sediment-basement interface, at the limit between the oxidized granite and the granitic protolith (Figure 8). Two permeable fractures (GRT2–2534 and GRT2–2542) are surrounded by a highly fractured and porous granitic section (Figure S2). The top of the granitic basement is a porous and clay-rich zone with a high fracture density [Vidal et al., 2016a, 2016b]. An 11 cm thick open fracture was observed at 2236 m MD in GRT-1. This fracture did not behave as a permeable structure during drilling operations. This paleoweathered granitic formation is not considered as a permeable matrix or fractured aquifer. At the base of the sedimentary cover, an isolated permeable fracture zone (GRT2-FZ2455) is located at 2455 m MD and surrounded by thick sealed fractures (Figure 9). The Triassic sandstones also present a permeable cluster from 2245 to 2264 m MD (Figure S1). The presence of thick sealed fractures spatially closed to opened fracture at the borehole scale and the occur-rences of geodic quartz, calcite, and anhydrite suggest paleocirculations that lead to fracture plug. At Soultz, fractures in sandstones arefilled by barite, carbonates, secondary quartz, and galena [Vernoux et al., 1995; Griffiths et al., 2016]. Permeable fracture zones in the Triassic and Permian sediments do not support the con-ceptual model proposed [Chambon et al., 2006; Rawling and Goodwin, 2006; Fossen et al., 2007].
Major permeable fracture zones intersected in both wells are a combined conduit-barrier case from the conceptual model for fault-relatedfluid flow in Caine et al. [1996]. They act as a short-lived conduit that then sealed to form a barrier toflow. Their permeability mainly depends on the secondary mineral deposits (quartz or clay minerals) and the secant orientation of fractures that channelized circulations favoring hydraulic con-nections [Caine et al., 1996; Faulkner et al., 2010]. Major permeable fracture zones in the granitic basement
Figure 12. Schmidt diagram lower hemisphere of permeable fractures affecting granite and sandstone in GRT-1 and GRT-2. Data are from Table 1. Disks are for fractures in sandstones, diamonds for granite, blue for fractures associated to negative temperature anomaly, and red for positive one.
(between 2326 and 2369 m MD in GRT-1 and between 2766 and 2800 m MD in GRT-2) are heterogeneously affected by illitization due tofluid circulations [Vidal et al., 2017]. In GRT-1, intense illitization observed at the top of the fracture zone suggests paleocirculations that could plug fractures and reduce the natural permeability. In GRT-2, the fracture zone is probably less mature with a less intense illitization. The natural permeability of the well was high enough at the borehole scale for industrial exploitation, and the well was not stimulated unlike GRT-1 [Baujard et al., 2017].
5.2. Thermal Signature of Permeable Fracture Zone in Rittershoffen Wells
In the Triassic and Permian sediments and the granitic basement, the temperature profiles show either a null thermal gradient in GRT-1 (Figure 6) or a low one in GRT-2 (Figure 8), indicating both hydrothermal nearly vertical circulation (Figure 14b) [Baujard et al., 2017]. Similarly to the Soultz site, sediments above the Triassic units are associated with a very high thermal gradient of 95°C/km (Figure 14b) because they are heated by the hydrothermal circulation below [Pribnow and Clauser, 2000; Pribnow and Schellschmidt, 2000]. Thefirst-order permeability at the borehole scale is characterized by temperature anomalies on tem-perature profiles at thermal equilibrium, mud losses, and methane emissions [Davatzes and Hickman, 2005b; Mas et al., 2006; Dezayes et al., 2010; Genter et al., 2010; Bradford et al., 2013] which are dynamic information additional to the static information given by the acoustic image logs. In sandstones and granite, temperature anomalies are either positive or negative with a sharp shape or wider shape.
GRT-1 is characterized by a null geothermal gradient in the open-hole section indicative of a convective regime (Figure 14b). It is disturbed by one major negative anomaly of 18°C located 5 m below 2368 m MD
Figure 13. The 3-D geometrical modeling of permeable fractures observed in GRT-1 and GRT-2. (a) N-S cross section through GRT-1 and GRT-2, fractures are represented as disk with their strike (white horizontal bar) and dip direction (white vertical bar) on it. (b) Zoom of N-S cross section in the open-hole section of GRT-2. (c) Map view of permeable fractures in GRT-1 and GRT-2, fracture strike is the high bar and fracture dip is the perpendicular small bar. (d) Zoom of permeable fractures in GRT-2 open-hole section. Symbol sizes are according to mud losses observed during drilling operation (see section 4.2). Data are from Table 1.
and extending vertically for over 30 m (Figure 6). The maximum of the anomaly is located below the major permeable fracture (GRT1-FZ2368) in the fresh granite. The high fracture dip could also explain why the thermal profile is perturbed vertically in the borehole. The drilling mud could have invaded laterally but also vertically into the fracture zone, and thus, the temperature decrease could be visible deeper in the well beyond the borehole. The wide negative shape of the anomaly is attributed to remnant cooling of the highly hydrothermally altered granitic section from 2325 to 2370 m MD by mud losses during drilling (Figure 14d). The amplitude of the anomaly increased after the TCH stimulation due to remnant cooling associated with the 7700 m3 of geothermal fluids injected during TCH stimulation [Vidal et al., 2016c; Baujard et al., 2017]. In the granitic basement, the temperature profile of the GRT-1 well is similar to that of the Soultz wells [Pribnow and Schellschmidt, 2000; Baujard et al., 2017].
Figure 14. Conceptual model of permeable fracture zones in Rittershoffen wells. (a) Geothermal wells targeted the Rittershoffen fault zone whose major seismic plane is oriented N-S and dip moderately westward. (b) Temperature pro-files indicate a convection zone below the Triassic sediments and in the granitic basement. (c) Schematic section of the major permeable fracture zone in the granite of GRT-2. (d) Schematic section of the major permeable fracture zone in the granite of GRT-1.
GRT-2 is characterized in the open-hole section by an 18°C/km geothermal gradient and six localized tempera-ture anomalies (two in the sandstones and four in the granite) (Figure 8). In the granitic basement, the temperature profile is disturbed by one major dual positive-negative anomaly which is interpreted as the ther-mal signature of the major permeable fracture zone between 2766 and 2800 m MD (Figure 14d). The positive part, with a maximum located at 2770 m MD, corresponds to the localized hot brine inflow through fluid pathways from 2766 to 2795 m MD (GRT2-FZ2767, -FZ2770.5, -FZ2774, -FZ2787, and -FZ2788). The negative part below, with a minima located at 2795 m MD, is interpreted as a more disseminated zone corresponding to the remnant cooling of the fractured and porous zone until 2800 m MD. Moreover, the temperature profile in GRT-2 is disturbed by three other temperature anomalies in the granitic basement and two others in the sandstones that, in terms of depth, correlate with permeable fracture zones observed at the borehole scale. At the top of the granitic basement, a sharp positive anomaly is attributed to local fractures (GRT2-FZ2534 and GRT2-FZ2540). Deeper, two large negative anomalies are observed in the granitic basement: minimums are observed at 2960 m MD and at 3060 m MD, whereas standard geophysical logs indicate fractures at 2950 m MD and 3050 m MD. Upward in sandstones, the amplitudes of the thermal anomalies are smaller in terms of amplitude: (1) in the Triassic sandstones, the wide positive anomaly, with a maximum located at 2263 m MD, is associated with two fracture couples separated by 20 m width of highly fractured and low-porosity matrix; (2) in the Permian sandstones, the wide negative anomaly peaks at 2464 m MD and is situated below an open fracture (GRT2-FZ2455) surrounded by sealed fractures in the low-porosity matrix. In GRT-2, the higher geothermal granite and the several temperature anomalies suggest consequently more complex circulation at the borehole scale.
Several negative anomalies are shifted downward compared to fractures observed in boreholes images in GRT-1 (at 2380 m MD) and in GRT-2 (at 2464 m, 2795 m 2960 m, and 3060 m MD), whereas the depths of the positive anomalies in GRT-2 (at 2263 m, 2537 m and 2770 m MD) correspond to the depths of open frac-tures at the borehole scale. Inflow probably occurs through the main fluid pathway in GRT-1 (at 2368 m MD), but its thermal impact is likely hidden by the superimposed cooling effect of the highly hydrothermally altered granite.
5.3. Scale of Permeability Into Rittershoffen Reservoir
The geothermal wells GRT-1 and GRT-2 targeted the local normal Rittershoffen fault zone (Figure 14a). At seis-mic scale, the local normal fault of Rittershoffen presents a main fault plane, which strikes nearly N-S, dips 45°W, and has a 200 m apparent vertical offset (Figure 1) [Baujard et al., 2017]. The Rittershoffen fault zone is connected to a dense vertical network of natural individual fractures. A complex convective system could circulate through this natural fracture network. In the nearby Soultz wells, Sausse and Genter [2005] proposed that two types of permeable fractures are superimposed in the geothermal granitic batholith reservoir: (1) a wide and regular primary network of thin fractures and (2) thick local secondary permeable fractures which are studied in the present Rittershofen wells. The latter is afirst-order permeability that responds quickly, whereas the small-scale fracture network is related to a long-term permeability.
The probability that the vertical trajectory of GRT-1 intersects a vertical fracture network is low. The unique thermal anomaly in the granitic basement of GRT-1 suggests that the well intersects once the natural fracture network connected to the Rittershoffen fault zone. The initial productivity of the well is low with a productiv-ity index of 0.60 L/s/bar [Baujard et al., 2017]. Although the GRT-2 trajectory is parallel to northern branch of the Rittershoffen fault, the inclined trajectory provides a higher probability of intersecting permeable frac-tures and could contribute to the higher productivity of the well. The various thermal anomalies in the grani-tic basement and the sandstones of GRT-2 suggest that the well intersects the natural fracture network connected to the fault zone several times. The initial productivity of the well is characterized with a produc-tivity index higher than 3 L/s/bar [Baujard et al., 2017]. The well inclination has a very important role in the probability to intersect permeable fractures and could explain the difference of productivity between both wells.
At the borehole scale, permeable fracture zones are composed of severalfluid pathways with a complex and asymmetric organization. The thickerfluid pathways are located at 2368 m MD, i.e., 2352 m TVD, and at 2774 m MD, i.e., 2393 m TVD, in GRT-1 and GRT-2, respectively. In both wells, they are roughly parallel struc-tures that are oriented N170°E and dip westward (Figure 13c). They are both collinear to the direction of the Rittershoffen fault, known at the base of the Triassic sediments from seismic scale. A fault zone is too complex
Journal of Geophysical Research: Solid Earth
10.1002/2017JB014331
to simply link the Rittershoffen fault plane to the fracture zones observed at the borehole scale. One hypoth-esis could be that the Rittershoffen fault plane is winding and has a variable dip. It was intersected in GRT-1 at 2352 m TVD with a 55°W dip and in GRT-2 at 2393 m TVD with a 64°W dip. If both of these structures represent the same Rittershoffen plane, the fault would need to exhibit a small twist eastward, not observed at seismic scale, between GRT-1 and GRT-2 trajectories. The fault zone would present a better connection to the fracture network and thus more permeability in the area of GRT-2. The second hypothesis is that the Rittershoffen fault zone is composed of several nearly parallel planes oriented N-S and dipping westward. The GRT-1 well could intersect one plane dipping 55°W at 2352 m TVD, and the GRT-2 well could intersect a second plane dipping 64°W at 2393 m TVD located to the east of the plane intersected by GRT-1 and presenting a better connection to the fracture network and thus higher permeability. Nevertheless, the hydraulic data during low-pressure injection of water of the TCH stimulation raise the question if this well really intersects the main fault plane [Baujard et al., 2017].
At larger scale, during the low-pressure injection of water of the TCH stimulation, induced seismicity activity was monitored [Maurer et al., 2015]. A 2-D approach reveals a microseismic cloud oriented N25°E and dipping westward [Lengliné et al., 2017]. The cloud intersects GRT-1 trajectory but not GRT-2. The relative location of microseismic events is uncertain in the three space directions. Shifts of several tens of meters may exist. Focal mechanisms of the two biggest events were calculated and correspond to this orientation N25°E. However, it is challenging from two focal mechanism values to extrapolate at 3-D reservoir scale that it is the dominant orientation. Moreover, it was demonstrated at Soultz that the larger-magnitude events are not representative to the background microseismicity cloud [Cuenot et al., 2008]. The N25°E orientation is mainly observed at the borehole scale, especially at 2000 m MD in GRT-1 within the sandstone (Figure 6a). Deeper, this direction exists in the granite even the fracture orientations are more scattered (Figure 6b). In GRT-2 this N25°E direc-tion is not dominant where fracture geometry presents a relative stability [Vidal et al., 2016b] or at the seismic scale [Baujard et al., 2017]. At Soultz, several kilometer lengths of borehole log analysis in the Soultz granite recorded with the same acoustic borehole tool clearly illustrate a dominating fracture orientation in the base-ment around N160°E [Genter and Traineau, 1996; Genter et al., 1997; Valley, 2007]. However, the focal mechan-isms present a high variability and are not representative of the fracture orientations at the borehole scale [Horálek et al., 2010; Schoenball et al., 2012]. Without a more representative panel of focal mechanisms, a the-ory would be a growth of a seismic cloud oriented N25°E induced on roughly NS and EW trending structures that are ordered in an echelon like arrangement as proposed after development of Basel geothermal reser-voir [Häring et al., 2008].
Therefore, high-precision mapping of the induced seismicity is a good method highlighting structures in the granitic basement; however, it does not necessarily correspond to the primarily permeable structures into the reservoir.
6. Conclusions
Several hundred natural fractures intersect the respective open-hole sections of two recently drilled geother-mal wells, GRT-1 and GRT-2, at Rittershoffen in the Upper Rhine Graben (France). Their structural analysis shows a nearly conjugated pattern of subvertical fracture oriented N170°E and dipping eastward and west-ward. The natural fracture location correlated with various geophysical logs and mud-logging data reveals that a few of them show evidence of natural permeability during and after drilling operations. Temperature anomalies, mud losses, and gas emissions are good indicators of permeable structures at the borehole scale when they are spatially correlated to fractures observed in acoustic image logs or caliper logs. Positive temperature anomalies are associated with geothermal water inflow through the main permeable fractures. Negative temperature anomalies are associated with the cooling of the porous and fractured altera-tion zones which are invaded by drilling mud during drilling operaaltera-tions and/or water injecaltera-tions. One major permeable fracture zone was intersected in the granitic basement of GRT-1. In GRT-2, two permeable fracture zones were observed in sandstones, and four permeable fracture zones were observed in the granitic base-ment. The permeable fractures are mainly striking N170°E and dip steeply westward or eastward. Main frac-ture zones in GRT-1 at 2368 m MD (2352 m TVD) and in GRT-2 at 2774 m MD (2393 m TVD) are N170°E oriented and dip westward. The geometrical modeling shows that they are parallel to the local Rittershoffen fault initially targeted. However, the geometrical modeling is limited to the immediate